o Investor Sentiment for Out-of-Province Businesses
Government Policies
Labour Shortages
Employee Well-being and Inclusion
Indigenous Relationships and Reconciliation
Climate Action
Population Health and Community Safety
Technology Adoption
Infrastructure Preparedness
Section II: Ontario’s Economic Outlook
Provincial Analysis (Summary)
Risk Factors
o Geopolitical and Trade Uncertainty
o Productivity and Investment Challenges
o Labour Market Trends
o Housing Market Conditions
o Households
o Commercial
o Government
Regional Economic Outlook
Section III: Pillars for Prosperity
Key Highlights
The OCC’s 2026 Ontario Economic Report (OER), now in its tenth year, describes an economy under sustained pressure but showing surprising resilience.
Managing uncertainty is not new for Ontario businesses. Over the past decade, they have navigated successive shocks, most notably the COVID-19 pandemic, which drove a sharp decline in business confidence.
Today, the chaotic first year of U.S. tariffs has led to both higher costs and heightened uncertainty. Business confidence, however, remains remarkably stable and higher than levels reported during the pandemic and its inflation highs.
Businesses are adapting by absorbing shocks, managing risk, and focusing inward to sustain their operations. It is also apparent that both the existing tariffs and the persistent threat of new ones are disrupting supply chains and delaying investment decisions.
Ontario’s central challenge for the decade ahead is to convert resilience into greater competitiveness, sustainable growth and more inclusive prosperity. This requires a sustained focus from both business and government on fostering entrepreneurial growth, incentivizing investment, improving productivity, enabling diversification and managing costs – while making integrated investments in Ontario’s talent, infrastructure and communities.
Highlights of the Business Confidence Survey:
Business confidence remains low and largely unchanged. Only 23 per cent of businesses are confident in Ontario’s economic outlook, down from 26 per cent in the previous business confidence survey, while a majority (52 per cent) are not confident, reinforcing a continued “wait-and-see” posture. Confidence varies significantly by region, with weaker sentiment outside major urban centres.
Cost pressures remain the dominant driver of pessimism across the province, with businesses continuing to cite cost of living, inputs and operations, and inflation as the top factors weighing on confidence.
Businesses remain more confident in their own outlook than in the broader economy. 52 per cent report confidence in their own organizational outlook, up 3 per cent from a year ago. Approximately 40 per cent expect revenue growth in 2026, underscoring continued firm-level resilience despite macroeconomic uncertainty.
Despite partial relief from CUSMA provisions, trade uncertainty is driving operational changes across the province. Nearly twothirds of businesses (65 per cent) expect tariffs, trade policies, and broader economic uncertainty to have negative impacts, prompting responses such as price increases, supplier diversification, absorbing higher costs, and workforce reductions. Impacts are most pronounced in trade-exposed regions in the province, such as Windsor-Sarnia, Kitchener-Waterloo-Barrie, and the Hamilton-Niagara Peninsula.
Ontario competes well as an investment destination, but there is room for improvement. Nearly half of businesses headquartered outside the province indicate they would likely expand in Ontario (49 per cent), a level comparable to interest in expanding elsewhere in Canada (50 per cent), and higher than interest in expansion to the U.S. (45 per cent) or internationally (41 per cent). However, respondents express significant concerns about the costs of doing business, trade uncertainty, market access limitations and gaps in skilled talent. Only one-third of out-of-province businesses agree that Ontario is an attractive investment destination, and fewer than one-third agree that finding information on government investment supports easy to access.
Policy priorities reflect the need for near-term relief and longer-term certainty, with businesses expressing support for strengthening domestic demand (e.g., through reducing interprovincial trade barriers and "buy local" campaigns) and calling for targeted financial support, tax simplification, and improved policy coordination between decision makers.
Self-reported labour shortages persist, but at historically lower levels and concentrated in specific sectors and regions.
Within workplaces, businesses are striving to address employee needs. 58 per cent of businesses agree that supporting diversity, equity, accessibility and inclusion (DEAI) and employee mental health are important to their success. Businesses reporting having formal DEAI strategies has grown slightly to 48 per cent, and a similar number (49 per cent) offer mental health supports to employees. While 70 per cent of respondents believe working together in-person is important to their success, 45 per cent say the same about offering hybrid or flexible work options.
Technology adoption is advancing, but unevenly. Just over half (52 per cent) of businesses report moderate or extensive use of emerging technologies, including artificial intelligence (AI), while a significant share continues to report limited uptake, citing cost, skills gaps, and uncertainty around return on investment.
Fewer than half of businesses believe Ontario is prepared to meet future community infrastructure needs, while challenges related to community safety, mental health, and housing affordability affect operations, workforce stability and competitiveness.
Readiness for Indigenous economic reconciliation and climate action remains uneven. While many businesses recognize the value of participation in the Indigenous economy and in enhancing business efficiency and sustainability through climate action, cost pressures and limited internal capacity continue to constrain progress beyond early or compliance-driven efforts.
Highlights of the 2026 Economic Outlook:
Ontario’s real gross domestic product (GDP) is projected to grow by 1.2 per cent in 2026, following a subdued 1.4 per cent in 2025, as the economy adjusts to U.S. tariff impacts and weaker economic conditions.
Inflation is expected to remain within the 1-3 per cent target range, supported by softer demand and slower growth, though global supply-side pressures may keep some business costs elevated.
Unemployment in Ontario remains high at 7.6 per cent heading into 2026, among the highest in Canada, as employment growth cools and population growth slows.
Productivity challenges persist. While real GDP per capita reported minor improvements given slower population growth, labour productivity has stagnated and continues to weigh on long-term competitiveness.
Business investment remains weak and uneven, with declines in machinery, equipment, and IP investment despite pockets of momentum from EV, battery, and critical minerals-related projects. Firms remain cautious, prioritizing routine maintenance over expansion.
Housing and household pressures continue to strain economic growth. Housing starts fell sharply, and affordability remains tight, while elevated household financial pressures constrain consumer spending.
Regional disparities are expected to widen in 2026. While most regions face higher unemployment and minimal population growth, northern regions experience modest gains linked to mining and critical mineral development.
As businesses contend with these circumstances, the Ontario Chamber recommends an economic strategy that focuses on growth-enabling policies and strategic investments in four areas: creating a globally competitive business environment; building growth-enabling infrastructure; ensuring healthy, sustainable communities; and investing in a highly skilled workforce. Amidst low business confidence and a slow-growing economy, these are the fundamentals of inclusive, sustainable prosperity.
Section I:
Business Confidence Survey
Purpose and Methodology
Leger, the largest Canadian-owned market research and analytics company, conducted this Business Confidence Survey (BCS) between October 16th and December 4th, 2025, using Leger’s online panel and representatives from local chambers of commerce, boards of trade, and organizations from the OCC's broader network. 1,660 respondents completed the survey, representing a broad cross-section of industries, regions, and types of organizations across the province1 .
1 No margin of error can be associated with a non-probability sample (i.e., a web panel in this case). For comparative purposes, a
probability sample of 1660 respondents would have a margin of error of ±2.4%, 19 times out of 20.
Business Confidence
Business confidence refers to the level of optimism or pessimism businesses report regarding economic conditions, as measured by survey responses on the provincial economic outlook and their own business prospects. This year’s results show that business confidence remains low, with little change from a year ago, notwithstanding the emergence of tariffs as a major issue in 2025.
Just 23 per cent of businesses report confidence in the province’s economic outlook, down 3 per cent from last year, while over half (52 per cent) report being not confident.2 The remaining quarter remains neutral, reinforcing a broad “wait-and-see” posture across the business community.
1: How confident are you about Ontario’s economic outlook?3
This sustained caution reflects persistent economic pressures rather than a single shock. Figure 2 shows that business confidence has varied considerably over the past ten years, with both rises and declines shaped by shifting economic conditions. Confidence has somewhat rebounded from the post-pandemic lows of 2022 and 2023, and remains within the range seen at various points in the past decade. Elevated costs, economic uncertainty, and ongoing impacts from U.S. tariffs weigh on overall sentiment.
2 Unless noted otherwise, confidence is measured in net, combining somewhat and very confident. Likewise, not confident is measured in net, combining not at all confident and somewhat not confident. Note that a ±1% discrepancy may exist between disaggregated and aggregated (net) data due to rounding. subsequent year.
3 Note: Annual Business Confidence Survey responses are collected in the fourth quarter of a given year, while survey findings are reported through the Ontario Economic Report in the first quarter of the
Figure
Figure 2: Confidence in Ontario's Economic Outlook
Consistent with findings from the previous two Ontario Economic Reports, high costs continue to be the primary drivers of business pessimism about Ontario’s economic outlook. Businesses most frequently cite the cost of living (75 per cent), cost of inputs or operations (61 per cent), and inflation (58 per cent) as factors lowering their confidence. Concern about input and operating costs has intensified, rising from the fourth most-cited factor in the previous BCS at 51 per cent to the second-highest driver of pessimism in 2025 at 61 per cent. This shift underscores the growing impact of affordability pressures on business confidence. While these cost challenges are widespread, the data also suggest that regional confidence is further influenced by exposure to trade and supply chain volatility, localized housing constraints, and labour market pressures.
Cost of living
Cost of inputs or operations
Inflation
Housing affordability/ housing supply challenges
National/global economic outlook
Trade and supply chain barriers/uncertainty
High business taxes
care
and staffing shortages
Buy local and/or travel local campaigns
Skilled and productive workforce
Technological innovation
Preference for domestic sources in procurement
Strong consumer demand/confidence
Domestic manufacturing capacity and supply chains
Strong diversity, equity, and inclusion
economic outlook
competitive advantage over other jurisdictions
Optimistic respondents tend to cite domestic and localized factors rather than broader macroeconomic conditions. “Buy local” and “travel local” campaigns are the most frequently cited drivers (44 per cent) of optimism, followed by the availability of a skilled workforce and technological innovation (both at 33 per cent). Strong consumer demand and domestic procurement preferences also feature prominently, underscoring that confidence is strongest where businesses can rely on local demand and internal adaptability.
Figure 3: Top Reasons for Pessimism
Figure 4: Top Reasons for Optimism
Confidence by Business Size, Sector and Region
Business confidence varies significantly by organization size. Small businesses remain the least confident, with just 20 per cent expressing optimism (17 per cent somewhat confident and 3 per cent very confident), down from 25 per cent a year earlier, reflecting their limited capacity to absorb costs and manage uncertainty. Confidence is higher among mid-sized (34 per cent) and large businesses (35 per cent), year-over-year, suggesting greater resilience tied to scale, access to capital, and diversified operations.
Figure 5: Confidence in Ontario’s Outlook (small, medium, and large organizations)
Confidence continues to diverge sharply by industry sector (see Figure 6). Utilities report the lowest level of confidence (13 per cent), while arts, entertainment and recreation (14 per cent) and real estate and rental and leasing (17 per cent) also remain subdued amid affordability pressures, weak discretionary spending, and low home sales activity.
By contrast, confidence rebounded strongly in the information and cultural industries4 sector (40 per cent), which now reports the highest confidence levels. This improvement likely reflects workforce gains in the sector, digital adoption, and stabilization in business-to-business demand.
Management of companies and enterprises (37 per cent), wholesale trade, and transportation and warehousing (33 per cent each) also follow suit.
4 Statistics Canada defines this sector as establishments primarily engaged in producing and distributing information and cultural products, excluding wholesale and retail activities. Examples of subsectors include publishing, broadcasting, telecommunications, data processing, and digital media services, and excludes arts, entertainment and recreation.
Figure 6: Confidence in Ontario’s Economic Outlook by Sector
Regionally, confidence remains lowest in Kingston-Pembroke (15 per cent), Windsor-Sarnia (17 per cent) and Stratford-Bruce Peninsula (17 per cent), where businesses face structural vulnerabilities, driven largely by rising operational and living costs, labour market shifts and trade uncertainty. Confidence is relatively higher in Northwestern Ontario (33 per cent), likely tied to recent government and business investments aimed at revitalizing critical mineral mining and manufacturing sectors. Large urban areas, such as the Greater Ottawa Area (29 per cent) and the Greater Toronto Area (28 per cent) follow, where ample labour supply, higher productivity, and sustained investments support regional stability. Despite these advantages, a substantial share of businesses in these regions remain unconfident, underscoring the breadth of uncertainty across Ontario.
Confidence in Own Organizational Outlook
Despite weak confidence in the broader economy, businesses continue to express greater confidence in their own organizations. Over half (52 per cent) report confidence in their own organizational outlook, up 3 per cent from a year ago, compared with just 23 per cent who are confident in Ontario’s economy.
This 29-point “internal-external confidence gap” continues a trend from previous years and likely reflects businesses’ resilience in withstanding pressures and their greater ability to shape their own organizations’ destinies.
Aligned with the broader findings, confidence in organizational outlook is also largely driven by internal and local factors. Almost two-thirds of businesses surveyed (65 per cent) cite strong demand for their products and services as key drivers of optimism, followed by “buy local” or “travel local” campaigns (32 per cent) and the adoption of new technologies such as artificial intelligence (26 per cent). By contrast, non-confidence reflects the same pressures weighing on Ontario’s economic outlook, with over half citing the cost of inputs (54 per cent), cost of living (53 per cent) and inflation (51 per cent) as key reasons for organizational pessimism.
Figure 7: How confident are you in your own organization's economic outlook as of right now?
Business Growth
In 2026, Ontario businesses are more likely to anticipate growth than contraction in their revenue, investments, staffing and business footprint, though expectations remain cautious and uneven. Forty per cent of businesses expect revenue growth while fewer anticipate higher investment (26 per cent), staffing (24 per cent), and business footprint (22 per cent), signalling selective expansion rather than broad-based scaling.
Figure 8: Past 12 Months and Next 12-Month Outlook
2025 performance underscores this caution. Similar numbers of respondents report growth (30 per cent) and decline (31 per cent) in revenue, illustrating widely different experiences in different sectors. Revenue contractions were most pronounced in labour organizations (54 per cent) and construction (44 per cent), underscoring the heightened pressures facing labour-intensive goods-producing sectors amid rising operating costs and unstable demand. Management of companies and educational services also reported elevated revenue declines (both at 47 per cent). Reduction in revenue for educational services is likely linked to reduced international student enrollment following federal immigration policy changes. By contrast, finance and insurance businesses (55 per cent) recorded the strongest revenue growth, reflecting more resilient demand.
Investment activity remains more subdued than revenue growth. Only 19 per cent of businesses reported investment growth, matching the 19 per cent of those that reported reductions. Investment pullbacks were highest in labour organizations (46 per cent), followed by information and cultural industries (36 per cent), and educational services (32 per cent), while investment growth was concentrated in utilities (38 per cent); finance and insurance (36 per cent); and agriculture, forestry, fishing and hunting (29 per cent).
Figure 9: Top Sectors Reporting Investment Reductions
Figure 10: Top Sectors Reporting Investment Growth
Staffing and physical expansion have been comparatively restrained. Staffing reductions (20 per cent) slightly exceeded growth (17 per cent), indicating cautious workforce adjustments, while changes to business footprint were limited, with only 18 per cent reporting expansion. Workforce growth where it occurred was strongest in administrative and support, waste management and remediation services, finance and insurance, health care and social assistance, transportation and warehousing, and mining, quarrying and oil and gas extraction, reflecting sustained demand in essential and logistics-driven sectors.
Growth experiences and expectations vary sharply by business size. Small businesses were more likely to report revenue declines than growth over the past year, highlighting greater exposure to cost pressures and demand uncertainty. Medium-sized businesses show a more balanced profile, with modest revenue growth and a high proportion reporting increases in investment and staffing. Large businesses report the strongest recent momentum, with higher rates of revenue growth, investments, and footprint expansion, alongside elevated staffing reductions, than small and medium-sized businesses, suggesting a combination of expansion and restructuring.
Looking ahead to 2026, large businesses remain the most growth-oriented across most indicators, reflecting greater capacity to scale and manage uncertainty. Small businesses anticipate relatively strong revenue growth but remain cautious on investment, hiring, and business footprint decisions, while medium-sized businesses report the most consistent expansion outlook across measures.
Overall, the findings point to cautious optimism affected by uneven growth capacity, reinforcing the importance of policies that reduce risk, improve predictability, and support businesses at different stages of growth.
Figure 11: Shifts in Business Activity in the Last 12 Months by Business Size
Trade Uncertainty and Investor Confidence
Trade uncertainty has emerged as a significant factor shaping business behaviour. Nearly two-thirds of organizations (65 per cent) expect U.S. tariffs, trade policies, and economic uncertainty to have negative impacts on their operations, compared with just 8 per cent anticipating any positive effects. In response, businesses are already adjusting through price increases (25 per cent), supplier diversification (22 per cent), absorbing higher costs (20 per cent), expanding marketing sales to Canadian customers (17 per cent) and, in some cases, workforce reductions (12 per cent).
Notably, 15 per cent have not responded to U.S. trade policies, despite experiencing the effects. These responses indicate that trade uncertainty is no longer a theoretical risk but an active constraint on business planning and investment.
The impacts of trade uncertainty vary by region and sector. Trade-exposed and manufacturing-dependent regions report the highest levels of concern, most notably Windsor-Sarnia, the Greater London Area, and Muskoka-Kawarthas (each with 74 per cent of businesses reporting negative impacts), followed by Kitchener-Waterloo-Barrie (73 per cent), Hamilton-Niagara Peninsula (70 per cent), and parts of Northern Ontario (up to 69 per cent). Similarly, trade-dependent and goods-producing sectors anticipate more intense negative impacts, with 83 per cent of businesses in the manufacturing sector, 78 per cent in construction, and 80 per cent in accommodation and food services reporting expected negative effects, reflecting their exposure to volatility in demand, input costs, and cross-border supply chains.
Figure 12: Top 3 Business Responses to U.S. Trade Policies, such as Tariffs on Canadian Goods
Figure 13: Perceived Impact of Tariffs, Trade Policies, and Economic Uncertainty by Region
Figure 14: Top 10 Sectors Reporting Negative Impact from Tariffs, Trade Policies, and Economic Uncertainty
Confidence in the resolution of Canada-U.S. trade issues remains low, reinforcing a cautious outlook. Over six in ten businesses (61 per cent) report being not confident in the likelihood of resolving trade disputes or renegotiating CUSMA on acceptable terms for Ontario and Canadian businesses, while only 16 per cent express some degree of confidence. This lack of confidence cuts across regions and industries, underscoring how persistent trade uncertainty and affordability pressures are dampening the investment environment. These sentiments reflect global headwinds and heightened pressures on Ontario’s trade-exposed economy, reinforcing the need to strengthen local production and diversify trade relationships.
Investor Sentiment for Out-of-Province Businesses5
Ontario continues to compete well as an investment destination. Nearly half of out-of-province businesses indicate they would be likely to expand in Ontario (49 per cent), a level comparable to interest in expansion elsewhere in Canada (50 per cent), and higher than the proportion likely to expand to the United States (45 per cent) or internationally (41 per cent). This suggests that Ontario retains important foundational strengths, even as broader economic uncertainty tempers investment decisions.
Out-of-province businesses remain cautious about investment due to limited confidence, low engagement with government supports, and heightened trade uncertainty. Only 33 per cent of respondents headquartered outside Ontario rate the province’s investment environment as attractive. Fewer than one in three report government investment information easy to find (29 per cent) and feel supported by local or provincial governments when considering expansion (30 per cent). Similar challenges are evident among Ontario-headquartered firms, suggesting that awareness, clarity, and accessibility of supports remain key barriers to investment confidence.
Perceptions of Ontario as an investment destination highlight clear areas for improvement. Cost of doing business stands out as the most significant constraint, with 73 per cent identifying it as an area needing improvement, reflecting Ontario’s scale and proximity to major markets, while availability of skilled talent and infrastructure are more mixed, suggesting foundational assets remain but are increasingly strained. These sentiments highlight that key competitiveness challenges are driven by cost pressures, policy certainty, and execution capacity.
5 Findings in this sub-section are based on responses answered only by respondents headquartered outside Ontario (n =126).
Figure 15: How would you rate Ontario on each of the
Government Policies
Ontario businesses identify targeted financial support, tax simplification, and improved policy coordination as their most important public policy priorities (Table 1). These priorities reflect the dual pressures businesses face: the need for near-term cost relief amid trade and economic uncertainty, alongside demand for greater predictability to support longer-term planning and investment.
Expanding direct incentives or supports for businesses, including simplified taxes, remains the top public policy priority at 36 per cent. Similar numbers (34 per cent) seek better alignment of policies, regulations, and programs across all levels of government. Together, these results highlight that businesses want quick support to manage rising costs and trade risks, but also need stable, coordinated policies that build confidence and reduce red tape.
Beyond cost relief and coordination, businesses also emphasize the importance of workforce development (28 per cent), tariff response supports (28 per cent), regulatory stability and predictability, and affordable housing (both at 26 per cent), underscoring how labour constraints, trade exposure, and uncertainty continue to weigh on confidence and investment decisions.
Table 1: Top 10 Policy Priorities for Ontario Businesses
Public Policy Priorities
Tariff response supports (e.g., tax incentives or deferrals, grants, export development
Share of Respondents
Address health care system capacity (e.g., lack of funding, primary care access, wait times, surgical and procedural backlogs, labour and training gaps, mental health and addictions resources)
Strengthen local supply chains, commercial transportation options, and last-mile connections
Priorities vary meaningfully by business size, reflecting different cost pressures and growth constraints. Across all business sizes, tariffrelated measures are a key imperative. Small businesses are most likely to prioritize direct incentives and supports (40 per cent), alongside better alignment of policies across governments (35 per cent). Consistent with previous OCC Business Confidence Surveys, mid-sized and large businesses place relatively greater emphasis on improved intergovernmental policy alignment (30 per cent and 34 per cent, respectively) and workforce development (32 per cent and 30 per cent), reflecting a need for more predictable talent pipelines and greater certainty amid trade and supply chain volatility.
Sectoral patterns further illustrate how policy needs are shaped by operational realities. Cost relief and direct incentives are most frequently cited in administrative and support services (56 per cent) and accommodation and food services (55 per cent), sectors facing persistent margin and cost pressures. Policy and regulatory alignment is a key concern in utilities, government, and real estate and rental and leasing, reflecting exposure to shifting funding and regulatory frameworks. In manufacturing, workforce development and investments in advanced manufacturing (both at 42 per cent) and trade and supply chain supports (52 per cent) emerge as top priorities.
Cost relief and workforce-related supports consistently emerge as top concerns across groups. Expanding direct incentives and supports for businesses is the most frequently cited priority, particularly among businesses led by individuals belonging to equity-deserving groups, including new Canadians, visible minorities, and women, reflecting structural constraints in access to capital and financing.
Labour Shortages
Reports of labour shortages persist across Ontario but have eased significantly from pandemic-era peaks, masking sharp differences by sector and region. A quarter of respondents (25 per cent) agree that their organization is currently facing a labour shortage, while 28 per cent expect one to emerge in 2026. While labour availability remains a concern for many employers, this represents a substantial improvement from 2022, when more than half of businesses reported shortages. Latest findings reflect slower hiring, workforce tightening, and greater caution amid economic and trade uncertainty.
Agree or Strongly Agree
or Strongly Disagree
Despite this improvement, labour shortages remain high in labour-intensive and resource-based industries. Businesses in mining, quarrying, and oil and gas extraction report the highest incidence, with 60 per cent agreeing their organization is currently facing a labour shortage. Elevated shortages are also reported in agriculture, forestry, fishing and hunting (42 per cent), and in sectors that rely heavily on seasonal work, specialized skills, and aging workforces. These patterns align with longstanding structural constraints rather than short-term demand spikes.
Figure 16: Our organization is facing a labour shortage.
Figure 17: Top 10 Sectors with Self-Reported Labour Shortages in their Organization
(NET) Agree Neutral (NET) Disagree I don’t know/prefer not to answer
Mining, quarrying and oil and gas extraction
Labour organizations
Agriculture, forestry, �shing and hunting
Accommodation and food services
and warehousing
Regional results reinforce these dynamics. Businesses in Northern Ontario and trade-exposed regions report higher-than-average shortages, including Northeastern Ontario (39 per cent), Northwestern Ontario (30 per cent), and Windsor-Sarnia (28 per cent). In Windsor-Sarnia, concerns intensify at the sector level, with more than half of businesses (53 per cent) reporting that their sector is currently facing, or expects to face, a labour shortage. This reflects the combined pressures of an aging workforce, tight local labour pools, and exposure to global trade volatility in highly integrated manufacturing regions.
Figure 18: Our organization is facing a labour shortage (by region).
Muskoka-Kawarthas Greater Toronto Area Kitchener-Waterloo-Barrie
London Area
When asked about the drivers of labour shortages in their industry, businesses most frequently point to a lack of available skilled workers, challenges attracting and retaining talent, retirements of experienced employees, and compensation mismatches. These responses suggest that shortages are less about short-term hiring challenges and more about structural workforce constraints such as demographic shifts, training gaps, housing availability, and regional capacity limits.
Addressing these pressures will require place-based solutions that connect workforce development, housing, training, immigration pathways, and infrastructure investment. Recent OCC work, including its Mining 2030 report, underscores how labour supply challenges in northern and resourcedependent regions are closely tied to gaps in training access, housing, and community infrastructure, reinforcing the need for integrated, regionally tailored workforce strategies.
Employee Well-being and Inclusion
Ontario businesses increasingly see employee well-being and inclusion as important to organizational success, but execution continues to lag intent, largely due to limited capacity, unclear pathways, and weak external supports.
A majority of businesses (58 per cent) agree that supporting diversity, equity, accessibility and inclusion (DEAI) and employee mental health is important for success. While fewer than half (48 per cent) report having a formal DEAI strategy, this is up 2 per cent from a year ago. This gap suggests that employers recognize the value of inclusive and supportive workplaces but are at different stages in translating these priorities into formal action. Respondents perceive a lack of adequate supports; just 17 per cent agree that government supports are helping them respond to mental health challenges in the workplace.
Workplace expectations reflect a similar balancing act. While most businesses (70 per cent) agree that in-person collaboration is important, nearly half (45 per cent) also say hybrid work and flexibility are important, signalling that flexibility is viewed as an enhancement to in-person work rather than a replacement. Operational sectors such as manufacturing, construction, transportation, wholesale trade, mining and quarrying, labour organizations and utilities show the strongest preference for in-person work, while sectors such as professional, scientific and technical services, information and cultural industries, management of companies, government, and educational services sectors place greater emphasis on hybrid arrangements.
The data point to the opportunity for more practical, business-ready tools, clearer pathways to implementation, and stronger partnerships to help organizations move from intention to impact.
Government supports are helping my organization/business to respond to mental health challenges in the workplace
Hybrid work options and flexibility are important for our organization’s success
My organization has a Diversity, Equity,Accessibility, and Inclusion (DEAI) strategy
My organization offers a variety of employee mental health resources and supports (in-person/ virtual, prevention/ intervention, etc.)
Supporting DEAI and employee mental health and well-being is important for our organization’s success
Working often together in-person is important for our organization’s success
Figure 19: Workplace Priorities and Practices (% Agreeing)
Indigenous Relationships and Reconciliation
Ontario businesses show a reconciliation readiness gap, with intent being stronger than action. While 30 per cent of businesses express confidence that they can take meaningful action and benefit from advancing reconciliation, only 25 per cent say they know where to start or have the internal knowledge and resources to do so. Just 19 per cent report that they feel supported by governments, industry associations, or Indigenous organizations to advance reconciliation.
Readiness is greatest in regions and sectors with greater exposure to Indigenous populations. Businesses in Northern Ontario report higher confidence across reconciliation measures, suggesting that proximity, partnerships, and regional context may help strengthen readiness and engagement. The information and cultural industries sector reports consistently high confidence in the benefits of reconciliation, readiness to act, and internal capacity. Mining, quarrying, and oil and gas extraction also demonstrate higher internal capacity, with 60 per cent of organizations reporting they have the knowledge and resources to implement reconciliation initiatives, potentially reflecting the sector’s workforce composition and proximity to Indigenous communities.
To expand capacity across all regions and sectors, businesses require clearer pathways to action and more accessible support. The OCC’s Economic Reconciliation Initiative, in partnership with the Canadian Council for Indigenous Business, responds to this need by providing foundational knowledge and guidance for businesses’ implementation of reconciliation calls to action.
Climate Action
Ontario businesses report uneven preparedness in achieving their environmental, emissions-reduction, or climate risk preparation goals. Only 22 per cent of organizations report feeling well-prepared to meet their goals, and a further 29 per cent indicate that these goals are not applicable to their organization, highlighting wide variance in relevance and readiness across the business community.
Preparedness in achieving environmental goals varies by sector. Organizations in utilities (75 per cent), manufacturing (54 per cent), and transportation and warehousing (52 per cent) report feeling only somewhat prepared or not prepared. By contrast, relatively higher levels of preparedness are concentrated among organizations in agriculture, forestry, fishing and hunting (52 per cent), information and cultural industries (44 per cent) and mining, quarrying and oil and gas extraction (40 per cent).
Businesses most frequently identify foundational supports as the most helpful for achieving their environmental goals and managing climate-related events. Energy efficiency programs (33 per cent), waste management programs (31 per cent), and access to affordable clean energy (24 per cent) are cited most often. Demand for more advanced supports, such as climate impact audits, supply chain strategies, and fleet electrification incentives, is comparatively lower across sectors.
The findings suggest that preparedness remains uneven and generally modest, with businesses focused on foundational actions rather than more advanced planning or adaptation measures. Limited internal capacity and financial pressures remain key deterrents to investment in climate strategies.
Figure 20: Which of these climate-related policies or programs would help your organization develop and/or achieve its environmental goals or deal with climate-related events?
Energy efficiency programs (e.g., energy conservation, lighting, HVAC)
Waste management programs (e.g., recycling or circular economy)
Access to affordable clean energy
Climate resilience retrofits and emergency preparedness (e.g., to manage heat, ice, and flood risks)
Resources, information, toolkits, and technologies (e.g., digital twinning, IoTsolutions)
Supply chain strategies (e.g., data and reporting)
Business audits to assess your climate impact and
Population Health and Community Safety
Businesses report that mental health, substance use, and related community challenges are affecting their workplace and the communities where they operate. In some cases, these challenges are evident inside their organizations; in others, they arise from broader community conditions that shape the local operating environment.
Overall, impacts are more commonly reported at the community level than within workplaces. Twenty-five per cent of businesses report that these challenges have affected their workplace, compared with 35 per cent reporting impacts in the communities where they operate, reflecting broader exposure beyond business operations alone.
Northern Ontario businesses report the highest community impacts. Community-level impacts are most pronounced in Northeastern Ontario (63 per cent) and Northwestern Ontario (52 per cent), while workplace-level impacts are higher in Northeastern Ontario (33 per cent), KitchenerWaterloo-Barrie (32 per cent), and Windsor–Sarnia (31 per cent), all above the provincial average. These patterns point to concentrated pressures in smaller, northern, and resource-dependent regions.
Among economic sectors, resource industries report the highest impacts. Mining, quarrying, and oil and gas extraction businesses report the highest impacts across both contexts, with 60 per cent reporting workplace-level impacts and 80 per cent reporting community-level impacts. Elevated community-level impacts are also reported among utilities and government (both at 50 per cent) and non-profit organizations (48 per cent), sectors that are closely embedded in local communities and highly exposed to broader population-level challenges.
These challenges are echoed in a recent study conducted by the Centre of Healthy Communities at Loyalist College, which surveyed businesses primarily in Barrie, Belleville and London and indicated that there are growing concerns related to mental health, addictions, and public safety, such as public drug use, encampments, theft, break-ins and vandalism, requiring businesses to invest in additional security measures. These challenges underscore that safety comes at an added cost for local businesses.6
Taken together, the findings suggest that broader population health and community well-being pressures are increasingly intersecting with business conditions, particularly in regions with limited access to housing, health, and social supports. While these challenges are experienced differently across regions and sectors, they highlight the growing role that community capacity and population health play in shaping workforce stability, operational resilience, and local economic performance.
6 Solmes, A., & Howell, D. (2025). The hidden costs of community safety. Centre for Healthy Communities and Loyalist College Applied Research & Innovation Office. The study draws on survey responses from businesses primarily in Belleville, Barrie, and London. While the findings are not intended to be representative of Ontario, it offers local insights to contextualize provincial trends affecting businesses in these communities related to mental health, addictions, and other public safety challenges.
Technology Adoption
Technology adoption across Ontario businesses is widespread but uneven, reflecting differences in firm size, sector, and internal capacity. Just over half of organizations (52 per cent) report moderate or extensive use of emerging technologies, including AI, data analytics, cloud computing, and automation (compared to 58 per cent in the previous year), while 44 per cent report little to no use (compared to 35 per cent in the previous year). This slight reduction suggests that as businesses test emerging technologies, adoption is becoming more selective, with investments focusing more on technologies that deliver near-term operational value amid growing cost pressures.
Business size shapes both adoption levels and the types of technologies being used. Medium-sized (68 per cent) and large businesses (69 per cent) are significantly more likely to report active use of emerging technologies than small businesses (49 per cent). Small firms tend to adopt accessible, off-the-shelf AI tools, while larger organizations focus on infrastructure, skills development, cybersecurity, and automation, where scale and capital availability support deeper integration.
Barriers to adoption are consistent across business sizes, but vary in intensity. Businesses cite limited internal capacity, funding constraints, uncertainty about where to start, and unclear return on investment as the primary obstacles. These challenges are most acute for small businesses, where cost constraints and lack of in-house expertise significantly shape adoption decisions. Larger organizations, by contrast, are more likely to face integration and organizational complexity challenges as they scale and embed technologies across operations (see Figure 21).
Types of technology investment vary greatly by sector. Digitally intensive sectors such as information and cultural industries (80 per cent), finance and insurance (73 per cent), and professional, scientific, and technical services (71 per cent) report some of the highest levels of adoption, supported by access to talent, capital, and digital maturity. By contrast, labour- and asset-intensive sectors such as mining, quarrying and oil and gas (80 per cent) show more targeted investments in data analytics, while manufacturing (48 per cent) is more focused on automation. Adoption remains limited in agriculture, forestry, fishing and hunting, with nearly a third (32 per cent) reporting the use of and investment in emerging technologies, while adoption is lowest in the accommodation and food services sector (29 per cent).
Overall, technology adoption in Ontario is progressing incrementally and unevenly, shaped by business size, sectoral realities, and risk tolerance. Rather than following a single pathway, firms adopt technologies along a continuum, from basic digital tools to advanced automation. This highlights the importance of policies and program design that meet businesses where they are, reduce risk, and support adoption over time.
Figure 21: What types of investments is your organization making in emerging technologies?
Infrastructure Preparedness
Businesses report growing concern that Ontario’s infrastructure capacity is not keeping pace with either economic or population growth. Fewer than half of businesses feel Ontario is prepared to meet its future needs, signalling that infrastructure readiness is increasingly a constraint on both growth and competitiveness.
Perceived preparedness is highest for energy infrastructure (44 per cent), followed by broadband (41 per cent) and airport- and traderelated infrastructure (37 per cent). This relative confidence in energy likely reflects recent provincial actions, such as Ontario’s Integrated Energy Plan, Energy for Generations, including commitments to grid modernization, transmission expansion, and long-term supply planning to support electrification, advanced manufacturing, and data centre growth. While challenges remain, businesses appear to recognize clearer policy direction and investment signals in the energy system compared to other infrastructure areas.
Housing and housing-enabling infrastructure (59 per cent unprepared) and public transportation and transit (57 per cent unprepared) emerge as the most acute pressure points. While there have been significant provincial and federal funding commitments for housing-related infrastructure, the results suggest a gap between these announcements and what businesses and their workers see in their communities. Businesses increasingly view housing availability, transit, and transportation networks as binding constraints on workforce attraction, retention, and daily operations.
While businesses report comparatively higher preparedness for airport- and other trade-related infrastructure, concern in these areas remains elevated at 46 per cent. This perceived lack of readiness raises risks for Ontario’s export capacity, supply chain resilience, and regional connectivity, particularly amid trade uncertainty and tariff pressures.
Sectoral and regional patterns reinforce these findings. Infrastructure gaps are most pronounced in manufacturing, mining, oil and gas, transportation, utilities, educational services, and management of companies where reliable access to energy, transportation, housing-enabling and broadband infrastructure is essential to operations. Regionally, perceived preparedness is consistently higher in major urban centres such as the Greater Toronto and Ottawa Areas, while northern regions report significantly lower levels of preparedness, particularly for housing, transportation, and trade infrastructure.
These regional disparities align with the OCC’s recent analysis of Northern Ontario’s mining and critical minerals potential in the Mining 2030 report, which highlights the importance of roads, highways, and transportation corridors in connecting northern resource development to southern manufacturing hubs. Without coordinated, place-based infrastructure investment, these gaps risk constraining growth, trade, and competitiveness across the province.
Figure 22: How well-prepared do you feel Ontario is to address each of the following growing infrastructure needs?
Energy demand (e.g., data centres, grid modernization, energy supply mix)
Transit and public transportation (e.g., roadways, highways, forest access roads, Northlander, high-speed rail, light rail transit)
Airports, marine ports, and multi-modal hubs (e.g., last-mile and intermodal connections)
(e.g., stormwater and wastewater, etc.)
Unless noted otherwise, the following analysis uses forecasted data made available January 14, 2026.
Provincial Analysis (Summary)
Despite being home to a larger share of U.S. trade-exposed industries and highly integrated supply chains, Ontario’s economy has once again demonstrated notable resilience amid persistent economic disruptions and uncertainty. One year into the introduction of U.S. tariffs, economic performance remains subdued, with recent estimates suggesting Ontario’s real GDP grew by 1.4 per cent in 2025 (compared to pre-U.S. tariff forecasts of 2.1 per cent). This outcome reflects adaptive behaviour by firms and households rather than strong underlying growth (Table 2).
Forecast revisions also suggest that the province has avoided the most severe outcomes initially anticipated, with real GDP growth projected to remain positive at 1.2 per cent in 2026. Moreover, the Consumer Price Index (CPI) illustrates ongoing success for the Bank of Canada’s monetary policy, with inflation remaining within its 1-to-3 per cent target range. Looking ahead, softer economic growth, weaker demand, and the absence of retaliatory tariffs by Canada should continue to support core inflation staying within range.
Despite several economic indicators pointing to better-than-expected performance, the provincial economy has yet to overcome significant structural barriers. Unemployment is rising across nearly all of Ontario's economic regions – among the highest in Canada and veering toward pandemic-era territory; productivity growth remains weak, and business investment has yet to recover to levels consistent with long-term competitiveness. These pressures are compounded by ongoing geopolitical and trade uncertainty, shifting labour market dynamics, and persistent housing affordability constraints.
Source: Bank of Montreal
Table 2: Key Provincial Economic Indicators
Pre-Pandemic Pandemic
Post-Pandemic
Risk Factors
As an economy heavily dependent on U.S. markets (accounting for over 70 per cent of Ontario’s total exports in 2024) Ontario faces difficult but critical work ahead as it navigates shifting geopolitical landscapes and trade relations. Moving beyond resilience will require deliberate action from both federal and provincial governments to diversify trade, raise productivity, and improve investment conditions.
Geopolitical and Trade Uncertainty
Trade uncertainty remains a central risk to all of Ontario's economic regions. The pandemic exposed several long-standing issues, including muted GDP growth, subdued productivity, rigid supply chains, housing supply gaps, and uneven regional performance. Now, a new wave of economic uncertainty driven by evolving geopolitical dynamics underscores the critical need to address structural barriers that have long hindered Ontario’s economic potential.
The introduction of U.S. tariffs raised concerns over export disruptions, supply chain fragmentation, and procurement strategies. Ontario exports to the U.S. have traditionally accounted for a substantial share of employment and over half of the province’s total GDP. As such, early forecasts following tariff announcements on Canadian imports to the U.S. anticipated a sharp increase in unemployment (8.6 per cent) and a contraction in real GDP growth (-0.2 per cent).i
However, these anticipated outcomes did not fully materialize due to two factors: Canada’s decision not to impose retaliatory tariffs on U.S. imports and the exemption framework under the Canada-United States-Mexico Agreement (CUSMA).
While performance varies across sectors and regions, CUSMA has played an important role in mitigating economic impacts in the short term. In 2024, only around 38 per cent of Canadian exports to the U.S. were conducted under CUSMA provisions, reflecting administrative and compliance barriers.ii Tariff pressures have since increased uptake, with utilization reaching a 20-year high of approximately 90 per cent by August 2025.iii Despite this adjustment, export growth is expected to remain modest, particularly for manufacturing and trade-exposed sectors.iv
Top contributors to Ontario’s GDP growth in 2024 were predominantly service-based sectors (e.g., finance and insurance, educational services, health care, transportation and warehousing). In trade-exposed sectors, while the mining, quarrying, and oil and gas extraction industry posted the third-largest contribution to GDP growth, other trade-exposed sectors, such as agriculture, forestry, fishing and hunting, and manufacturing, were among the weakest performers. Their slower growth signals an opportunity to further boost output, especially following major federal and provincial project development and infrastructure investment announcements in critical minerals, energy and nuclear power, manufacturing, and life sciences.v,vi,vii
Despite CUSMA’s provisions allowing most Canadian goods into the U.S. duty-free, targeted tariffs on steel, aluminum, and certain auto products have already materially weakened Ontario’s manufacturing sector. These tariffs, along with the uncertainty surrounding their implementation, have outweighed the benefits of tariff exemptions.
Between January to June 2025, Canada’s manufacturing GDP fell by roughly 2.2 per cent, and about 58,000 manufacturing jobs were lost – nearly 59 per cent of them in Ontario, reflecting the province’s central role in auto supply chains and metal‑intensive industries.
Ontario’s major tariff exposed exports, particularly steel and vehicle and parts, were among the hardest hit. In 2025, weaker U.S. demand drove Ontario steel exports down 24 per cent and vehicle and parts exports down 5 per cent from January to July, compared with the same period in 2024.viii
Ultimately, protections under CUSMA have acted as a shield against more pronounced economic harm. However, over-reliance on these mechanisms presents risks as CUSMA enters renegotiation.
Ontario’s trade strategy should leverage its comparative advantages, diversifying and expanding trade to markets that could benefit from its key sectors, including steel, aluminum, critical minerals, advanced manufacturing, food production, energy, forest products, and other natural resources.
Productivity and Investment Challenges
Beyond trade diversification, Ontario’s productivity level remains a key opportunity to drive long-term competitiveness and improve overall living standards; yet, persistent weaknesses in business investment and output per worker continue to weigh on Ontario’s economic potential.
Following two consecutive years of declining real GDP per capita, Ontario saw modest per capita growth in 2025, largely the result of slower population growth from immigration policy changes, rather than a meaningful improvement in underlying productivity. This improvement remains fragile (Figures 23a and 23b).
Prior to last year, Canada lagged in productivity growth relative to peer economies, and Ontario has trailed the national average for over the past two decades.ix,x,xi At the same time, labour productivity in Ontario performed comparatively better before the pandemic but has effectively stagnated since 2018 (Figure 24).xii
Note: The inverted “V” seen in Figure 24 in 2020 illustrates the temporary impacts of COVID-19 on workplace closures. In the early months of the pandemic, the number of hours worked declined faster than output, leading to a sharp increase in labour productivity per hour. When the economy reopened in the later months of the pandemic, hours worked rose faster than output, resulting in a sharp decline in labour productivity per hour.
Sources: Statistics Canada, Bank of Montreal, author's calculations
Figure 24: Labour Productivity, Ontario (all industries, chained 2017 dollars per hour)
Source: Ontario Data Catalogue
By sector, manufacturing, wholesale trade, utilities, and construction saw the largest declines by mid-2025 and contributed significantly to the overall decrease in business sector productivity. Unsurprisingly, these sectors experienced heightened effects from Canadian trade uncertainty with the U.S., given their dependence on merchandise trade.xiii
Business investment as a core driver of productivity through capital expenditure and technological adoption also shows signs of strain and further compounds poor performance in per capita real GDP and labour productivity.
After periods of contraction, non-residential investment growth has been uneven. Investment in machinery and equipment and intellectual property products posted declines in parts of 2025, even as total investment edged higher. Business investment, a component of real GDP, also stagnated in the first three quarters of 2025.xiv
Encouragingly, our 2025 Business Confidence Survey indicates that businesses throughout Ontario are increasingly adopting emerging technologies, such as AI, data analytics, cloud computing, and automation, which can help spur productivity growth. That said, 44 per cent of those surveyed still reported little to no use of newer technologies, indicating untapped potential.
Labour Market Trends
Following several years of historical population gains, Ontario is entering a period of sharp demographic adjustment. Growth among those aged 15 and over is projected to slow to 0.6 per cent in 2026, down from 3.8 per cent in 2024 (Table 2).
Despite weaker population growth, Ontario continues to record one of the highest provincial unemployment rates in Canada (7.6 per cent), exceeding even the national average (6.6 per cent) in 2025. This reflects a lag between labour supply adjustments and weaker job creation rather than a sudden improvement in labour market balance. At the same time, provincial employment growth has slowed to 1.1 per cent and is expected to continue following a downward path in the year ahead (Table 2). Both higher unemployment and weaker employment levels contribute to a suboptimal labour market, potentially increasing Ontario’s economic risk.
While easing population growth may reduce pressures on housing and infrastructure, it also heightens the risk of renewed labour shortages, especially in regions and sectors with long-standing labour gaps. Findings from the Business Confidence Survey reinforce this concern with businesses in northern Ontario and labour- and resource-intensive sectors continuing to report the highest incidence of labour shortages, demonstrating the need for a more targeted workforce and immigration strategy.
Looking ahead, slower population growth may further exacerbate declines in spending activity without the influx of new residents contributing to local spending activity and tourism. CUSMA renegotiations this year may also add to labour market challenges, with disputes over certain aspects of the agreement potentially impacting employment in natural resource and manufacturing sectors, including automotive, steel, aluminum, forest products, energy, and life sciences.xv
Ontario’s economic production capacity and ability to adapt to changing market needs necessitate a labour market with a sustainable supply of talent, supported by targeted immigration policies that can fill regional and sectoral labour shortages.
Housing Market Conditions
Ontario’s housing market is entering a pronounced slowdown following an extended period of booming activity. The latest forecasts and industry data indicate a decline in housing starts and completions well below recent ten-year averages, driven by softer demand from reduced immigration, weaker macroeconomic conditions, persistent affordability constraints, a declining rental market, and elevated construction costs.xvi
Despite ongoing housing supply gaps and affordability challenges, housing starts have repeatedly declined from a high of over 100,000 in 2021 to 67,000 in 2025, with forecasts suggesting even fewer this year at 62,000 (Table 2).
Rising homelessness and labour attrition in residential construction further compound these risks, with implications for workforce mobility, municipal finances, and long-term economic capacity. New data reveals an alarming increase in homelessness of 8 per cent from just one year ago and nearly 50 per cent compared to 2021. Last year, approximately 85,000 Ontarians were known to be experiencing homelessness, with more than half indicating chronic or repeated homelessness for at least six months.xvii
Altogether, current housing market trends underscore persistent structural mismatches between housing supply, affordability, and demand. These risk factors will continue to weigh heavily on balance sheets for households and governments alike as they work to simultaneously navigate labour market strains impacting employment prospects and income levels along with rigid gaps in housing affordability and supply along the continuum.
Households
Affordability and cost-of-living pressures continue to weigh heavily on Ontario households, influencing consumption patterns and overall economic momentum. Elevated shelter and food costs, combined with higher debt levels and slower income growth, have constrained discretionary spending and household confidence.
While steady employment and wage growth have provided some support to household income in recent years, labour market conditions are weakening, with Ontario reporting the highest provincial unemployment rate in Canada. Wage growth and labour income are likely to continue softening amid feeble employment and labour demand growth, with employment reporting a 5.7 per cent year-over-year increase in 2024, down to 3.7 per cent in 2025, and projected at 3.2 per cent in 2026.xviii
Affordability challenges and reduced immigration-led demand have culminated in weaker housing and rental market activity. Rather than easing price pressures, this slowdown has further disincentivized new construction amid elevated financing, labour, and material costs, constraining progress on supply-driven affordability and keeping housing prices persistently high.
At the same time, higher household debt service ratios, particularly among those needing to renew mortgages at higher rates, pose additional risks to households' financial resilience. In 2024, Ontario households had the highest debt service ratio in the country at 10.9 per cent as average household debt continued to progressively increase.xix,xx This trend is expected to persist, given the outsized role of housing in overall household debt. While some reprieve may yet come from additional declines in interest rates, addressing affordability and cost-of-living concerns remain paramount to the economic well-being of all Ontarians and are a prerequisite for the viability of buy-and-travel-local campaigns designed to stimulate the domestic economy.
Ongoing economic uncertainty from trade relations, job security, inflation concerns, and higher debt loads – coupled with slower population growth –are dampening consumer confidence and expected to limit household spending growth into the year ahead.xxi Financial pressures also limit discretionary spending, which can have additional implications for local businesses, communities, and economies that rely on local spending activity.
Commercial
Ontario’s commercial sector continues to face a challenging operating environment shaped by elevated borrowing costs, trade uncertainty, and weaker demand. While major investments in advanced manufacturing for electric vehicles and battery supply chains have supported specific regions, broader business investment remains weak and reflects amplified caution among firms.
One year into the introduction of U.S. tariffs, export activity has proven more resilient than initially anticipated, supported in part by increased domestic uptake of existing CUSMA provisions. That said, overall export growth remains modest. In particular, Canada’s share of exports to the U.S. dropped to 67 per cent as of October 2025, the lowest outside the pandemic.xxii While a small but growing share of firms report efforts to diversify sales away from the U.S. market, as found in our Business Confidence Survey, progress remains uneven and sector-specific, with many firms reporting weaker sales expectations.xxiii
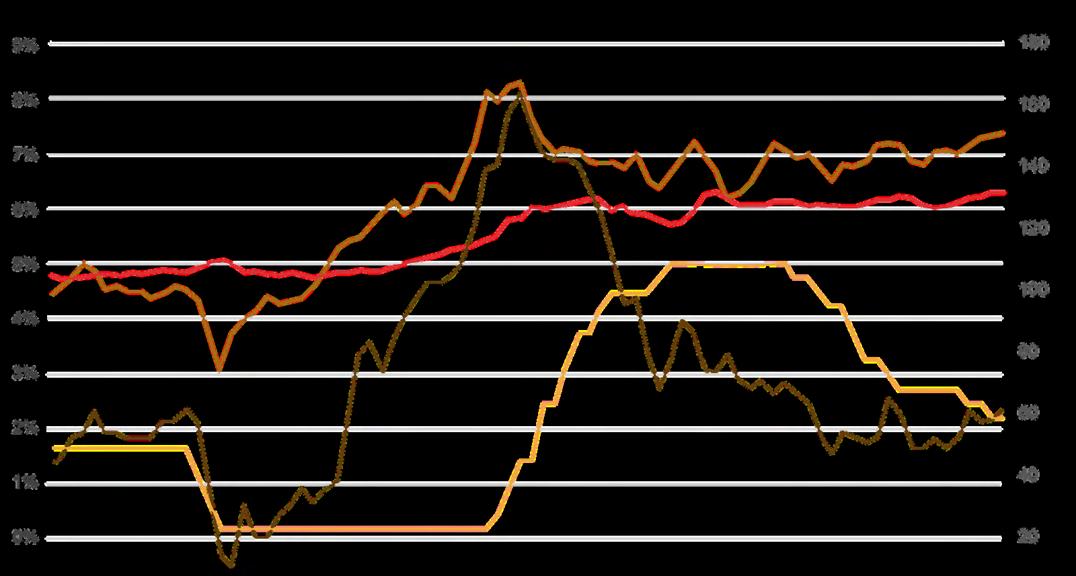
Although headline CPI inflation has eased following a period of monetary tightening, underlying cost pressures remain elevated for businesses and are an important consideration when assessing global trade options. For instance, the Raw Materials Price Index (RMPI) and Freight Rail Services Price Index (FRSPI) both remain above pre-pandemic levels, reflecting persistent global supply-side constraints that could impact the costs of expanding production and doing business with the rest of Canada and other nations (Figure 25).
Figure 25: Interest and Inflation from January 2019 to December 2025 (Canada)
March2020: OnsetofCOVID-19
Total CPI: measures changes in prices experienced by Canadian consumers by comparing the costs of a representative basket of goods and services. RMPI: measures prices for raw materials purchased by Canadian manufacturers for further processing.
FRSPI: measures price changes of commodity shipments by the freight rail industry.
Although investment intentions improved slightly in the most recent quarter, firms remain cautious. In the face of trade-related uncertainty, elevated financing costs, and softer demand, most businesses are prioritizing routine maintenance over expansion. xxiv
Financial stress remains elevated. Although the province saw the number of insolvency filings decline 12 per cent year-over-year in 2025, Ontario continues to record the highest number of companies filing for proceedings under the Companies’ Creditors Arrangement Act, alongside the highest for bankruptcies and insolvency proposals. Insolvencies are most concentrated in construction, manufacturing, transportation and warehousing, retail, utilities, and agriculture and forest products sectors.xxv,xxvi
The business community and provincial economy are proving resilient amid significant headwinds, but progress is uneven and particularly challenging for many communities, firms, and sectors. While recent government measures on manufacturing investment tax credits and productivityfocused incentives are expected to provide support over the medium term, long-term, sustainable, comprehensive, and inclusive economic success will require sustained improvements in investment and competitiveness.
Government
Ontario’s fiscal outlook has weakened relative to earlier post-pandemic expectations, reflecting slower economic growth, trade-related disruptions, and the need for targeted support measures for businesses and households.
Both the provincial and federal governments are now projected to record much larger deficits in fiscal year 2025-26, with a return to surplus pushed farther into the medium-term. Cooler inflation will also mean lower government revenue in the near term (Table 3).
Table 3: Government Budget Balance
Source: Bank of Montreal
Revenue growth is expected to be constrained by weaker nominal GDP growth and corporate profits, while expenditure growth will likely remain driven by healthcare, education, and infrastructure commitments. Persistent unemployment and the lack of affordable housing pose additional risks to government balance sheets by reducing tax revenue and increasing spending on social programs.
While Ontario’s net-debt-to-GDP ratio remains relatively stable and below pre-pandemic levels at 37.7 per cent, rising deficits and reduced fiscal flexibility constrain the province’s ability to respond to future economic shocks.xxvii
Regional Economic Outlook
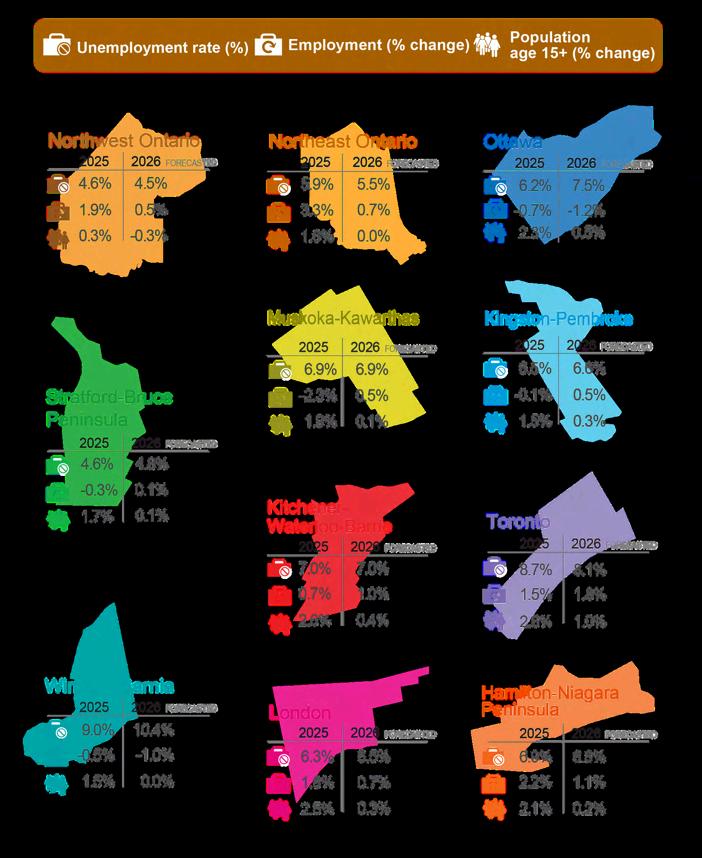
Figure 26 illustrates the 2025 and 2026 forecasted values of three key economic indicators for Ontario’s 11 economic regions as defined by Statistics Canada: the jobless rate, change in employment, and change in population (ages 15 and older).
26: Regional Key Economic Indicators
Population,Age 15+ (% Change)
Source: Bank of Montreal
Figure
While 2024 was largely defined by weaker employment gains, elevated unemployment levels, and stronger population growth throughout the province, 2025 saw significantly weaker population growth, persistently elevated unemployment, and further softening in employment growth.
Population growth slowed sharply across all regions in 2025 and is projected to remain minimal in 2026, reflecting sizeable cutbacks to federal immigration targets. Comparatively, the Toronto (2.6 per cent), Kitchener-Waterloo-Barrie (2.6), London (2.5), Ottawa (2.3), and Hamilton-Niagara Peninsula (2.1) regions saw the highest population growth in 2025 and are expected to continue leading the charge in 2026 as popular large urban destinations for newcomers.
With no anticipated near-term increases in immigration targets, population growth across Ontario is expected to remain subdued at rates not seen in nearly a decade. In the meantime, local economic growth, job opportunities, and lower housing prices will be important drivers of any inflows or outflows of residents between provinces or among Ontario’s economic regions.
Since 2023, both the Northeast and Northwest regions have experienced stronger, positive population growth, reaching highs of 2.6 and 1.2 per cent in 2024, respectively. The introduction of various immigration pilot programs, including the Rural and Northern Immigration Pilot and Regional Economic Development through Immigration programs, have helped drive some of this growth. Regional officials also attribute part of the growth to mining developments, especially in the northeast, and increases in remote work opportunities, coupled with a desire for more affordable housing.
Stronger-than-anticipated population growth leading up to 2025 contributed to labour market slack in many regions, as job creation failed to keep pace with the rapid expansion of the labour force. With population growth significantly outpacing job creation, unemployment rates accelerated toward pandemic highs in most regions, except the Northeast and Northwest.
Last year, Windsor-Sarnia (9 per cent), Toronto (8.7 per cent), Kitchener-Waterloo-Barrie (7 per cent), Hamilton-Niagara Peninsula (6.9 per cent), and Muskoka-Kawarthas (6.9 per cent) had the highest unemployment rates. These regions also coincided with those that saw some of the largest population gains, reinforcing the imbalance between labour supply growth and available job opportunities in major urban and high-growth regions.
Cooling housing and rental markets, along with a decline in housing starts, may also be contributing to higher unemployment rates with slowdowns in residential construction activity – trends that would be more apparent in larger urban areas with greater population density and housing demand.
A similar pattern is evident in Muskoka-Kawarthas, a region traditionally associated with tourism and recreational property markets. Following a pandemic boom, recent data suggests demand is cooling, with inventory levels steadily increasing.xxviii
Particularly concerning are the unemployment rates in the Windsor-Sarnia and Toronto regions, which both exceeded the provincial unemployment rate of 7.6 per cent – a rate that already exceeds all other Canadian provinces.
Most regions are expected to see worsening unemployment in 2026. The largest increase is anticipated in Windsor-Sarnia – a region identified among those with the highest U.S. trade exposure, given its concentration of manufacturing plants producing traditionally well-demanded goods and auto parts for American consumers.
That said, recent commitments have partially offset employment pressures in Windsor-Sarnia, including the addition of 1,000 new jobs by Stellantis at the Windsor Assembly Plant, and are further supported by a rebounding confidence given trade conditions under CUSMA. Positively, the region also saw job growth in construction, retail trade, healthcare, transportation, and warehousing.xxix
The Ottawa region is also projected to see a notable increase in unemployment in 2026. Along with strong population growth, a shrinking locally based public sector has contributed to higher overall unemployment levels in the region. This trend is expected to continue in response to the federal government’s initiative to find $60 billion in savings over the next five years.
Adding to unemployment pressures is weaker employment growth. Apart from the Hamilton-Niagara Peninsula (2.2 per cent), Northeast (3.3 per cent), Northwest (1.9 per cent), and Kingston-Pembroke (-0.1 per cent) regions, all regions of Ontario saw cooler year-over-year job growth in 2025 relative to 2024.
The Hamilton-Niagara Peninsula, Northeast, and Northwest regions of Ontario reported gains in 2025 and are expected to continue seeing positive year-over-year employment growth. Much of the growth in Ontario's northern regions is attributed to developments in the mining sector and critical mineral supply chains.
Employment gains in the Hamilton-Niagara area may be attributable to growing regional connectivity from expanded transit projects that help increase access to new labour pools and consumers alike. Other sources may stem from labour demand growth in the agriculture and natural resources sector and recent announcements in healthcare and manufacturing, such as investments to expand capacity at Heddle Shipyards and AtomVie Global Radiopharma.
On the other hand, Ottawa, Kingston-Pembroke, Muskoka-Kawarthas, Windsor-Sarnia, and Stratford-Bruce Peninsula all reported year-over-year declines in employment and reinforce reports of lower business confidence in these regions, according to our 2025 Business Confidence Survey. Although still negative, Kingston-Pembroke showed improvements from -1.2 per cent in 2024 to -0.1 per cent last year.
The latest data further shows that the Muskoka-Kawarthas region saw a consecutive decline from -2 per cent in 2024 to -2.3 per cent in 2025, though minor improvements are expected for 2026. Demographic shifts, a high degree of seasonal employment, and a growing retiree population continue to shape labour market outcomes in the region.xxx
While announced investments in manufacturing and production capacity have the potential to support job creation over the medium to long term, their ultimate economic impact remains uncertain amid ongoing trade tensions, shifting industrial strategies, and evolving policy conditions. Ontario’s regional outlook continues to reflect uneven adjustment to slower growth, changing population dynamics, and sector-specific exposure to trade and investment risk. Taken together, these conditions point to a period of heightened uncertainty rather than a clear recovery trajectory, underscoring the need for tailored, region-specific approaches rather than one-size-fits-all solutions to address local economic conditions.
Source: Bank of Montreal
Figure 27: Jobless Rate by Region (%)
Figure 28: Employment Growth as a Year-Over-Year Percentage Change by Region
Source: Bank of Montreal
Section III: Pillars for Prosperity
The 2026 Ontario Economic Report emerges from a business environment shaped by local and global uncertainty, rapidly shifting trade and competitive dynamics, and both internal and external constraints on business growth. For a highly trade-exposed province like Ontario, this uncertainty is a daily operational reality for businesses across sectors and regions.
The Ontario Chamber’s Business Confidence Survey reflects these realities, and also reveals Ontario’s resilience. While business confidence in Ontario’s economic outlook remains low, it has remained remarkably stable given the turbulence of 2025; indeed, it is higher today than levels reported during the pandemic and its inflation highs. Businesses also remain even more confident in themselves after a year of absorbing shocks, managing risk, and focusing inward to sustain their operations.
However, resilience alone is not a growth strategy. Ontario’s central challenge for the decade ahead is to convert business resilience into greater competitiveness, sustainable growth and more inclusive prosperity. This requires a sustained focus on fostering entrepreneurial growth, incentivizing investment, improving productivity, enabling diversification and managing costs –while making integrated investments in Ontario’s talent, infrastructure and communities.
These themes underpin the Ontario Chamber of Commerce’s recommendations. By fostering a competitive business and trade environment, developing a qualified and diverse workforce, supporting healthy and resilient communities, and delivering growth-enabling infrastructure, Ontario can enjoy renewed growth and reinforce its position as a stable, attractive destination for business, investment, and talent in an increasingly uncertain global economy.
1. A Competitive Business and Trade Environment
Ontario’s business climate faces mounting pressure. Global protectionism is rising, competition for investment is intensifying, and trade rules are being rewritten or ignored. Domestically, complex tax structures, uneven procurement practices, and limited access to capital, markets, and talent constrain businesses' ability to invest, hire, export, and scale. Addressing these challenges – focusing not just on lowering business costs but also incentivizing business investment – will boost productivity, opportunity and growth.
Key Recommendations:
Lower the cost of doing business while incentivizing investment by simplifying Ontario’s tax and regulatory framework, restoring fairness in commercial and industrial property taxation, advancing mutual recognition across provinces to enable one Canadian market, and removing outdated taxes that impede interprovincial trade
Strengthen Ontario’s investment and trade competitiveness by using targeted tax policy – such as a provincial Patent Box – to anchor IP and highvalue investment in Ontario, support export diversification in priority sectors, and deepen Indigenous economic partnerships across trade and supply chains.
Support business growth, scale-up, and transition by expanding access to capital and digitization supports for SMEs, modernizing succession planning through employee ownership and co-operative models, and improving SME participation in public procurement through streamlined, digitized, and centralized bidding processes.
Build and secure Ontario’s strategic industries by scaling applied AI adoption and shared digital infrastructure, accelerating critical minerals development through faster and more predictable permitting and infrastructure investment, and strengthening Ontario-based defence and dual-use manufacturing supply chains to retain IP and capture national security-related investment.
2. Qualified People and Diverse Talent
Despite broader softening of the labour market, employers in high-demand sectors continue to face labour shortages due to slow credential recognition, constrained post-secondary capacity, misalignment between education and labour-market needs, and persistent barriers to workforce participation for women, Indigenous people, visible minorities, and people with disabilities. With focused action to attract, retain and develop talent, align education with labour market needs, and remove structural obstacles to work, we can ensure Ontario has the talent of the future to lead and grow the businesses of the future.
Key Recommendations:
Expand labour supply in high-demand industries by aligning immigration, credential recognition, and participation supports with employer and regional needs – scaling OINP nominations in priority sectors, accelerating foreign credential recognition, and removing childcare-related barriers to workforce participation.
Accelerate skills diversification and workforce adaptability through stable, multi-year investments in employer-aligned reskilling and workintegrated learning, alongside expanded applied research and commercialization partnerships that help workers and SMEs adopt emerging technologies and improve productivity.
Continue to stabilize Ontario’s post-secondary education system with predictable, multi-year funding and tuition flexibility, fully funding enrolment growth in high-demand fields.
Create targeted research funding to attract top talent and commercialize Ontario-based innovation.
3. Healthy and Sustainable Communities
Ontario’s economic competitiveness depends on the health, safety, and livability of its communities. Pressures on health system capacity, growing mental health and addictions challenges, and uneven access to services affect workforce participation, productivity, and talent attraction across regions. Many communities struggle to sustain year-round economic activity. With coordinated, long-term action to strengthen health systems, improve public safety and mental health supports, and invest in connected, livable communities, Ontario can both grow its economy and ensure all communities participate in that prosperity.
Key Recommendations:
Modernize Ontario’s health system through data, innovation, and integrated care by expanding access to innovative treatments, building an interoperable provincial vaccine registry, scaling team-based and community-driven care models, and advancing a province-wide health data strategy with privacy-by-design standards.
Strengthen community safety, mental health, and workplace well-being through a coordinated, whole-of-government approach that sustainably funds community policing and transitional supports, expands community-based mental health and addictions services, and equips employers – particularly SMEs – with practical workplace mental health resources.
Leverage arts, culture, and tourism as economic infrastructure by embedding them into Ontario’s economic action plan, expanding access to grants and programs for smaller, rural, northern, and Indigenous organizations, and supporting year-round activity through targeted funding and tax tools.
4. Growth-Enabling Infrastructure
Addressing Ontario’s infrastructure gaps and delivery challenges is key to enabling business growth. Energy systems face rising demand and price volatility. Housing and employment lands are often misaligned with infrastructure capacity. Trade corridors face congestion. Digital and climate resilience investments are uneven across regions. With coordinated, long-term infrastructure planning and timely delivery that aligns energy, transportation, housing, digital connectivity, and climate resilience, Ontario businesses will be better able to seize opportunities across the province, the nation, and around the world.
Key Recommendations:
Secure reliable, affordable, and sustainable energy supply by advancing clear, multi-year generation and transmission funding under the Energy for Generations plan, streamlining approvals, improving electricity price forecasting and stabilization, and partnering with Indigenous communities to support energy-intensive and trade-exposed industries.
Strengthen Ontario’s digital foundations and infrastructure readiness by coordinating early electricity load planning for data centres and AIdriven growth, expanding broadband through integrated energy, transportation, and “dig once” infrastructure planning, and ensuring rural and northern communities are fully connected.
Integrate infrastructure, housing, trade, and growth planning through predictable, multi-year funding for housing-enabling infrastructure, strategic use of surplus public lands for mixed-income housing, coordinated land-use and capital planning using digital tools, and targeted investments in trade corridors and climate-resilient infrastructure.
The Ontario Economic Report is intended to inform evidence-based decision-making across the public, private, and not-for-profit sectors. By advancing these recommendations within a coordinated economic framework, Ontario can address immediate pressures while positioning itself for long-term opportunity. The OCC looks forward to working with its members, and with governments and other partners to advance these policy priorities and support inclusive, sustainable prosperity for Ontario’s businesses, workers, and communities.
The Ontario Chamber of Commerce (OCC) is the indispensable partner of business and Canada’s largest, most influential provincial chamber. It is an independent, non-profit advocacy and member services organization representing a diverse network of 60,000 members. The OCC convenes, mobilizes and empowers businesses and local chambers in pursuit of its purpose: to bring inclusive and sustainable prosperity to Ontario’s businesses, workers, and communities.
Thank you to our Presenting Partner
Thank you to our Research Partners
Authors:
Chloe Cayabyab, Senior Policy Analyst, Ontario Chamber of Commerce
Ester Gerassime, Senior Economic Analyst, Ontario Chamber of Commerce
Simranzeet Singh Vig, Senior Manager, Policy, Ontario Chamber of Commerce
Design:
Wan-Chiao Hsu, Graphic Designer, Ontario Chamber of Commerce
From innovative SMEs to established multi-national corporations and industry associations, the OCC is committed to working with our members to improve business competitiveness across all sectors. The OCC works hard to drive an effective advocacy agenda for business and to ensure that our members are kept up-to-date on issues that matter.
Through your engagement with the OCC, you can:
Advance your policy and advocacy priorities
Strengthen your relationship with government
Network with business leaders
Engage with over 150 communities across the province and
Contribute to the growth of Ontario’s economy.
To learn more about opportunities to engage with the Chamber, please contact Shelly Anwyll:
Shelly Anwyll Vice-President, Business Development & Member Experience