


This week the median list price for San Ramon, CA is $1,750,000 with the market action index hovering around 48. This is less than last month's market action index of 51. Inventory has increased to 64
M a r k e t A c t i o n I n d e x
This answers “How’s the Market?” by comparing rate of sales versus inventory.

Strong Seller's Market
M a r k e t N a r r a t i v e
In the last few weeks the market has achieved a relative stasis point in terms of sales to inventory However, inventory is sufficiently low to keep us in the Seller’s Market zone so watch changes in the MAI If the market heats up, prices are likely to resume an upward climb.
M
List Price
Median Price of New Listings
Per Square Foot
Average Days on
Strong Seller's Market
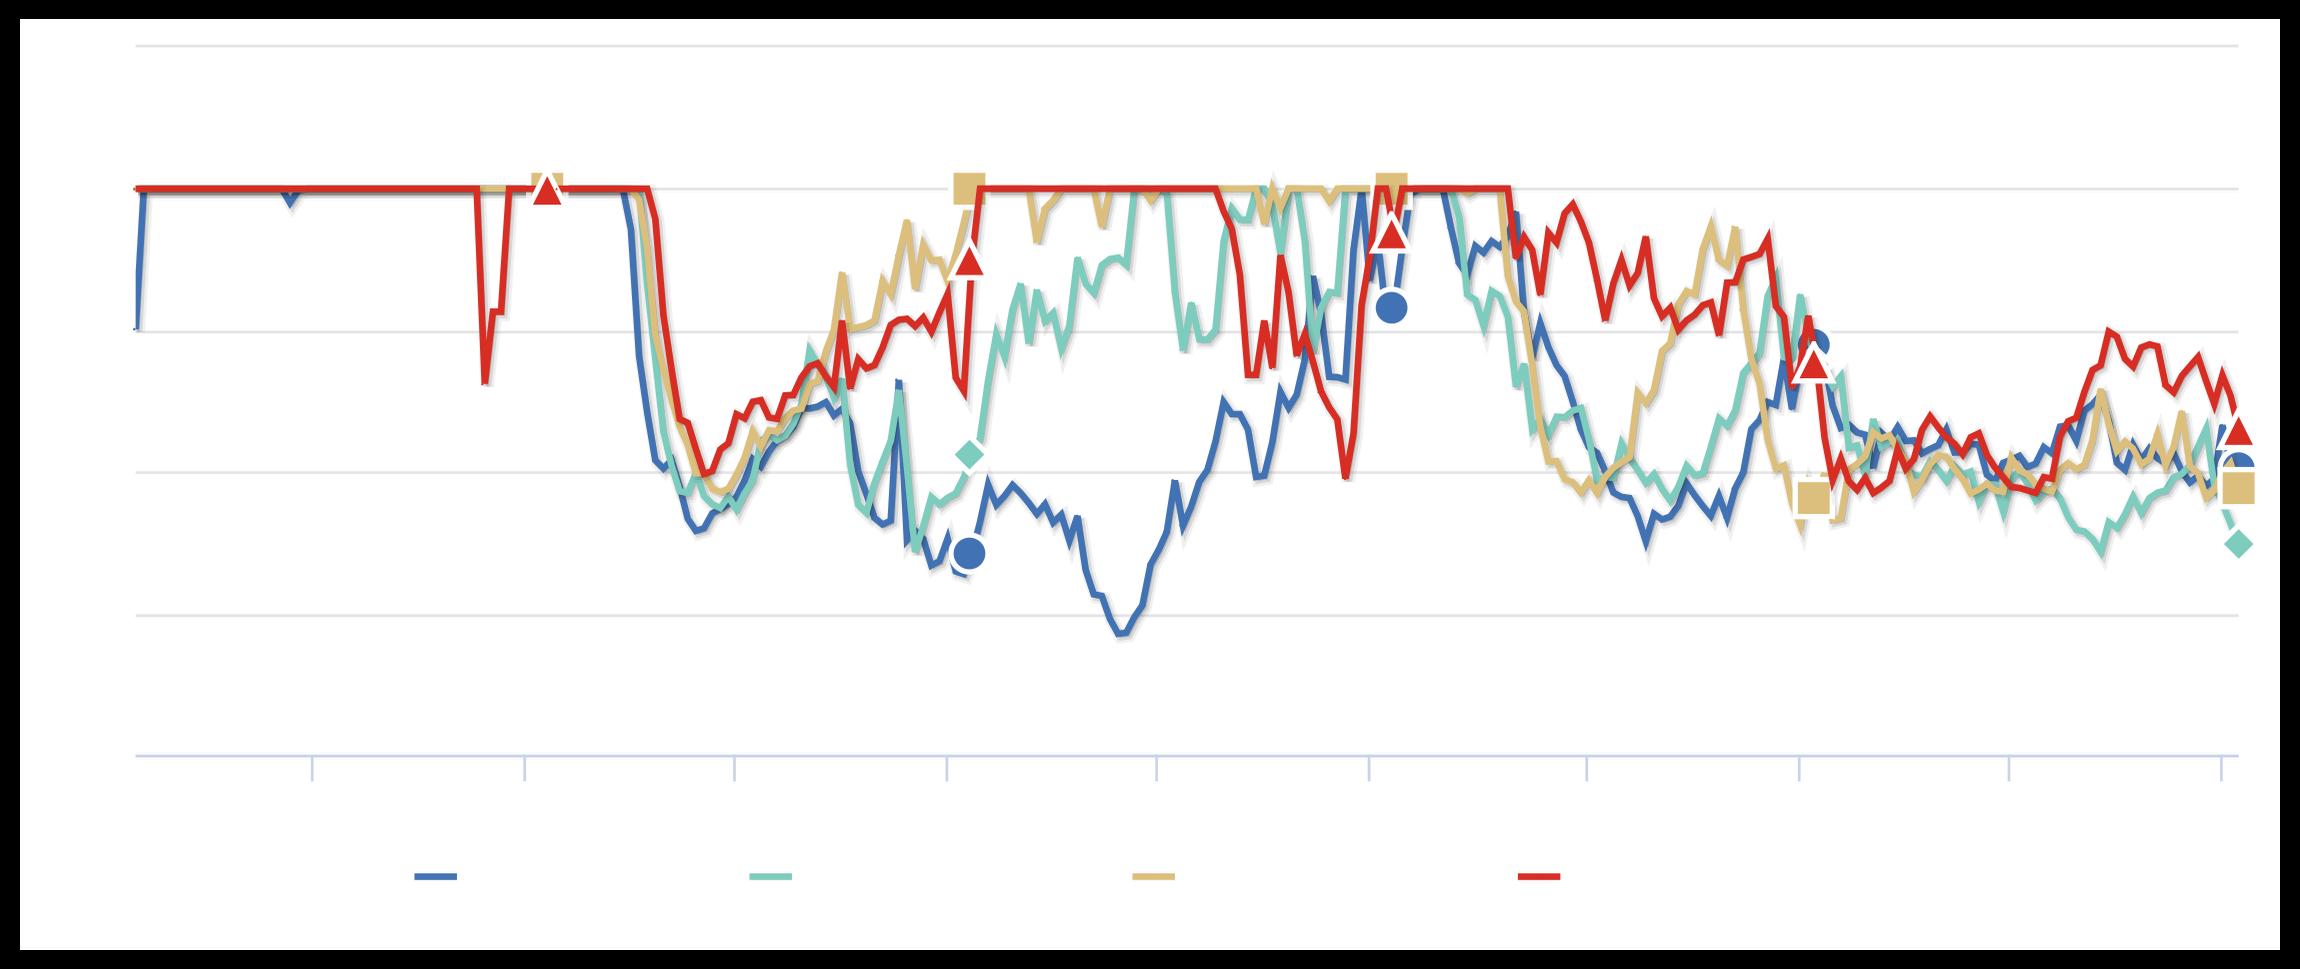
Each segment below represents approximately 25% of the market ordered by price.

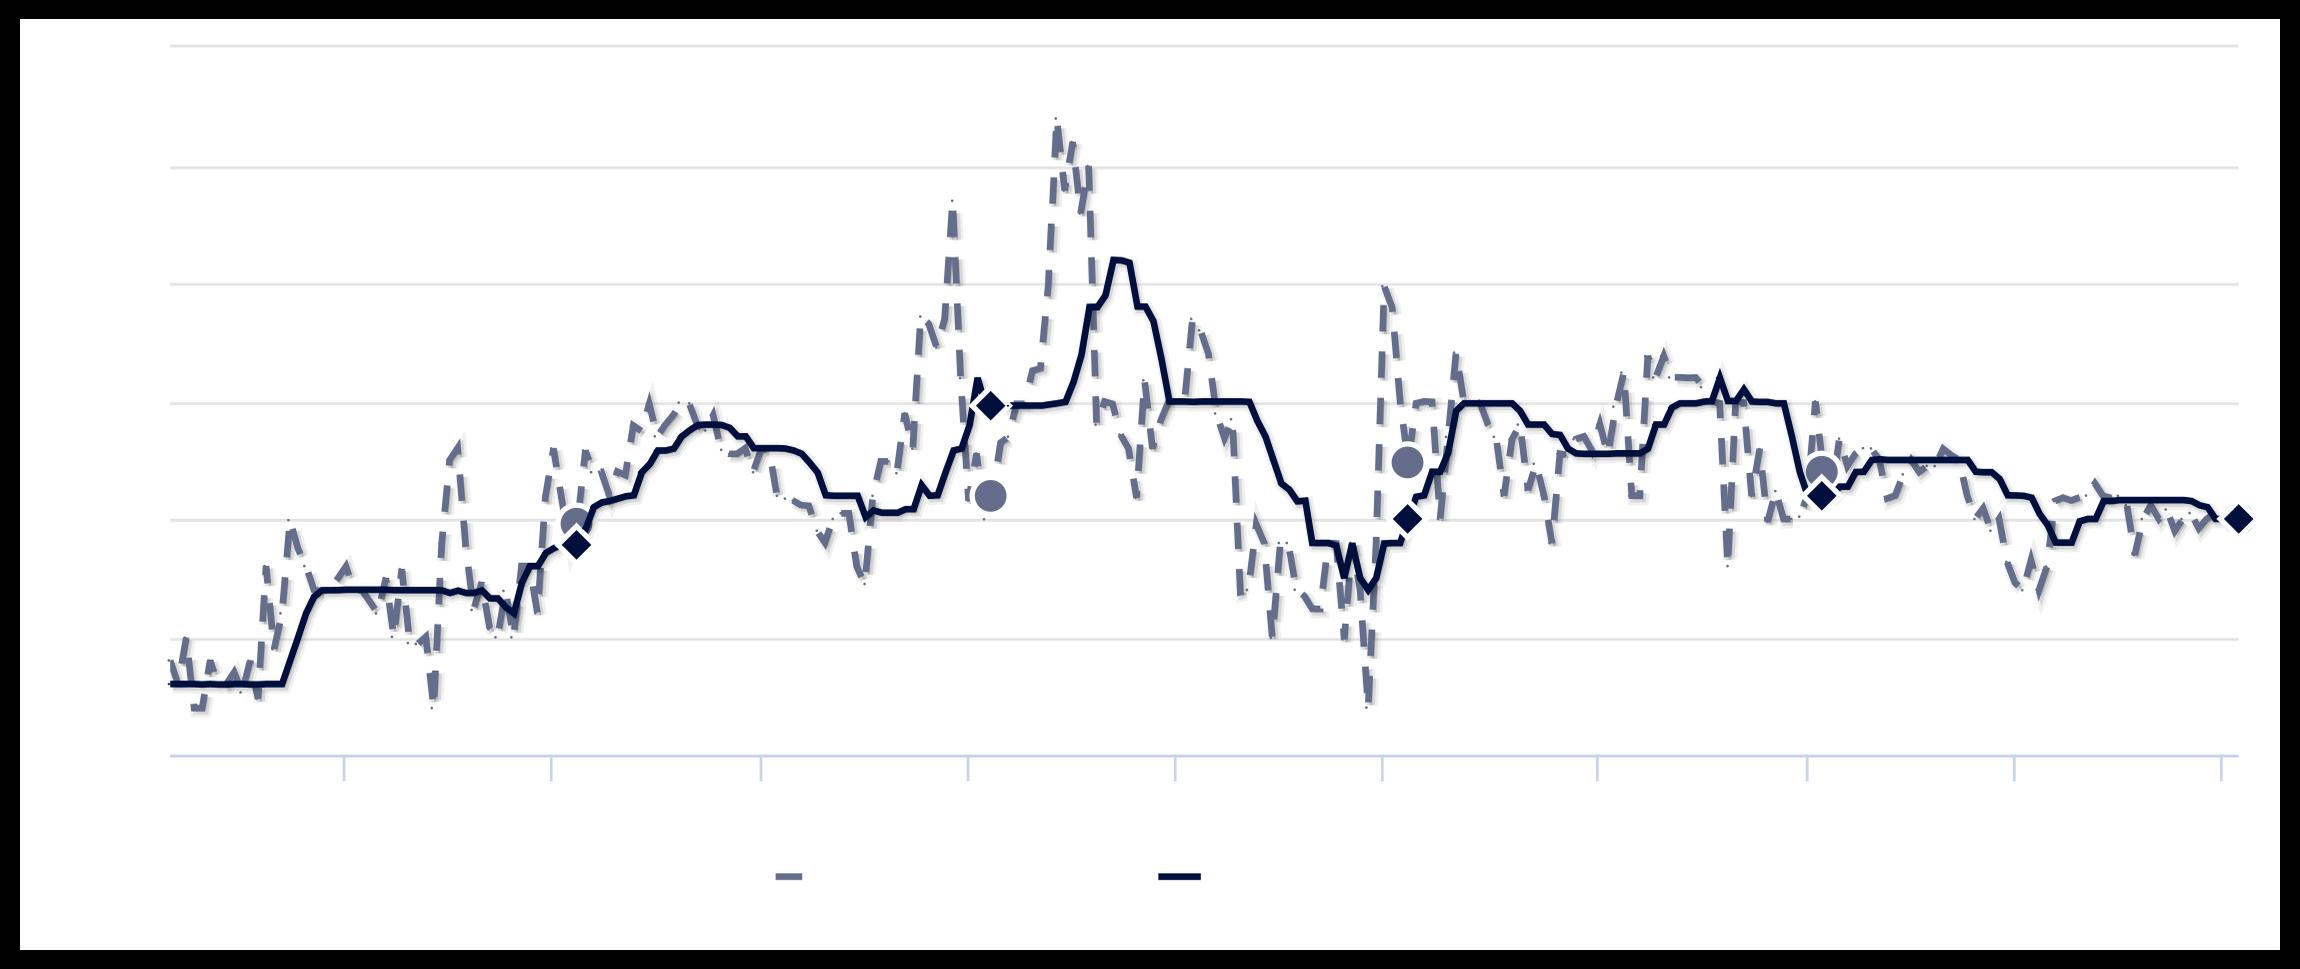
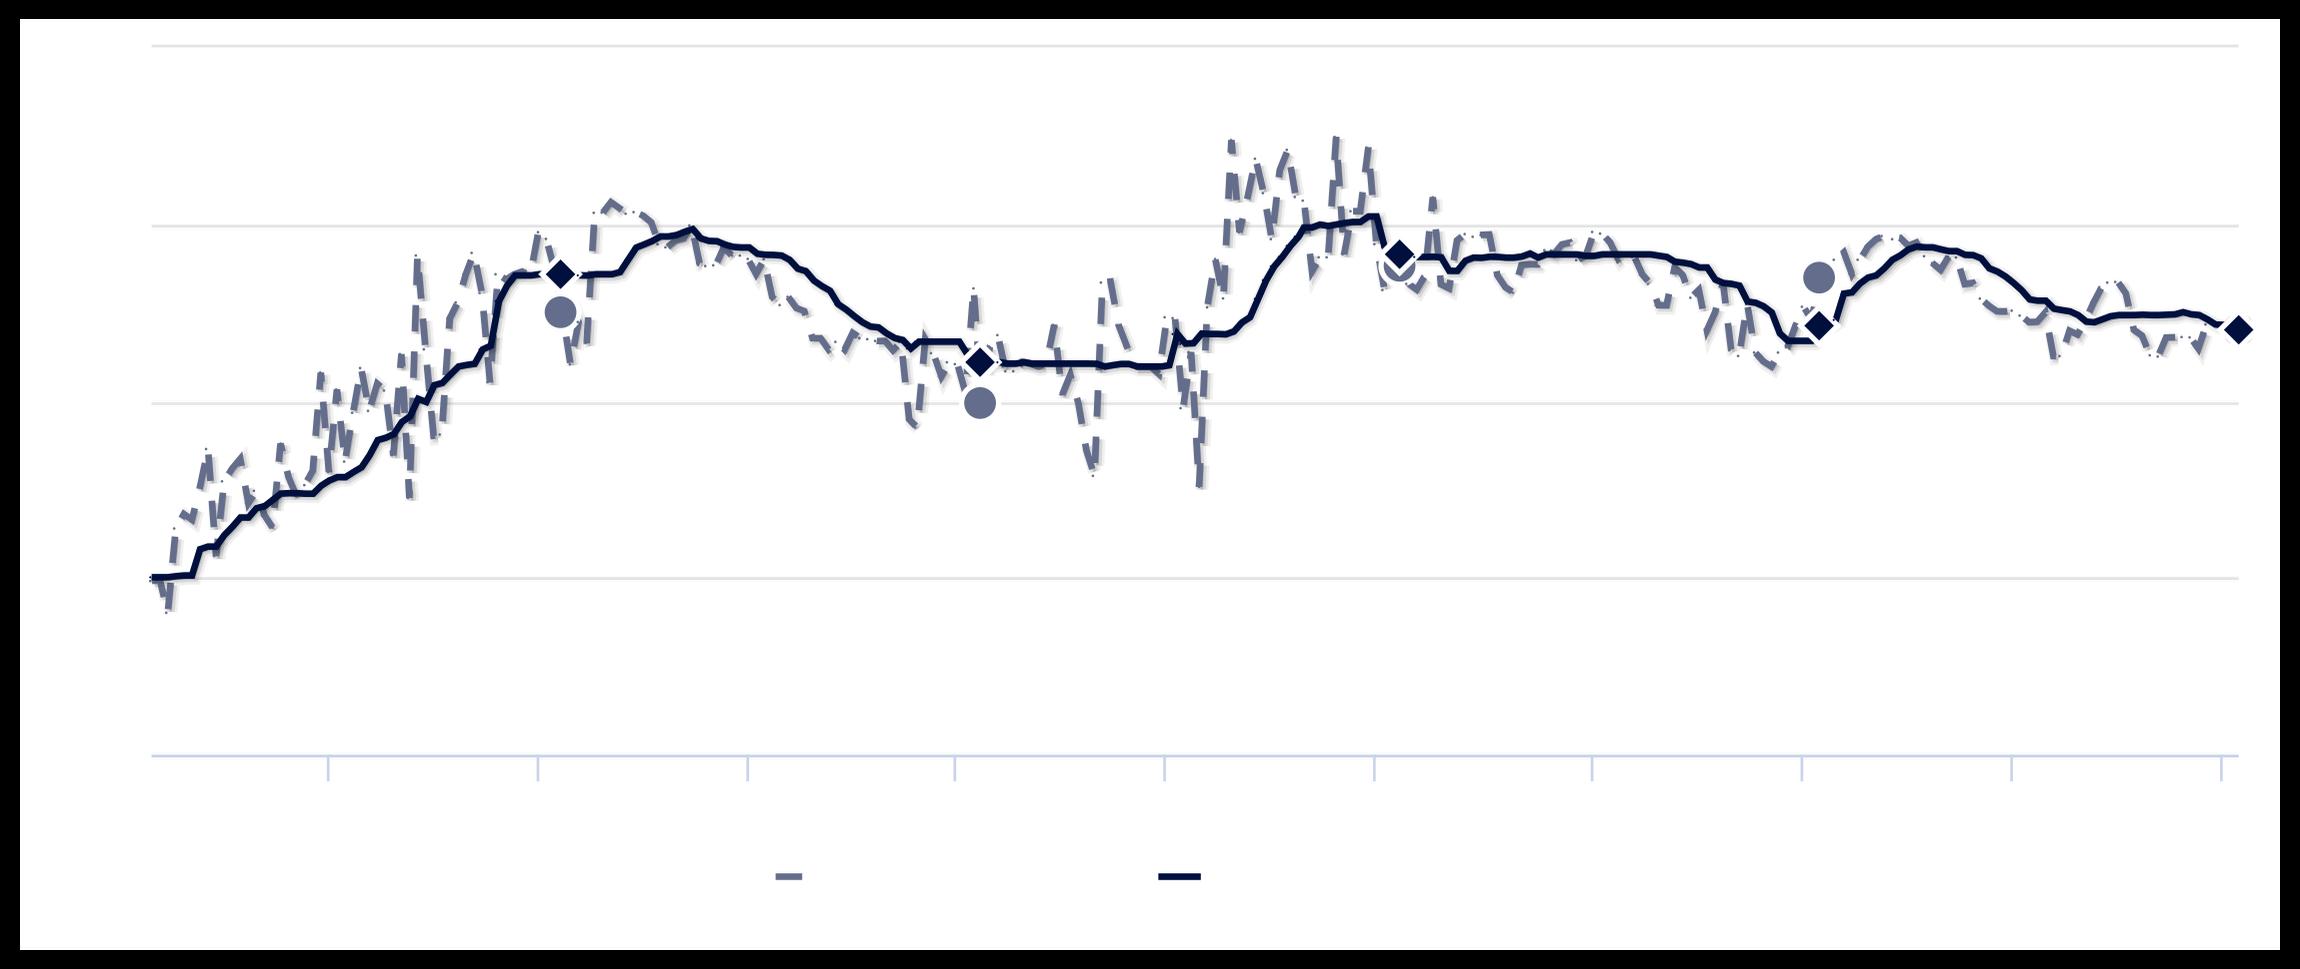
M e d i a n L i s t P r i c e
The market seems to have paused around this plateau. The Market Action Index is a good leading indicator for the durability of this trend.
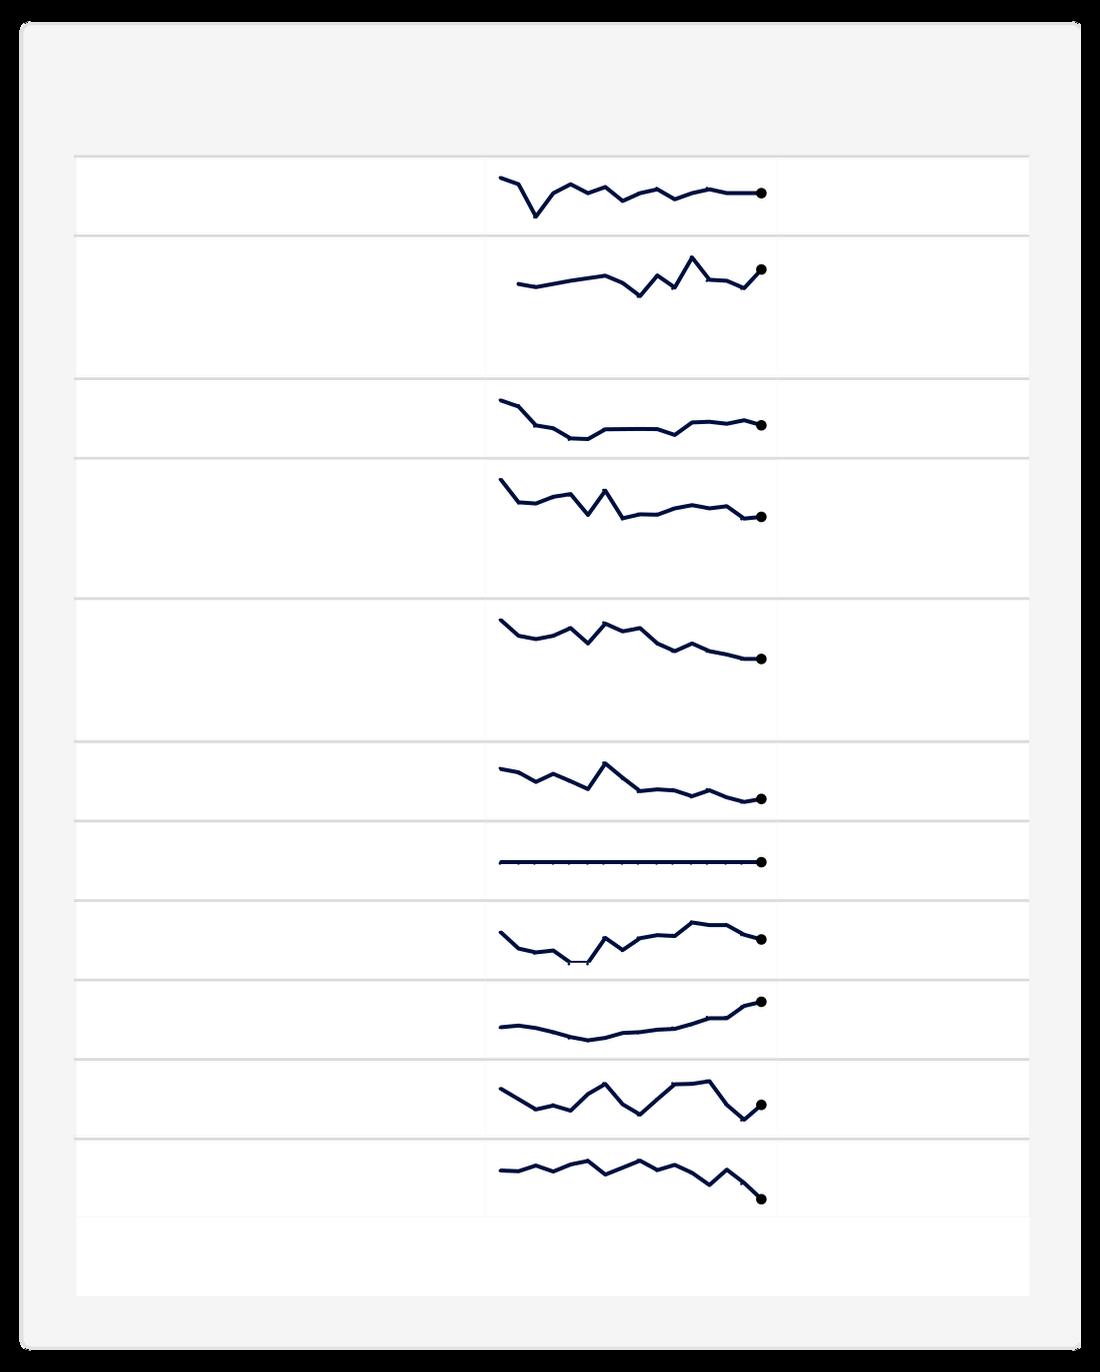
S e g m e n t s
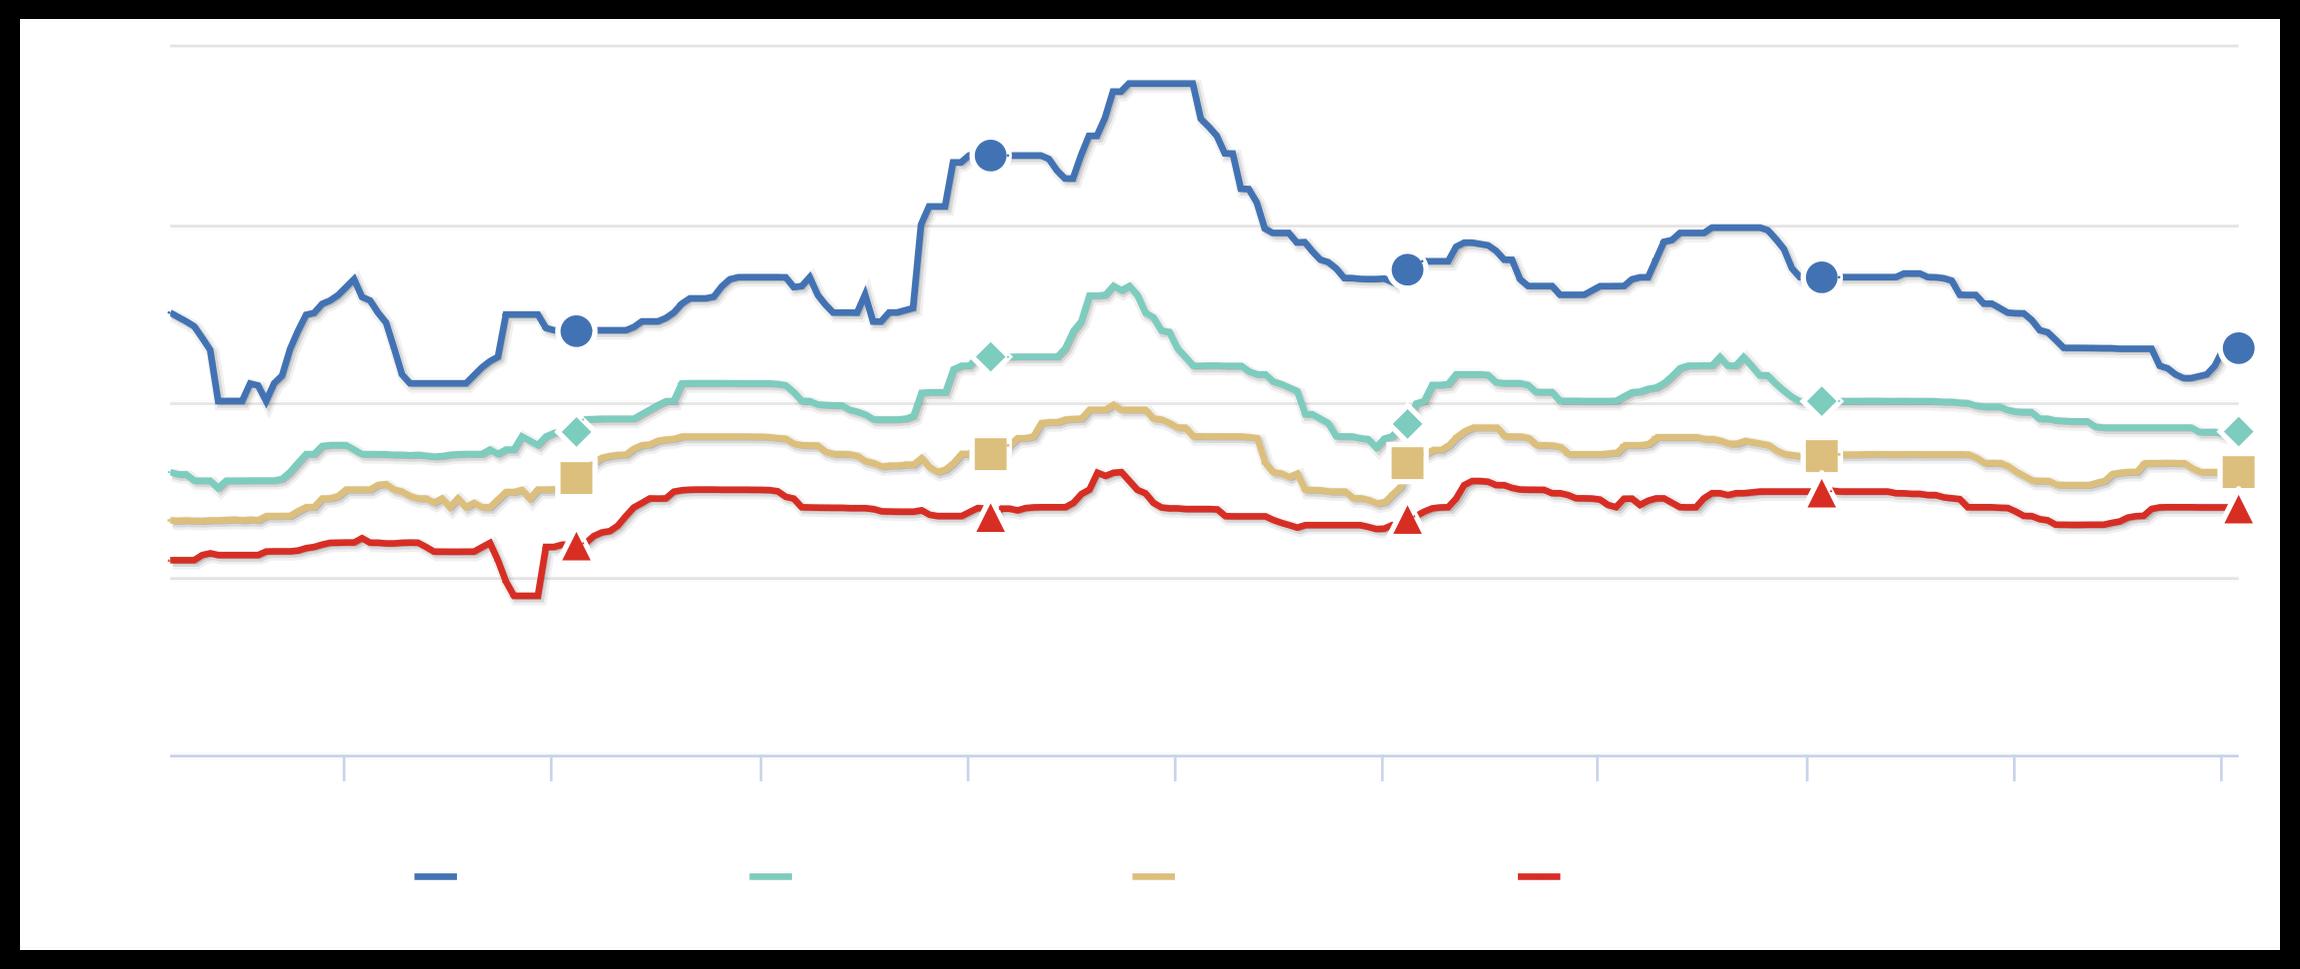
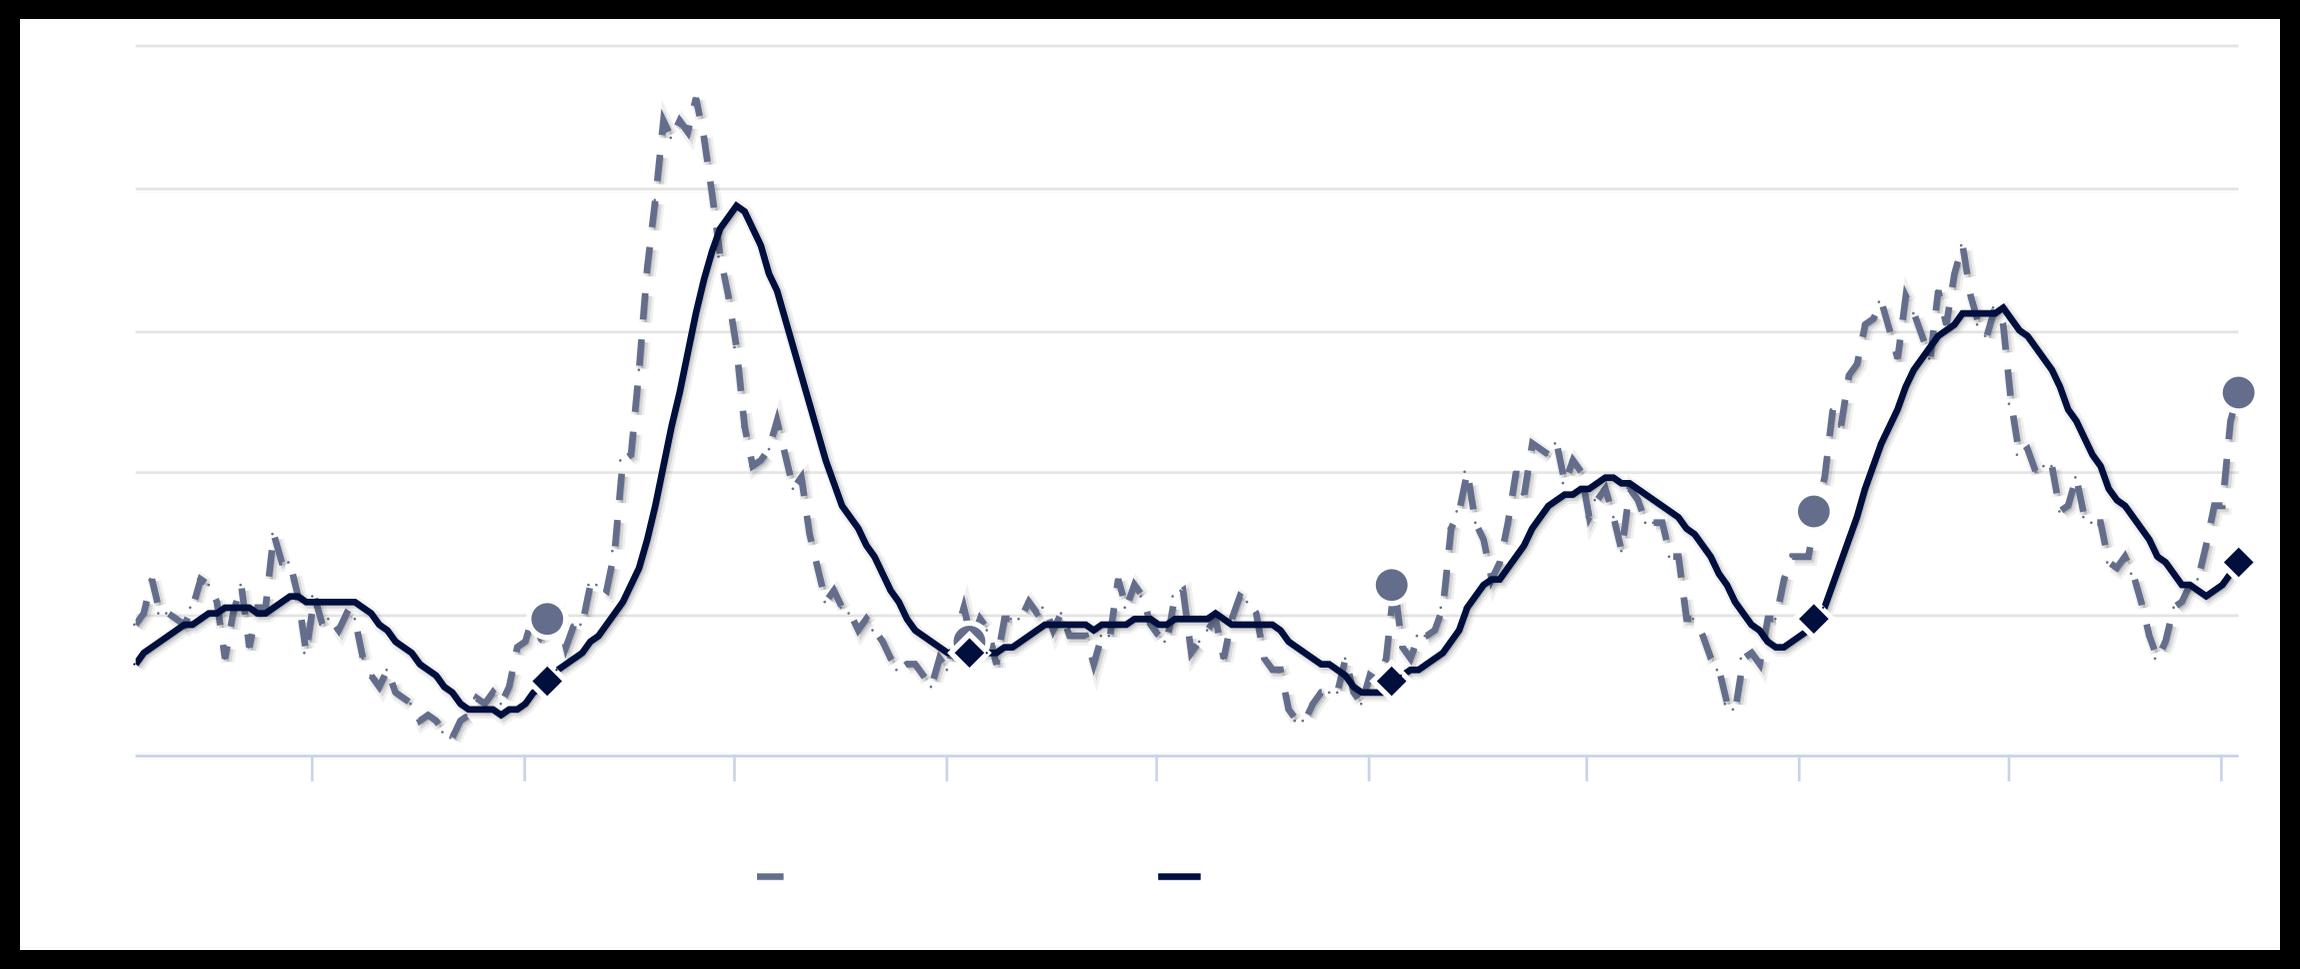
P r i c e P e r S q u a r e F o o t
The market plateau is seen across the price and value. The price per square foot and median list price have both been reasonably stagnant. Watch the Market Action Index for persistent changes as a leading indicator before the market moves from these levels.
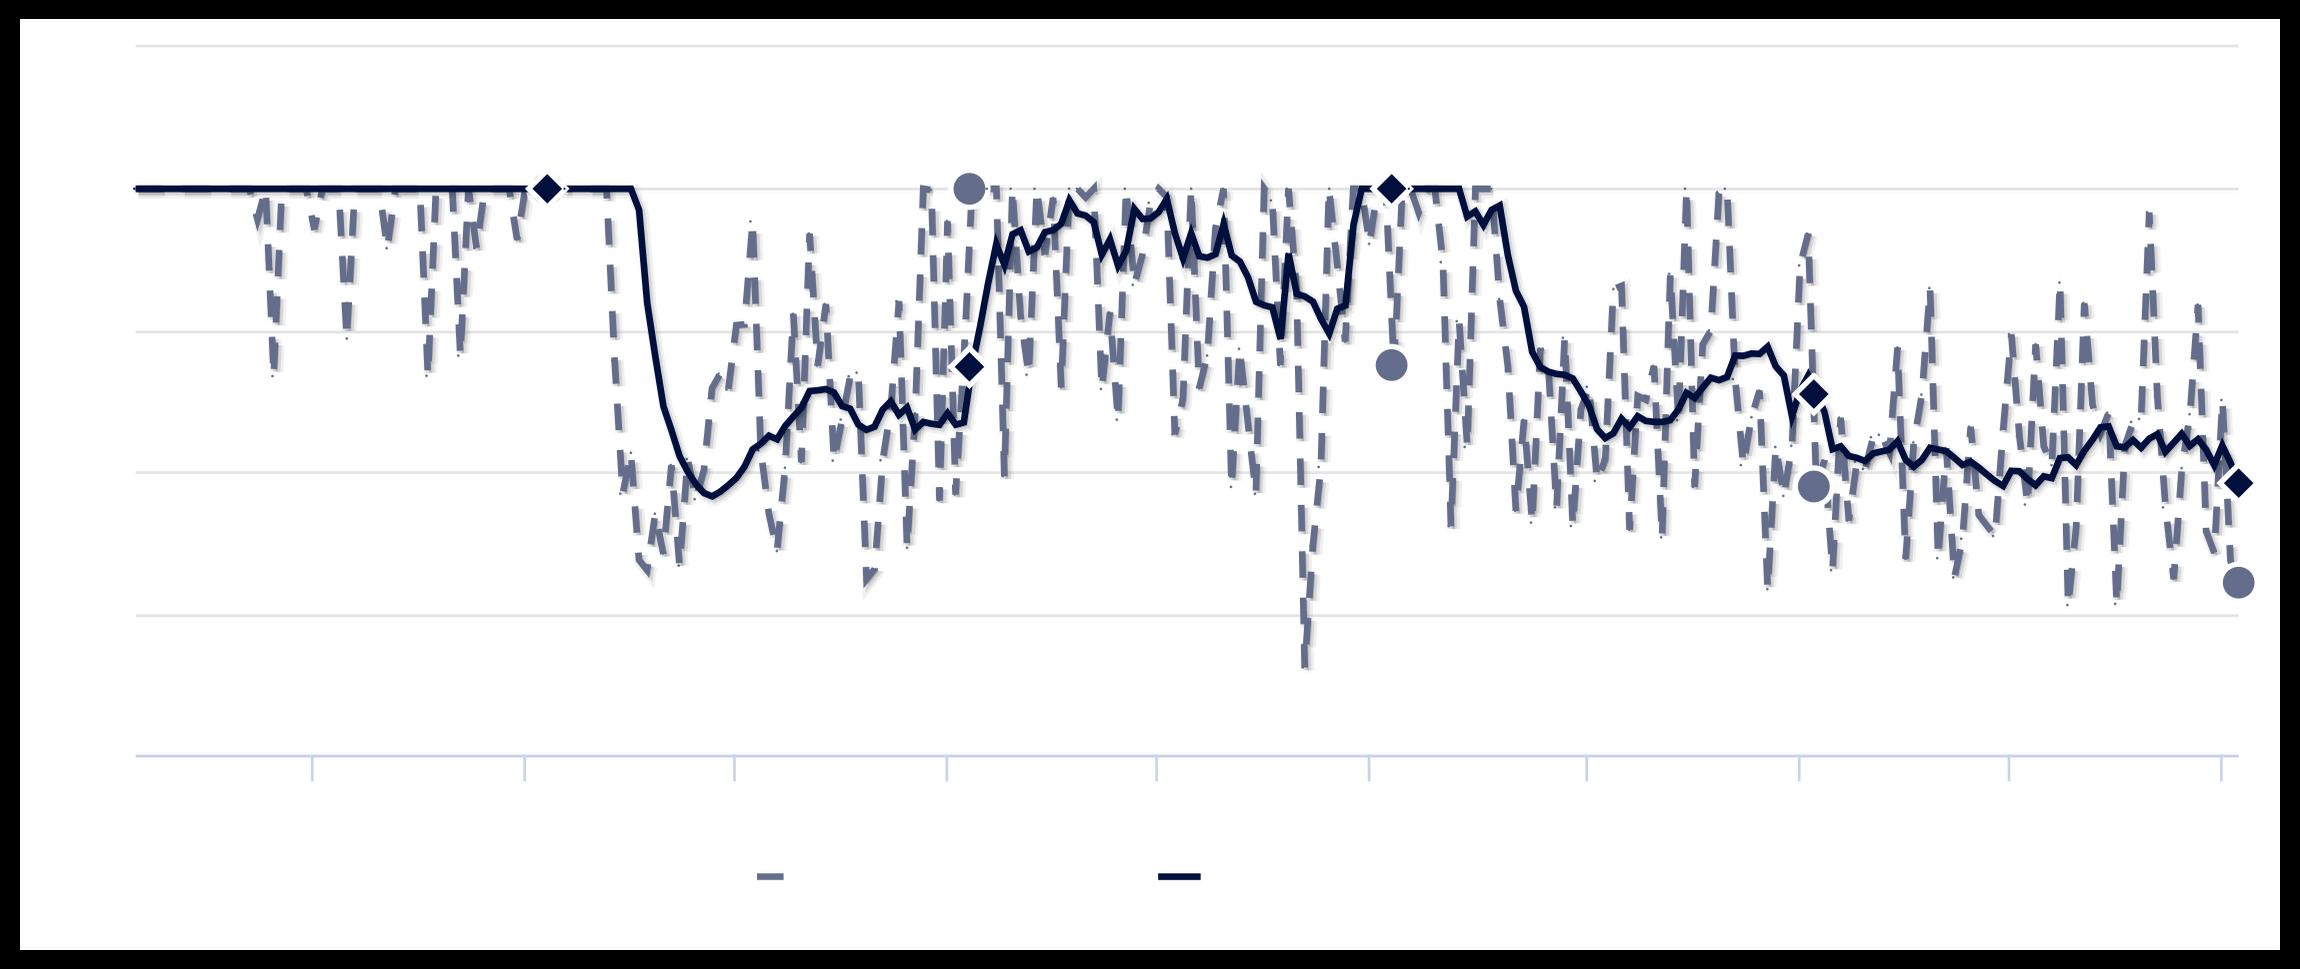
I n v e n t o r y Inventory has been falling in recent weeks. Note that declining inventory alone does not signal a strengthening market. Look to the Market Action Index and Days on Market trends to gauge whether buyer interest is changing with the available supply.
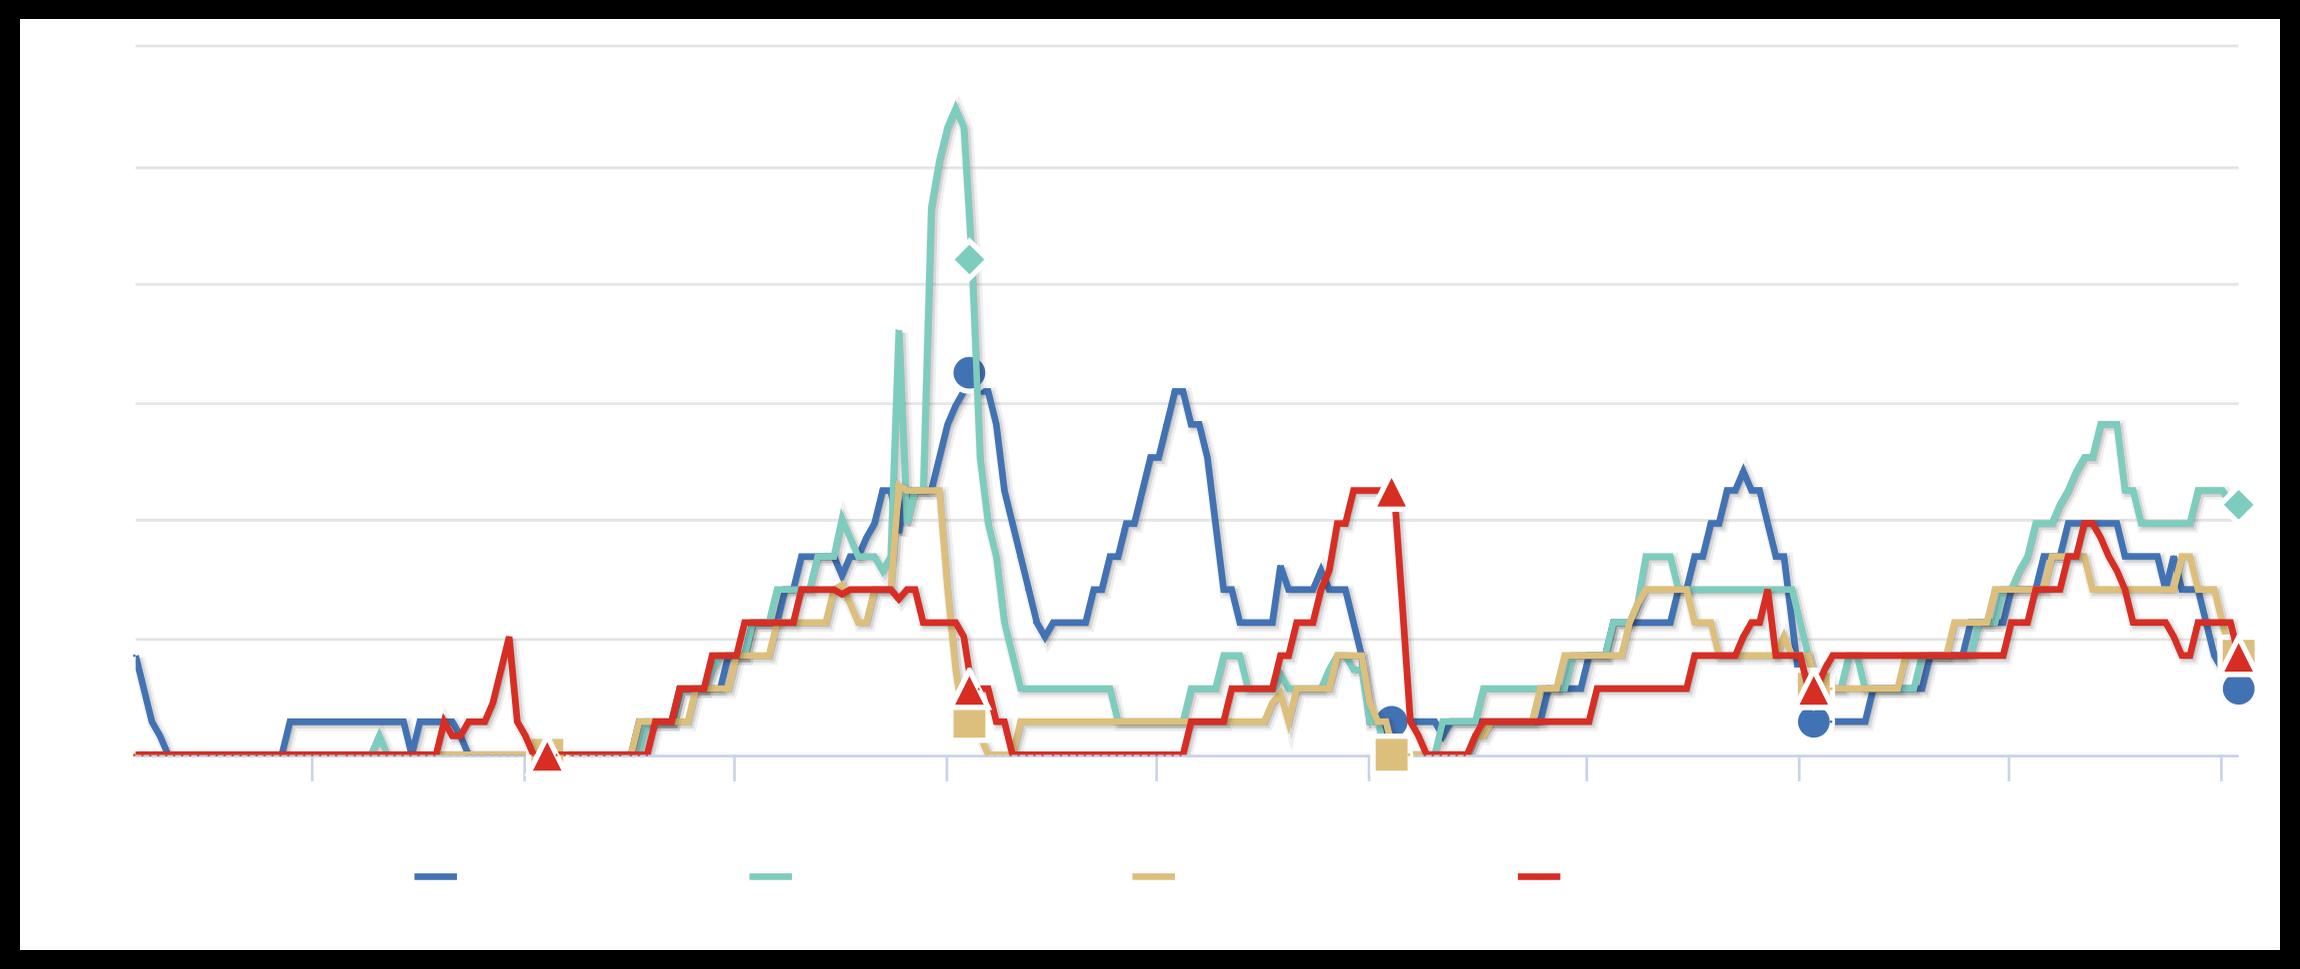
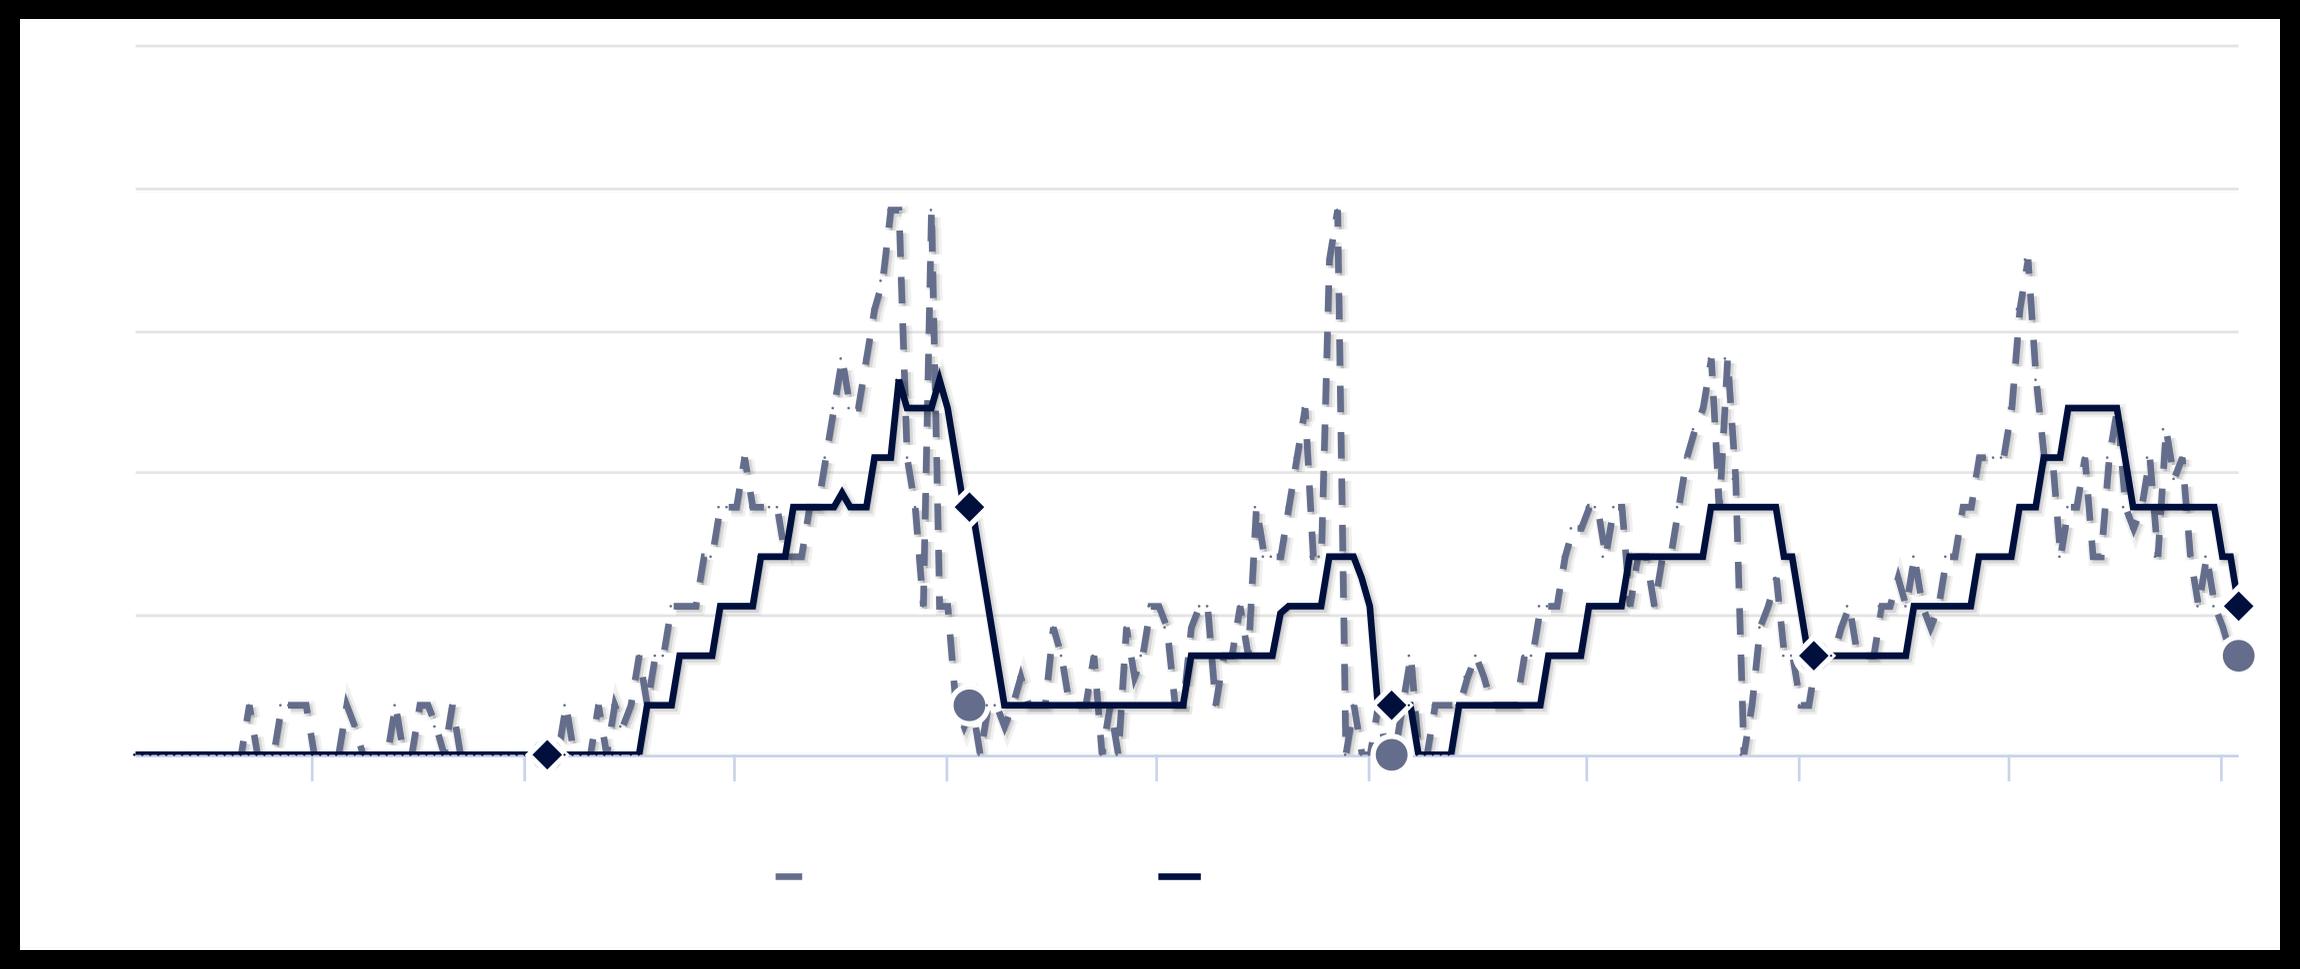
M a r k e t A c t i o n I n d e x
In the last few weeks the market has achieved a relative stasis point in terms of sales to inventory. However, inventory is sufficiently low to keep us in the Seller’s Market zone so watch changes in the MAI. If the market heats up, prices are likely to resume an upward climb.
M e d i a n D a y s o n M a r k e t ( D O M ) The properties have been on the market for an average of 64 days. Half of the listings have come newly on the market in the past 34 or so days. Watch the 90-day DOM trend for signals of a changing market.
S e g m e n t s It is not uncommon for the higher priced homes in an area to take longer to sell than those in the lower quartiles.