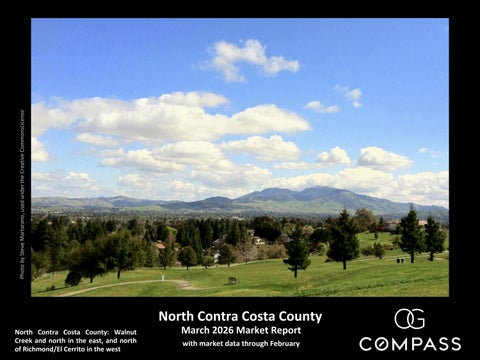
North Contra CostaMarket Report - March 2026.pdf

Page 1


North Contra Costa County

March 2026 Market Report with market data through February

Photo by Steve Martarano,
North Contra Costa County: Walnut Creek and north in the east, and north of Richmond/El Cerrito in the west

The Market Begins to Accelerate

Moving into spring, rising buyer demand vs. a low supply of homes for sale is creating a heating market characterized by faster sales and more overbidding of asking price. The upcoming months are typically the most active of the year and on current trends, conditions are expected to generate upward pressure on home values. Median home sales prices often hit their calendar-year highs in spring or early summer. The wild card in coming months is what sustained effects, if any, the Iran war may have on inflation, interest rates, financial markets and consumer confidence. There may be no significant impact on housing, unlike the tariff shock which caused an abrupt slowdown in last year’s spring market.

Report created in good faith using data from sources deemed reliable but may contain errors and subject to revision. Last period figures are preliminary estimates based on data available early in the following month. All numbers approximate and may change with late-reported activity.

Mortgage Interest Rates, August 2022 to 2026 YTD

30-Year Conforming Fixed-Rate Loans, Weekly Average Readings*

Rates vary widely according to the property, price, borrower and lender.

Per Freddie Mac (FHLMC), on March 5, 2026, the weeklyaverage, 30-year,conforming-loaninterest rate, illustrated on this chart, was 6%, essentially unchanged from the previous week. (However, as of 3/6/26, the daily average rate has risen to 6.14%, increasing 15 basis points since the Iran war began.)*

3/30/23

*Freddie Mac (FHLMC), 30-Year Fixed Rate Mortgage Weekly Average: https://www.freddiemac.com/pmms.

Crude Oil, Price per Barrel

Since February 2, 2026*

Dramatic ups and downs in oil prices, if sustained, can have considerable effects on consumer prices, transportation costs, inflation, consumer confidence and financial markets.

*Per Yahoo! Finance, https://finance.yahoo.com/quote/CL%3DF/history/. Data from sources deemed reliable but may contain errors. All numbers should be considered approximate.

Updated through March 6, 2026

Iran war begins

Financial Markets, 2025 – 2026

YTD

Percentage Increases in S&P 500 & Nasdaq since 1/2/25

Nasdaq Index: % Change since 01/25

S&P 500 Index: % Change since 01/25

Large changes in stock markets can dramatically affect household wealth, consumer confidence and housing markets, especially more affluent markets.

Data per MarketWatch.com, https://www.marketwatch.com/investing/index/comp/downloaddata and https://www.marketwatch.com/investing/index/spx/download-data. Data from source deemed reliable but may contain errors and subject to revision. Financial market values change constantly and all numbers to be considered approximate.

North Contra Costa County: House Price Trends

3-Month Rolling Median House Sales Prices since 2005*

Median sales price is that price at which half the sales occurred for more and half for less. It is a very general statistic, often affected by other factors besides changes in fair market value. Monthly and seasonal fluctuations are common, and longer-term trends are more meaningful than short-term changes.

2005-2006

Foreclosure crisis

2022

The 3-month-rolling median house sales price in February 2026 fell about 3% year over year. Median prices typically climb in spring.

North Contra Costa County: Walnut Creek and north in the east, and north of Richmond/El Cerrito in the west. $800,000 $750,000 $700,000 $650,000 $600,000 $550,000 $500,000 $450,000 $400,000 $350,000 $300,000 $250,000 $200,000 $150,000 $100,000

2019

Pandemic hits

Appreciation is typically measured year over year to account for market seasonality.

Updated through February 2026

*3-month rolling median house sales prices reported to NorCal MLS Alliance, per Infosparks, large sample of regional sales. Analysis may contain errors and subject to revision. All numbers approximate and may change with late-reported sales.

North Contra Costa County: Condo & Townhouse Price Trends

3-Month Rolling Median Sales Prices since 2005*

Median sales price is that price at which half the sales occurred for more and half for less. It is a very general statistic, often affected by other factors besides changes in fair market value. Monthly and seasonal fluctuations are common, and longer-term trends are more meaningful than short-term changes.

2005-2006-2007

Foreclosure crisis

The 3-month-rolling median condo sales price in February 2026 was down about 11% year over year, while the median townhouse price rose 1%.

North Contra Costa County: Walnut Creek and north in the east, and north of Richmond/El Cerrito in the west.

Median House Sales Prices: 3-Bedroom & 4-Bedroom Homes by Bay Area County, 12 Months Sales*

San Mateo

Santa Clara

$2,400,000

$1,830,000

$2,160,000

$1,880,000

San Francisco

Marin

$2,091,000

$1,580,000

$1,787,500

$1,325,000

Alameda

Napa

Contra Costa (all)

Sonoma

$1,550,000

$1,175,000

$1,107,500

$875,000

$971,500

$780,000

$857,500

$785,000

North Contra Costa

Solano

$799,500

$730,000 $680,000

$565,000

Median House Sales Prices

4BR/3BA, 2000 - 2300 Sq.Ft. House

3BR/2BA, 1400 - 1750 Sq.Ft. House

Median price is that price at which half the sales occurred for more and half for less. It is a very general statistic that typically disguises an enormous range of sales prices in the individual underlying sales. Counties and regions contain submarkets of widely different values. How these prices apply to any particular home is unknown without a comparative market analysis.

NorthContraCostareferstocommunitiesfrom Walnut Creek north.

Median House Dollar per Square Foot Values

by Bay Area County, 12 Months Sales*

North Contra Costa refers to communities from Walnut Creek north.

$1,209

$1,009

$1,155

$1,132

$981

$951

$865

$810

$758

$730

$743

$644

$558

Median House $/Sq.Ft. Values

3BR/2BA, 1400 - 1750 Sq.Ft. House 4BR/3BA, 2000 - 2300 Sq.Ft. House Napa

$528

$509

$404

$501

$451

$476 $378 $362 $317 Santa Clara San Mateo San Francisco Marin Alameda Santa Cruz Sonoma Contra Costa (all) North Contra Costa Solano

$/sq.ft. is based upon interior living space and doesn’t include garages, attics, basements, rooms built without permit, decks or lot size. All things being equal, a smaller home will typically sell for a higher $/sq.ft. value.

Counties and regions contain submarkets of widely different values. How these values apply to any particular home is unknown without a comparative market analysis.

New Listings Coming on Market

North Contra Costa Market Dynamics & Seasonality

North Contra Costa County: Walnut Creekandnorth inthe east, and north of Richmond/El Cerrito in the west.

2026 ticked up from January dropped about 8% year over year. but The number of new listings in February

The number of new listings coming on market ebbs and flows by seasonal trends, but it can be affected by specific market dynamics. It’s not unusual for the number to peak for the year in late spring/early summer before gradually declining to its mid-winter low point.

North Contra Costa County: Walnut Creek and north in the east, and north of Richmond/El Cerrito in the west.

As of 3/1/26, the number of listings was climbing, but slightly lower year over year. Listing inventory will almost certainly continue to rise through summer or fall.*

The quantity of active listings on a given day is affected by 1) the number of new listings coming on market, 2) how quickly buyers put them into contract, 3) the sustained heat of the market over time, and 4) sellers pulling their homes off market without selling. Updated on March 1, 2026

* Active/Coming-Soon house, condo, co-op and townhouse listings posted to NorCal MLS Alliance. Data from sources deemed reliable but may contain errors and subject to revision. Not all listings are posted to MLS. All numbers approximate. The number of active listings constantly changes.

Contra Costa County: Supply vs. Demand

#ofListingson Marketvs.AverageMonthlySales*

MSI measures how long it would take to sell the current inventory of active listings at the 12-month rate of sale. The lower the MSI, the stronger the buyer demand as compared to the supply of listings on the market.

As buyers jump back into the market in the new year faster than sellers list their homes, March is typically one of the months in which the supply of listings is lowest as compared to demand. These MSI readings are very low, signifying heated, competitive markets.

Overbidding List Prices in North Contra Costa County

Percentage of Home Sales Closing over List Price

Covering Contra Costa County north of Richmond/El Cerrito in the west and including Walnut Creek and north in the east.

Higher overbidding percentages signify more heated buyer competition for new listings. 48% of sales in February 2026 sold over list price, rebounding dramatically from January’s low.

Average Sales Price to Original List Price Percentage (SP/LP %)

North Contra Costa Market Dynamics: Over/Under Bidding

100% = an average sales price at original list price. 106% = an average sales price 6% over asking price; 96% = 4% below asking price.

Sales in 1 month mostly reflect market dynamics in the previous month. Seasonal ebbs and flows are typical, and overbidding usually peaks in the spring selling season.

The average home sale sold at list price in February 2026, its highest reading since spring 2025.

Listings

North Contra Costa County: Walnut Creek and north in the east, and north of Richmond/El Cerrito in the west

The number of listings going into contract in February 2026 continued to rise as the new year’s market gained steam.*

Percentage of Listings Accepting Offers

North Contra Costa County: Walnut Creek and north in the east, and north of Richmond/El Cerrito in the west.

Absorption rate is the comparison of buyer demand vs. the supply of homes for sale:

The higher the percentage, the more heated and competitive the market. Demand is currently outpacing supply, leading to an increase in the absorption rate.

*EastBayMLS reported data for houses, condos and townhouses, per Broker Metrics. Last month’s data estimated using available data, may change with late reported activity. Data from sources deemed reliable but may contain errors and subject to revision. All numbers approximate.

Monthly Home Sales Volume

North Contra Costa County: Walnut Creek and north in the

and north of Richmond/El Cerrito in the

Sales in one month mostly reflect accepted offers inthe previous month. The number of sales in February 2026 began its seasonal rebound from January’s low but fell year over year. Sales volume should accelerate in coming months.

through February 2026

North Contra Costa County: Higher Price & Luxury Home Sales

HomesSellingfor$1.5Million+,since2021

NorthContra Costa County:WalnutCreek and north in the east, and north of Richmond/El Cerrito in the west. 2022 Oct.

Sales in one month mostly reflect accepted-offer activity in the previous month. The annual low count of higher-price home sales usually occurs in January reflecting December’s slow market.

Price Reductions on Active Listings

The

Contra Costa County Market Dynamics & Seasonality

The number of county price reductions in February 2026 fell 9% year over year.

Average Days on Market – Speed of Sale

North Contra Costa: Market Dynamics & Seasonality

A measurement of how quickly the listings which sell go into contract, this statistic typically fluctuates according to seasonal demand trends and is a lagging indicator of market activity 3-6 weeks earlier.

Homes usually sell fastest in spring as buyers respond to the rush of new listings. Sales in midwinter are typically dominated by listings that have been on the market much longer. Average days-on-market in February 2026 dropped from January but were 5 days higher than inFebruary 2025. Walnut Creek and north in the east, and north of Richmond/El Cerrito in the west.

Large sample of sales of houses, condos, townhouses reported to NorCal MLS Alliance, per Infosparks. Data derived from sources deemed reliable but may contain errors and subject to revision. All numbers approximate and may change with late-reported sales.

Additional Economic & Demographic Data

VIX Volatility Index*

By Day in 2025

“The CBOE Volatility Index, or VIX, is a real-time market index representing the [stock] market’s expectations for volatility over the coming 30 days. Investors use the VIX to measure the level of risk, fear, or stress in the market when making investment decisions.” Quote from Investopedia

► On 3/6/26, the VIX Volatility Index hit its highest point since the tariff shock in April 2025.

Mar-25

*CBOE Volatility Index (VIX), per https://www.cboe.com/tradable_products/vix/vix_historical_data/ and/or Yahoo! Finance: https://finance.yahoo.com/quote/%5EVIX/history/. Data from sources deemed reliable but may contain errors. All numbers approximate.

The CAPE ratio is a stock market valuation measure created by economist Robert Shiller. It is defined as the current price of the S&P 500 divided by the moving-average of 10 years of inflation-adjusted earnings and is principally used to assess likely future returns over longer periods. A higher CAPE ratio can suggest investors are expecting higher future growth, or that the stock market is overvalued.

As of early 2026, the CAPE ratio has been running at its highest readings since the dotcom bubble.

Economic Policy Uncertainty Index*

By Month since January 2000

The Economic Policy Uncertainty Index reading has plummeted since the April 2025 tariff shock butreboundedhigher in JanuaryandFebruary2026 toa level very high by long-term standards. This chart pre-dates the start of the Iran war.

Tariff shock►

The Economic Uncertainty Index is constructed from data analysis of 1) an index of search results from 10 large newspapers for terms related to economic and policy uncertainty, 2) reports by the Congressional Budget Office, and 3) the Federal Reserve Bank of Philadelphia's Survey of Professional Forecasters.*

*Source: 'Measuring Economic Policy Uncertainty' by Scott Baker, Nicholas Bloom and Steven J. Davis, 3component index, www.PolicyUncertainty.com, https://www.policyuncertainty.com/us_monthly.html.

U.S. Jobs Report*

MonthlyChangeinNumber of Jobs, in Thousands*

Note: BLS often revises its monthly estimates, sometimes very substantially.

*U.S. Bureau of Labor Statistics, “All employees, thousands, total nonfarm, seasonally adjusted”: https://data.bls.gov/timeseries/CES0000000001&output view=net 1mth. Last 2 readings are labeled “preliminary” and often substantially revised. Data from sources deemed reliable but may contain errors. Monthly Change in U.S. NonFarm Employment, in Thousands Employment trends and job security continue to be major concerns of consumers and economists.

Contra Costa County Population

Breakdown Estimates by Race/Ancestry

Approximately 27% of the population was foreign-born.

The Bay Area has one of the most diverse populations in the world.

As self-identified by residents: Categories as delineated by U.S. Census.

Statistics are generalities, essentially summaries of widely disparate data generated by dozens, hundreds or thousands of unique, individual sales occurring within different time periods. They are best seen not as precise measurements, but as broad, comparative indicators, with reasonable margins of error. Anomalous fluctuations in statistics are not uncommon, especially in smaller, expensive market segments. Last period data should be considered estimates that may change with late-reported data. Different analytics programs sometimes define statistics – such as “active listings,” “days on market,” and “months supply of inventory” – differently: what is most meaningful are not specific calculations but the trends they illustrate. Most listing and sales data derives from the local or regional multi-listing service (MLS) of the area specified in the analysis, but not all listings or sales are reported to MLS and these won’t be reflected in the data. “Homes” signifies real-property, single-household housing units: houses, condos, co-ops, townhouses, duets and TICs (but not mobile homes), as applicable to each market. City/town names refer specifically to the named cities and towns, unless otherwise delineated. Multi-county metro areas will be specified as such. Data from sources deemed reliable, but may contain errors and subject to revision. All numbers to be considered approximate.

Many aspects of value cannot be adequately reflected in median and average statistics: curb appeal, age, condition, amenities,

views, lot size, quality of outdoor space, “bonus” rooms, additional parking, quality of location within the neighborhood, and so on. How any of these statistics apply to any particular home is unknown without a specific comparative market analysis.

Median Sales Price is that price at which half the properties sold for more and half for less. It may be affected by seasonality, “unusual” events, or changes in inventory and buying trends, as well as by changes in fair market value. The median sales price for an area will often conceal an enormous variety of sales prices in the underlying individual sales.

Dollar per Square Foot is based upon the home’s interior living space and does not include garages, unfinished attics and basements, rooms built without permit, patios, decks or yards (though all those can add value to a home). These figures are usually derived from appraisals or tax records, but are sometimes unreliable (especially for older homes) or unreported altogether. The calculation can only be made on those home sales that reported square footage.

Photo use under the Creative Commons License: https://creativecommons.org/licenses/by-sa/2.0/

Compass is a real estate broker licensed by the State of California, DRE 01527235. Equal Housing Opportunity. This report has been prepared solely for information purposes. The information herein is based on or derived from information generally available to the public and/or from sources believed to be reliable. No representation or warranty can be given with respect to the accuracy or completeness of the information. Compass disclaims any and all liability relating to this report, including without limitation any express or implied representations or warranties for statements contained in, and omissions from, the report. Nothing contained herein is intended to be or should be read as any regulatory, legal, tax, accounting or other advice and Compass does not provide such advice. All opinions are subject to change without notice. Compass makes no representation regarding the accuracy of any statements regarding any references to the laws, statutes or regulations of any state are those of the author(s). Past performance is no guarantee of future results.

Turn static files into dynamic content formats.

Create a flipbook