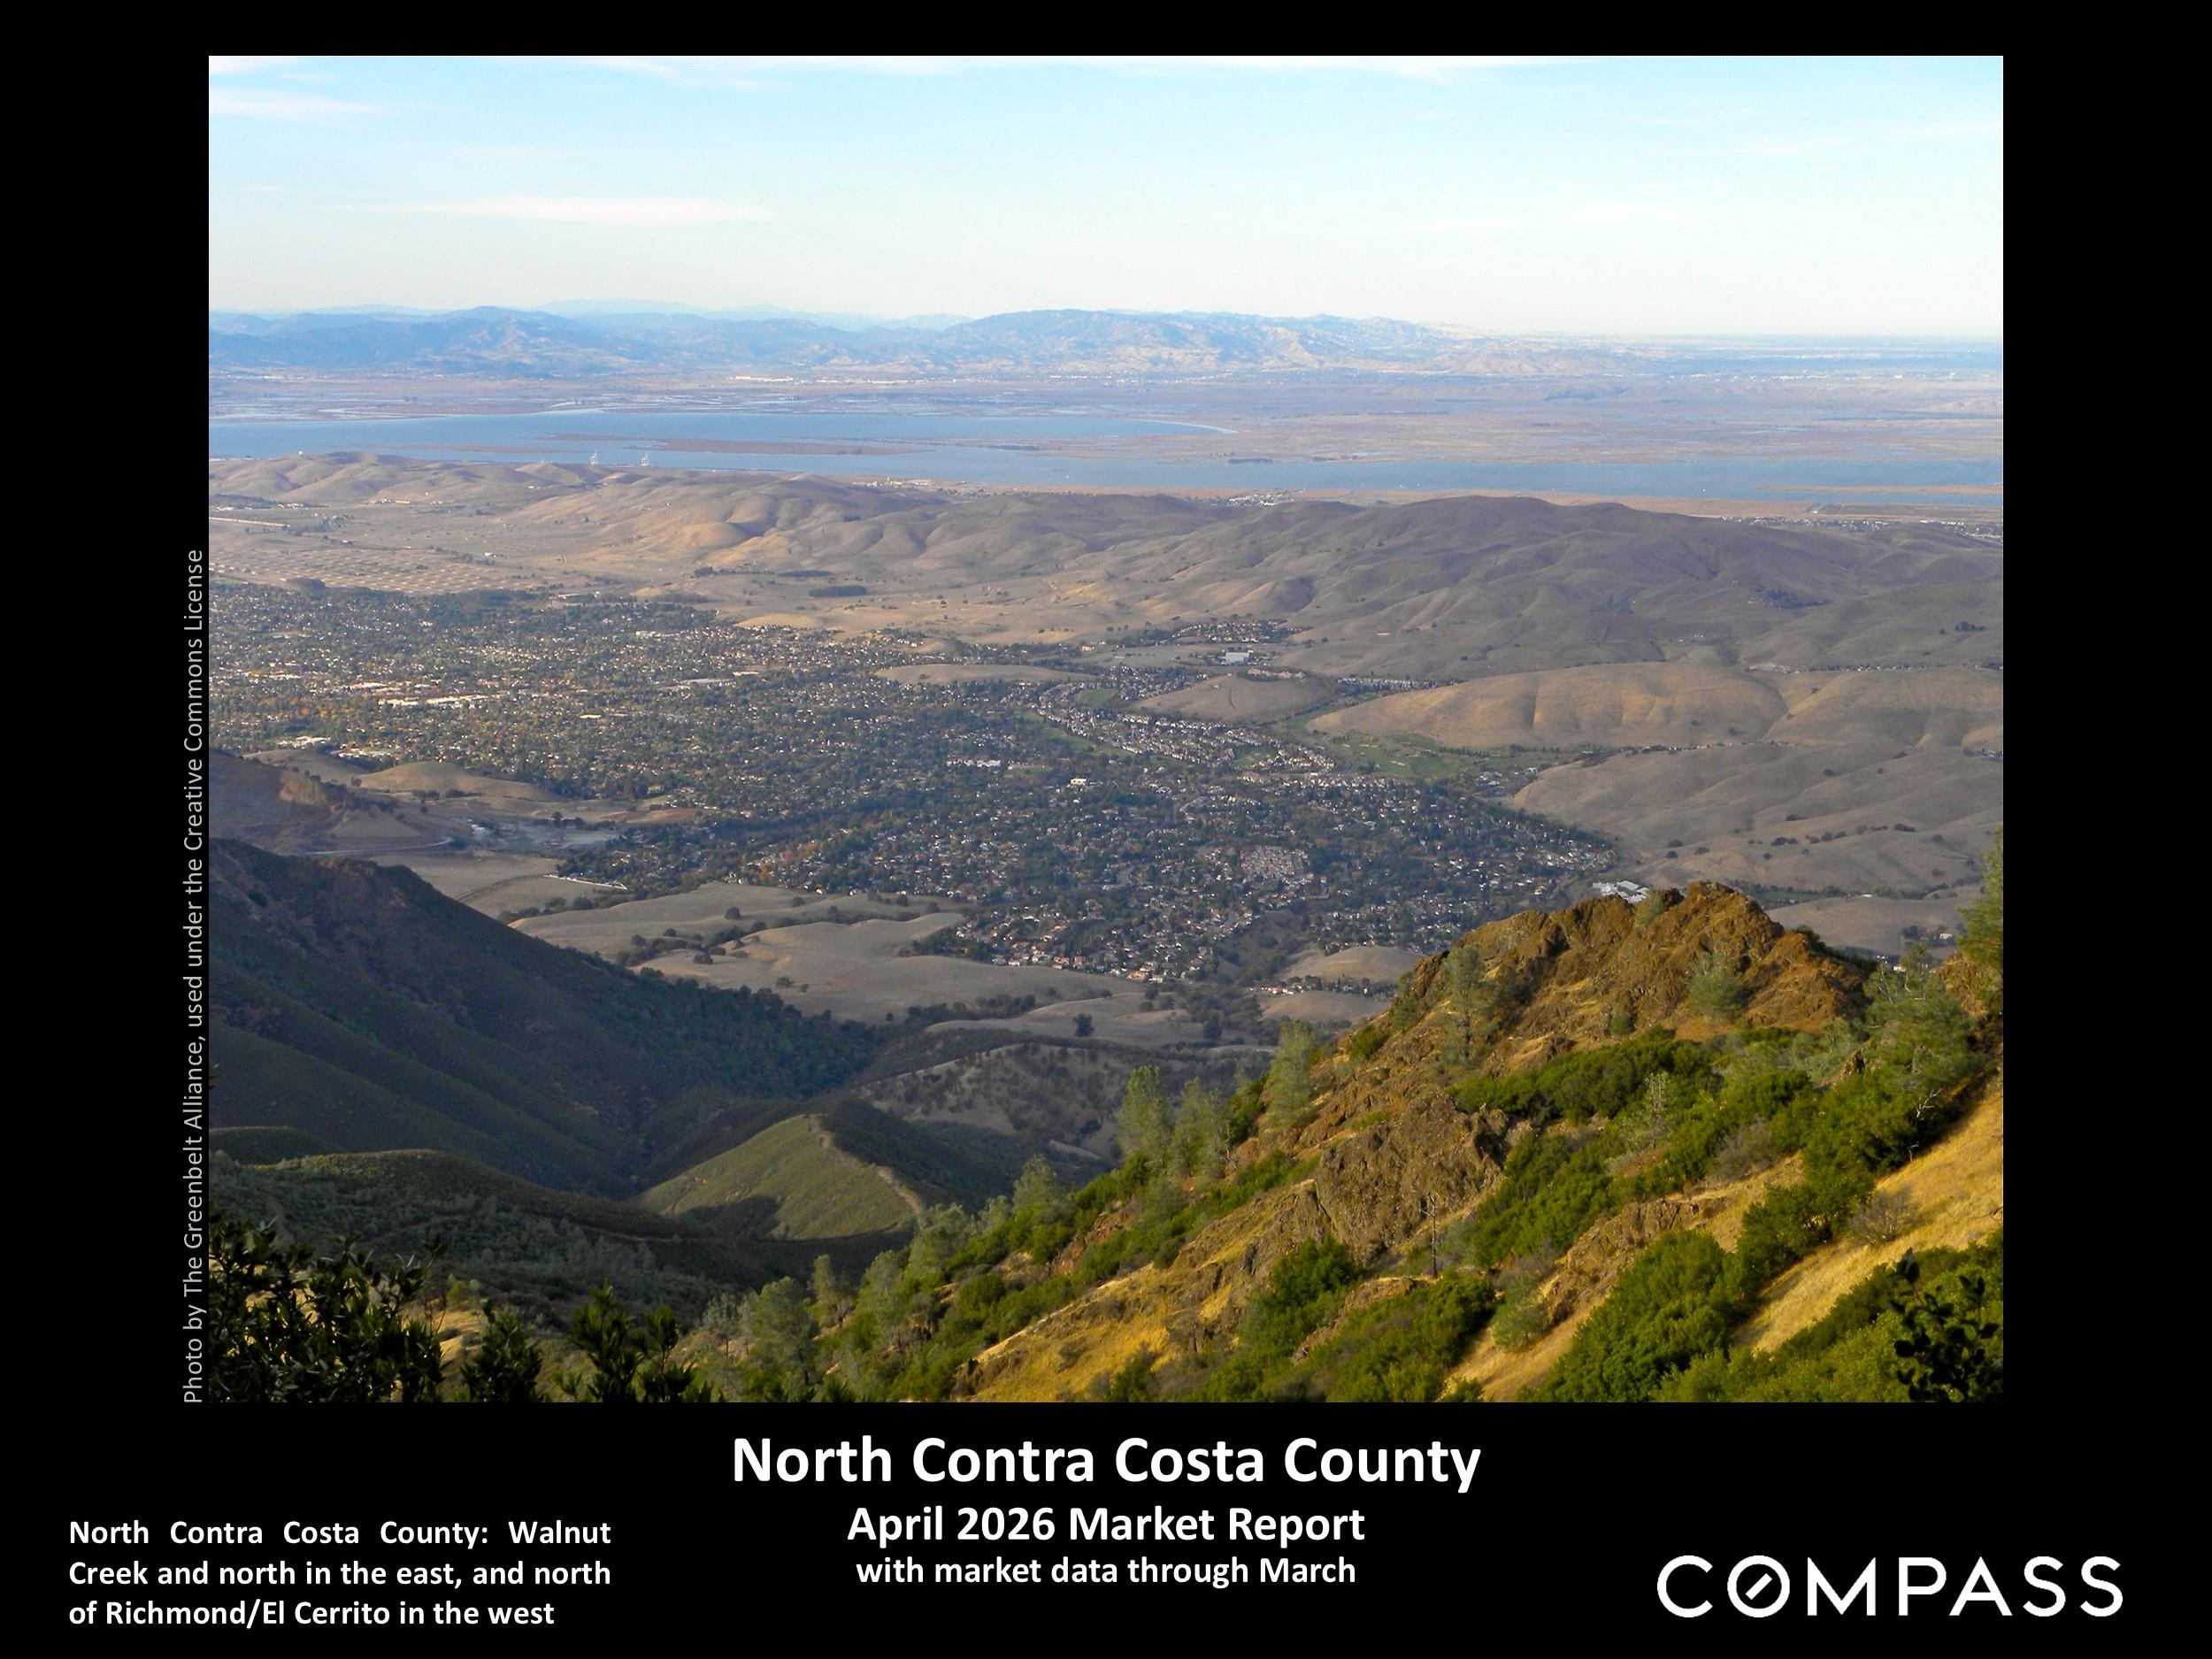


Despite significant negative economic effects from the Iran war – rising interest rates; volatile financial markets; soaring oil and gas prices; and fears of increased inflation –Bay Area real estate markets saw relatively little impact in March. It is possible that some sellers may have delayed listing their homes as they waited for more clarity regarding economic conditions. But so far, there has been no reaction comparable to what occurred last year with the tariff shock, and as of April 8th , virtually all economic indicators were turning in positive directions with the cease fire announcement.
Moving into spring, the number of listings going into contract climbed considerably both month over month and year over year – but the number of listings on the market fell from last year. As buyers competed for a reduced supply of homes for sale, the absorption rate and overbidding increased, listings went into contract faster, and price reductions declined from March 2025. This pressure of demand may lead to renewed price appreciation in the second quarter.
As has been the case in the last year, house markets remain considerably stronger than townhouse and condo markets.
Report created in good faith using data from sources deemed reliable but may contain errors and subject to revision. Last period figures are preliminary estimates based on data available early in the following month. All numbers approximate and may change with late-reported activity.

This chart pertains to HOUSE sales. There were also 846 condo & co-op sales (445 in Rossmoor) and 510 townhouse & duet sales in the period.
*12 months sales reported to NorCal MLS Alliance by mid-March 2026. Data based upon sources deemed reliable but may contain errors and subject to revision. All numbers approximate and change constantly.
Walnut Creek
Pleasant Hill
Clayton
Pt. Richmond
Hercules
Martinez
Discovery Bay
Concord
Brentwood
Bethel Island
Pinole
El Sobrante
Oakley
Rodeo
Antioch
Pittsburg
San Pablo
Bay Point
$1,518,000
$1,135,000
$1,122,000
$1,034,000
$855,500
$827,000
$820,000
$815,000
$795,000
$749,000
$740,000
$724,000
$680,000
$672,500
$610,000
$592,000
$591,000
$560,000
12 months sales through mid-March 2026*
Median sales price is that price where half the homes sold for more and half for less. It is a general statistic that typically disguises a wide range of prices in the underlying sales. It can be affected by a variety of factors, including market conditions, location, age and quality of construction, median house and lot sizes, and many other factors.
This chart reflects median HOUSE sales prices. For the region, the median condo/co-op sales price was $445,000, and for townhouses and duets, $640,000.
El
Bethel
DOLLAR PER SQUARE FOOT is based upon interior living space and doesn’t include garages, attics, basements, rooms built without permit, storage rooms, patios, decks or lot sizes. All things being equal, a smaller house will sell for a higher $/sq.ft.
This chart reflects median HOUSE $/sq.ft. values. For the region, the median condo/co-op $/sq.ft. value was $443, and for townhouses and duets, $456.
Median home sizes vary widely, with significant impact on home sales values.
Square footage is calculated on interior living space and does not include garages, attics, rooms built without permit, storage rooms, patios, decks or lot sizes (though all these can add value).
This chart reflects median HOUSE size. The region’s median condo/co-op size was 1054 sq.ft., and for townhouses & duets, 1411 sq.ft.
$2,000,000+
$1,500,000 - $1,999,999
$1,250,000 - $1,499,999
Sales by Property Type*
• House 76%
• Condo/Co-op 16%
• Townhouse/duet 8%
$750,000 –$999,999
$500,000 - $749,999
Walnut Creek and north in the east, and north of Richmond/El Cerrito in the west
*Sales and listings pending sale reported to NorCal MLS Alliance by 3/31/26. Not all sales are reported to MLS. Listings pending sale may not close, and pending-sale list prices may not reflect final closing prices. Data from sources deemed reliable but may contain errors and subject to revision. All numbers approximate. Percentages rounded and may not add up to 100%.
Q2 2022 Peak
Median sales price is that price where half the homes sold for more and half for less. It is a very general statistic that typically disguises a wide range of prices in the underlying sales. It is not unusual for median sales prices to peak for the calendar year in Q2 (spring).
Walnut Creek and north in the east, and north of Richmond/El Cerrito in the west.
Pandemic hits
The Q1 2026 median house sales price declined slightly year-over-year. Q2 2023 Q2 2021
Appreciation is typically measured year over year to account for market seasonality. Q2 2024 Q2 2025
As reported to East Bay MLS, per Broker Metrics. Median sales price is that price at which half the sales occurred for more and half for less. It can be affected by other factors besides changes in fair market value. Numbers approximate, subject to revision, and may change with late-reported sales.
Average Dollar per Square Foot by Quarter, since 2017
The Q1 2026 median house $/sq.ft. value was essentially unchanged year-over-year.

Dollar per Square Foot is based upon interior living space and doesn’t include garages, attics, basements, rooms built without permit, decks, patios or lot sizethough all those features can add value.
Walnut Creek and north in the east, and north of Richmond/El Cerrito in the west.
Average dollar per square foot figures often run somewhat higher than median figures. What’s meaningful is the trend.
As reported to East Bay
Pandemic hits
Median sales price is that price at which half the sales occurred for more and half for less. It is a very general statistic, often affected by other factors besides changes in fair market value. Monthly and seasonal fluctuations are common, and longer-term trends are more meaningful than short-term changes.
2005-2006-2007
3-Month Rolling Median Sales Prices since 2005* $$100,000 $200,000 $300,000 $400,000 $500,000 $600,000 $700,000
2022 2023
2024 2025 2019
North Contra Costa County: Walnut Creek and north in the east, and north of Richmond/El Cerrito in the west.
Pandemic hits ▲
The 3-month-rolling median condo sales price in March 2026 was down about 10% year over year, while the median townhouse price fell 6.5%.
Foreclosure crisis
*3-month rolling median condo and townhouse sales prices reported to NorCal MLS Alliance, per Infosparks, large sample of regional sales. Analysis may contain errors and subject to revision. All numbers approximate and may change with late-reported sales.
Updated through March 2026

July 2021
June 2022
North Contra Costa County: Walnut Creek and north in the east, and north of Richmond/El Cerrito in the west.
The number of new listings in March 2026 jumped from February but was essentially unchanged year over year.
May 2025
May 2024
June 2023

The number of new listings coming on market ebbs and flows by seasonal trends, but it can be affected by specific market dynamics. It’s not unusual for the number to peak for the year in late spring/early summer before gradually declining to its mid-winter low point.
Updated through March 2026
Listings posted to East Bay MLS, per Broker Metrics. Data from sources deemed reliable but may contain errors and subject to revision. All numbers should be considered approximate.
& Coming-Soon Listings on 1st of Month*
945 1,196 1,317 1,177 1,191 1,135 966
As of 4/1/26, the number of listings was climbing, but lower year over year. Listing inventory will almost certainly continue to rise through summer or fall.*
North Contra Costa County: Walnut Creek and north in the east, and north of Richmond/El Cerrito in the west.
1,183 1,387 1,525 1,536 1,558 1,467 1,443 1,304 1,065 744 903 991 1,105
The quantity of active listings on a given day is affected by 1) the number of new listings coming on market, 2) how quickly buyers put them into contract, 3) the sustained heat of the market over time, and 4) sellers pulling their homes off market without selling. Updated on April 1, 2026
* Active/Coming-Soon house, condo, co-op and townhouse listings posted to NorCal MLS Alliance. Data from sources deemed reliable but may contain errors and subject to revision. Not all listings are posted to MLS. All numbers approximate. The number of active listings constantly changes.
Covering Contra Costa County north of Richmond/El Cerrito in the west and including Walnut Creek and north in the east.
March 2024
March 2025 | Pandemic hits
Higher overbidding percentages signify more heated buyer competition for new listings. 50% of sales in March 2026 sold over list price, the highest percentage since spring 2025. MidWinter
2026
Large sample of regional sales data reported to NORCAL MLS® ALLIANCE, per Infosparks. Reflecting the percentage of sales closing at sales prices over the final list prices. Data from sources deemed reliable but may contain errors and subject to revision. All numbers approximate and may change with late-reported sales.
100% = an average sales price at original list price. 106% = an average sales price 6% over asking price; 96% = 4% below asking price. April 2022
Sales in 1 month mostly reflect market dynamics in the previous month. Seasonal ebbs and flows are typical, and overbidding usually peaks in the spring selling season.
Pandemic boom
The average home sale sold slightly over list price in March 2026, March 2024 March 2025
Walnut Creek and north in the east, and north of Richmond/El Cerrito in the west.
Large sample of sales of houses, condos, townhouses reported to NorCal MLS Alliance, per Infosparks. Data derived from sources deemed reliable but may contain errors and subject to revision. All numbers approximate.
Updated through March 2026
North Contra Costa County: Walnut
Creek and north in the east, and north of Richmond/El Cerrito in the west.
*EastBayMLS reported data for houses, condos and townhouses, per Broker Metrics. Last month’s data estimated using available data, may change with late reported activity. Data from sources deemed reliable but may contain errors and subject to revision. All numbers approximate. March
Absorption rate is the comparison of buyer demand vs. the supply of homes for sale: The higher the percentage, the more heated and competitive the market.
Rising demand is outpacing changes in supply, leading to an increase in the absorption rate.
Pandemic
March 2025
Updated through March 2026
June 2021
January
Sales in one month mostly reflect accepted offers in the previous month.
North Contra Costa County: Walnut Creek and north in the east, and north of Richmond/El Cerrito in the west March 2022
The number of sales in March 2026 continued to climb quickly and was essentially the same as in March 2025. Based on accepted-offer activity, sales volume should rise in April. May
| Pandemic boom |
| Interest rate changes impact the market
Updated through March 2026
North Contra Costa County: Higher Price & Luxury Home Sales Market Dynamics & Seasonality: Homes Selling for $1.5 Million+, since 2021
North Contra Costa County: Walnut Creek and north in the east, and north of Richmond/El Cerrito in the west.
Sales in one month mostly reflect accepted-offer activity in the previous month. Higher-price home sales usually climb through spring.
July 2022
The number of price reductions typically ebbs and flows by season but can also be affected by specific events in the economy and the market.
The number of county price reductions in March 2026 fell 20% year over year. June 2025
July 2024
Oct. 2023
Aug. 2021
Per Realtor.com Research: https://www.realtor.com/research/data/,
Updated through March 2026
Walnut Creek and north in the east, and north of Richmond/El Cerrito in the west.
A measurement of how quickly the listings which sell go into contract, this statistic typically fluctuates according to seasonal demand trends and is a lagging indicator of market activity 3-6 weeks earlier. Jan. 2022
Homes usually sell fastest in spring as buyers respond to the rush of new listings. Sales in midwinter are typically dominated by listings that have been on the market much longer. Average days-on-market in March 2026 continued to fall from the usual January high. | Interest rate changes impact the market Pandemic boom
Jan. 2026
Updated through March 2026
Large sample of sales of houses, condos, townhouses reported to NorCal MLS Alliance, per Infosparks. Data derived from sources deemed reliable but may contain errors and subject to revision. All numbers approximate and may change with late-reported sales.
U.S. Census Estimates, July 1st to July 1st
Changes measured from July 1st of previous year to July 1st of labeled year. Population changes are driven by domestic and foreign migration into and out of the county, and by natural causes, i.e. births less deaths.
1,052,540 1,065,440 1,077,548 1,093,401 1,108,876 1,124,405
2024 to 2025, the county saw negative domestic migration (-6721), positive foreign migration (+4331), and more births than deaths (+2868). In California, net foreign immigration plunged approximately 65% in the last 12-month period and is expected to decline further in the period underway.
Contra Costa since the pandemic struck: -44,619 in net domestic migration, +32,655 in net foreign migration, and +14,796 in natural change.
Estimates as of July 1 of each year. 2020-2025 data published March 26, 2026, by U.S. Census. The Census often revises numbers in subsequent estimates. All numbers to be considered approximate. Census numbers may not total perfectly due to “Population change that cannot be attributed to any specific demographic component.”
1,000,000 1,025,000 1,050,000 1,075,000 1,100,000 1,125,000 1,150,000 1,175,000


Rates vary widely according to the property, price, borrower and lender.
Per Freddie Mac (FHLMC), on April 2, 2026, the weekly average, 30-year, conforming-loan interest rate rose to 6.46%, up from 5.98% before the Iran war began. The cease fire announced on 4/7/26 may exert downward pressure on interest rates.* Jan. 2026
war begins↑
*Freddie Mac (FHLMC), 30-Year Fixed Rate Mortgage Weekly Average: https://www.freddiemac.com/pmms.
Percentage Increases in S&P 500 & Nasdaq since 1/2/25
Nasdaq Index: % Change since 01/25
S&P 500 Index: % Change since 01/25
Tariff shock ►
Updated mid-day 4/8/26
Large changes in stock markets can dramatically affect household wealth, consumer confidence and housing markets, especially more affluent markets. Iran war begins ↑
Cease fire announced ↑
Data per MarketWatch.com, https://www.marketwatch.com/investing/index/comp/downloaddata and https://www.marketwatch.com/investing/index/spx/download-data. Data from source deemed reliable but may contain errors and subject to revision. Financial market values change constantly and all numbers to be considered approximate.
Since February 2, 2026*
Dramatic ups and downs in oil prices can have considerable effects on manufacturer & consumer prices, transportation costs, inflation, consumer confidence and financial markets. Prices have often been volatile even on an intra-day basis as events, predictions, threats and announcements change.
| Iran war begins
Updated mid-day April 8, 2026
Cease fire announced |
*Per Yahoo! Finance, https://finance.yahoo.com/quote/CL%3DF/history/. Data from sources deemed reliable but may contain errors. All numbers should be considered approximate.
Any impact of the Iran war ceasefire has not yet shown up in gas prices.
Updated mid-day 4/8/26
* U.S. Energy Information Administration, US Regular All Formulations Gas Price: Weighted average based on sampling of approximately 900 retail outlets. Not seasonally adjusted. Federal Reserve Bank of St. Louis; https://fred.stlouisfed.org/series/GASREGW and daily updates per https://gasprices.aaa.com/. Data from sources deemed reliable but may contain errors.
The Economic Policy Uncertainty Index reading has plummeted since the April 2025 tariff shock but rebounded higher in 2026 to a level very high by longterm standards. Still, the increase since the Iran war began has been muted.
The Economic Uncertainty Index is constructed from data analysis of 1) an index of search results from 10 large newspapers for terms related to economic and policy uncertainty, 2) reports by the Congressional Budget Office, and 3) the Federal Reserve Bank of Philadelphia's Survey of Professional Forecasters.*
Dotcom crash & 9/11
Tariff shock ►
Subprime crash & great recession
*Source: 'Measuring Economic Policy Uncertainty' by Scott Baker, Nicholas Bloom and Steven J. Davis, 3component index, www.PolicyUncertainty.com, https://www.policyuncertainty.com/us_monthly.html.
Updated March 18, 2026
◄ Early 1980’s: Fed aggressively raises fed funds target rate to lower inflation rate
In September 2024, the Fed reduced the rate by a half point, and then by a quarter point in November and December. In September, October and December 2025, the rate was reduced by a quarter point each time. There were no changes in January or February 2026. Additional adjustments in 2026 are a topic of much discussion and uncertainty. Early 1990’s recession: Fed drops target interest rate 18 times, 1990-92
Dotcom crash, 9/11 attack: Fed drops fed fund rate 12 times, 2001-02

Junk bond boom
Dotcom boom
2022/2023: Acting to counter inflation, Fed increases target rate 11 times, then pauses 8/2023 – 8/2024
Subprime crash: Fed drops rate 10 times to effectively zero in 2007-08
2019, 2020, 2021: With the pandemic, the Fed drops the rate to effectively zero
High-tech & pandemic booms
Subprime boom
* Per Federal Reserve Bank of St. Louis and New York; https://fred.stlouisfed.org/series/FEDFUNDS; Last reading per https://www.newyorkfed.org/markets/reference-rates/effr. Other data referenced from sources deemed reliable but may contain errors and subject to revision.
Statistics are generalities, essentially summaries of widely disparate data generated by dozens, hundreds or thousands of unique, individual sales occurring within different time periods. They are best seen not as precise measurements, but as broad, comparative indicators, with reasonable margins of error. Anomalous fluctuations in statistics are not uncommon, especially in smaller, expensive market segments. Last period data should be considered estimates that may change with late-reported data. Different analytics programs sometimes define statistics – such as “active listings,” “days on market,” and “months supply of inventory” – differently: what is most meaningful are not specific calculations but the trends they illustrate. Most listing and sales data derives from the local or regional multi-listing service (MLS) of the area specified in the analysis, but not all listings or sales are reported to MLS and these won’t be reflected in the data. “Homes” signifies real-property, single-household housing units: houses, condos, co-ops, townhouses, duets and TICs (but not mobile homes), as applicable to each market. City/town names refer specifically to the named cities and towns, unless otherwise delineated. Multi-county metro areas will be specified as such. Data from sources deemed reliable, but may contain errors and subject to revision. All numbers to be considered approximate.
Many aspects of value cannot be adequately reflected in median and average statistics: curb appeal, age, condition, amenities, views, lot size, quality of outdoor space, “bonus” rooms, additional parking, quality of location within the neighborhood, and so on. How any of these statistics apply to any particular home is unknown without a specific comparative market analysis.
Median Sales Price is that price at which half the properties sold for more and half for less. It may be affected by seasonality, “unusual” events, or changes in inventory and buying trends, as well as by changes in fair market value. The median sales price for an area will often conceal an enormous variety of sales prices in the underlying individual sales.
Dollar per Square Foot is based upon the home’s interior living space and does not include garages, unfinished attics and basements, rooms built without permit, patios, decks or yards (though all those can add value to a home). These figures are usually derived from appraisals or tax records, but are sometimes unreliable (especially for older homes) or unreported altogether. The calculation can only be made on those home sales that reported square footage.
Photo use under the Creative Commons License: https://creativecommons.org/licenses/by-sa/2.0/
Compass is a real estate broker licensed by the State of California, DRE 01527235. Equal Housing Opportunity. This report has been prepared solely for information purposes. The information herein is based on or derived from information generally available to the public and/or from sources believed to be reliable. No representation or warranty can be given with respect to the accuracy or completeness of the information. Compass disclaims any and all liability relating to this report, including without limitation any express or implied representations or warranties for statements contained in, and omissions from, the report. Nothing contained herein is intended to be or should be read as any regulatory, legal, tax, accounting or other advice and Compass does not provide such advice. All opinions are subject to change without notice. Compass makes no representation regarding the accuracy of any statements regarding any references to the laws, statutes or regulations of any state are those of the author(s). Past performance is no guarantee of future results.