DESIGN STUDIO ERIK L’HEUREUX [PHD] FAIA HEAD OF THE DEPARTMENT OF ARCHITECTURE
ARC4001/5001, 2026 M.ARCH, SEMESTER 1
HOT AIR TRANSFORMATIONS: KUALA LUMPUR
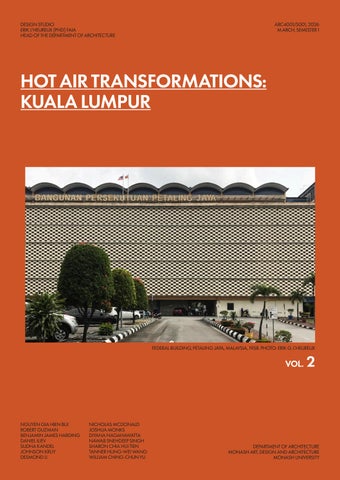
FEDERAL BUILDING, PETALING JAYA, MALAYSIA, 1958. PHOTO: ERIK G. L’HEUREUX
VOL.
NGUYEN GIA HIEN BUI ROBERT GUZMAN BENJAMIN JAMES HARDING DANIEL ILIEV SUDHA KANDEL JOHNSON KRUY DESMOND LI
NICHOLAS MCDONALD JOSHUA MONKS DIYANA NAGAHAWATTA NAWAB SNEHDEEP SINGH SHARON CHIA HUI TIEN TANNER HUNG-WEI WANG WILLIAM CHING-CHUN YU
2
DEPARTMENT OF ARCHITECTURE MONASH ART, DESIGN AND ARCHITECTURE MONASH UNIVERSITY 1
2
ACKNOWLEDGEMENT OF COUNTRY — AUSTRALIA We acknowledge that the land on which we study and work at Caulfield is the unceded Country of the Wurundjeri Woi Wurrung and Bunurong peoples of the Kulin Nation. We recognise them as the Traditional Custodians of these lands and waters, and acknowledge their continuing cultural, spiritual and ecological relationships with Country. We pay our respects to Elders past and present, and extend this respect to all Aboriginal and Torres Strait Islander peoples. We commit to engaging with this work with humility, care and respect.
ACKNOWLEDGEMENT OF COUNTRY — MALAYSIA We acknowledge that the lands on which we study and work in Malaysia are the traditional territories of the Orang Asli peoples of Peninsular Malaysia and the Indigenous peoples of Sabah and Sarawak, including communities such as the Semai, Temuan, Jakun, Kadazan-Dusun, Bajau, Murut, Iban, and Bidayuh, among many others. We recognise them as the original custodians of these lands with enduring cultural and ecological relationships that continue today. We pay our respects to Elders past and present and commit to engaging with this work in Kuala Lumpur with humility and care.
3
ARC4001/5001 HOT AIR TRANSFORMATIONS: Studio Coordination Sudha Kandel Travel + Admin Nawab Singh Graphics + Admin Nick Mcdonald Graphics Desmond Li Graphics Studio List Hien Bui Robert Guzman Ben Harding Daniel Iliev Johnson Kruy Josh Monks Diyana Nagahawatta Chia Hui Tien Hung-Wei Wang Ching-Chun Yu
CLASS FOLIO BY NAWAB SINGH & SUDHA KANDEL
4
ARC4001/5001 HOT AIR TRANSFORMATIONS: Acknowledgement Of Country
2
Adaptive Re-Use & New Build Summaries
6
Chartered Bank Adaptive Re-Use - Nawab & Sudha - Nick & Des & Tanner - Rob
8 14 56 94
5
ADAPTIVE RE-USE & NEW BUILD PROJECTS
6
Kuala Lumpur 2026 Embodied Carbon/sqm Operational Carbon EUI (kgCO₂e/m²) (kWh/m²/yr) SITE A: Chartered Bank Building 1.
Equatorial Campus - Nawab & Sudha
414 45
Equatorial School of Architecture 146 60 - Nick & Des & Tanner 3. Timber Confluence 188 34 - Rob 2.
SITE B: Telekom Building 4.
Durian Campus 456 41 - Josh & Johnson
5.
Vertical Flow 372 52 - Hien & Diyana
SITE C: Ming Building Urban Jungle 323 46 - Ben & Daniel 7. Canopy Workplace 537 50 - Sharon & William 6.
7
The Chartered Bank
8
CHARTERED BANK, BEP, 1964. PHOTO NAWAB SINGH
9
CHARTERED BANK, BEP, 1964. PHOTO SUDHA KANDEL
10
WEEK 06 - SITE VISIT
CHARTERED BANK, BEP, 1964. PHOTO DESMOND LI
11
Site Visit - Climactic Data: 1.
Time
9:29am
2.
Lux
3700 x 100
3.
Temperature
28.7 °
4.
Noise
65.9dbA
5.
Wind Speed
0.4mps
5.
Windhill
27.4 C
6.
Comfort Index
38.2 °
7.
Delta
2.9
8.
Temperature
28.7 °
9.
Dewpoint
23.8 °
10.
Humidity
79.6%
10.
Humidity
79.6%
11.
Wet Bulb
24.6 C
CHARTERED BANK, BEP, 1964. PHOTO NICK MCDONALD
12
WEEK 06 - SITE VISIT
13
INTRODUCTION
14
Equatorial Campus Equatorial Campus reimagines the former Chartered Bank building in central Kuala Lumpur as a climate-responsive university campus, demonstrating how adaptive reuse can reduce carbon emissions while supporting future educational needs. Developed within the Hot Air Studio, the project investigates architecture in the equatorial tropics through passive environmental design, hybrid cooling, and material reuse. The proposal retains the existing concrete structure and introduces a lightweight extension wrapped in an operable engineered bamboo façade that responds to sun, rain, and ventilation requirements. By combining adaptive reuse, low-carbon materials, renewable energy generation, and mixed-mode environmental systems, the project explores pathways toward a low-carbon urban future for Kuala Lumpur. Total Studio Hours Spent: 965.75 hours Total Studio Cost: $891
Adaptive Re-Use & Decarbonisation Embodied Carbon/sqm Operational Carbon EUI (kgCO₂e/m²) (kWh/m²/yr) 1. Chartered Bank 1031 164 2. Proposed Extension 414 45 Nawab Singh & Sudha Kandel
15
EQUATORIAL CAMPUS CARBON REPORT: 2, Jln Ampang, City Centre, 50100 Kuala Lumpur, Wilayah Persekutuan Kuala Lumpur, Malaysia Architect: BEP Year: 1964 Total Embodied Carbon (kgCO2e):
12,507,400.11
Embodied Carbon Emissions/sqm (kgCO2e/m²):
413.92
Material
Embodied Carbon Carbon Intensity Total (kgCO₂e) (kgCO₂e/m²) (%)
Rebar (10%) 8,067,430.56 614.80 64.50% Demolition 2,141,449.43 694.63 17.12% Aluminium 685,085.85 52.21 5.48 Concrete 682,761.41 52.03 5.46% Bricks 373,895.28 28.49 2.99% GFRC Planters 153,210.00 11.68 1.22% Glass 136,731.50 10.42 1.09% PV 87,200.00 6.64 0.70% Steel 79,005.07 6.02 0.63% CLT Beams 57,035.00 4.35 0.46% Eng-Bamboo 43,596.00 3.32 0.35% Annual Operational Carbon - Post Pv Offset (kgCO2e/yr): Gross Floor Area Operational EUI (m²) (kWh/m²/yr)
110,000
Average Malaysia Grid Emission Factor (kgCO2e/kWh)
30,217 45 0.48 Embodied Carbon Savings
- Adaptive reuse will produce 33.56% of the carbon that Full Demolition and reconstruction of the building would emit with the SAME GFA. New Demolition will produce 2.98 times the amount of carbon emitted from Adaptive Reuse with the SAME GFA.
Operational Carbon Savings - The existing Chartered Bank building (20,178 m²) produced approximately 1,871,000 kgCO₂e annually, while the proposed adaptive reuse and extension scheme, including PV offset, produces only 110,000 kgCO₂e annually, resulting in a 94.1% reduction in operational carbon emissions and a significant improvement in overall building performance. Nawab Singh & Sudha Kandel 4001 4001
16
WEEK 14 - FINAL REPORT
17
18
WEEK 14 - FINAL MODEL
19
20
WEEK 14 - FINAL MODEL - EVENING ATMOSPHERE
21
22
WEEK 14 - FINAL MODEL - GF ATMOSPHERE
23
24
WEEK 14 - FINAL MODEL - PODIUM ATMOSPHERE
25
26
WEEK 14 - FINAL MODEL - PODIUM ATMOSPHERE
27
28
WEEK 14 - FINAL MODEL
29
30 DRAWING BY NAWAB SINGH
WEEK 14 - FINAL DRAWINGS
31 DRAWING BY NAWAB SINGH
32 DRAWING BY SUDHA KANDEL
WEEK 14 - FINAL DRAWINGS
33 DRAWING BY SUDHA KANDEL
PROCESS WORK
34
WEEK 14 - SOLAR ANALYSIS
35 DRAWING BY NAWAB SINGH
36
WEEK 10 - STRUCTURE / COLOUR / ENVELOPE
37
38
WEEK 09 - STRUCTURE / COLOUR / ENVELOPE
39
40
WEEK 09 - STRUCTURE / COLOUR / ENVELOPE
41
42
WEEK 08 - STRUCTURE
43
44
WEEK 05 - MASSING
45
46 DRAWING BY NAWAB SINGH
WEEK 12
47 DRAWING BY NAWAB SINGH
48 DRAWING BY SUDHA KANDEL
WEEK 12
49 DRAWING BY SUDHA KANDEL
50 DRAWING BY NAWAB SINGH
WEEK 11
51 DRAWING BY NAWAB SINGH
52 DRAWING BY SUDHA KANDEL
WEEK 11
53 DRAWING BY SUDHA KANDEL
WEEK 12 CARBON REPORT EMBODIED CARBON: PARAMETERS GFA of Building to be rennovated 20178 (BEFORE) CARBON FOR PARTIAL DEMOLISHING BUILDING (MATERIALS) Materials DISPOSED
Volume (m³)
Density (kg/m³)
Mass (kg)
Transport
Concrete 1187.92 2400.00 Rebar (4%) 47.52 7850.00 Bricks 901.60 1650.00 Steel 0.00 7850.00 Aluminum 0.00 2700.00 Glass 0.00 2500.00 Timber 0.00 620.00 ENERGY USED TO PARTIALLY DEMOLISH BUILDING Carbon Emission Carbon Emission for Demo Items Used kgCO2e/m2 building 16.76
Excavator
3083
GFA of destroyed (m2)
2851008.00 373006.88 1487640.00 0.00 0.00 0.00 0.00
Volume (m³)
Density (kg/m³)
2842.77
Low-Carbon Concrete Rebar (10%) Bricks Steel Aluminum Glass Cross Laminated Timber Beams Mass Engineered Bamboo Facade GFRC Planters CARBON FOR PV PANELS
Energy used for PV manufacturing
Energy Used per Unit (kWh)
2180
TOTALS Type of Carbon Embodied carbon of REPLACEMENT Carbon Emission from Partial Demolition
kgCO2eq
Carbon for Adaptive Reuse Carbon for New Demo (For comparison of SAME GFA) CARBON SAVINGS Carbon Savings Adaptive reuse will produce New Demolition will produce
370631.04 1077989.88 357033.60 0.00 0.00 0.00 0.00
grey carbon (phase A)
m2 embodied carbon
1890680.08
613.29
10501500.78
347.54
32548905.95
1280.93
6449250.16 373895.28 79005.07 685085.85 136731.50 30217 m2 57035.00 43596.00 0.48 153210.00
Carbon per m2 (kgCO2eq/m2)
120.22 349.67 115.81 0.00 0.00 0.00 0.00
Carbon per m2 (kgCO2eq/m2) 41.59 491.48 28.49 6.02 52.21 10.42 4.35 3.32 11.68
Carbon (kgCO2eq) 1891 tCO2eq/a
63 kgCO2eq/m2
operational carbon (phase 8720.00 B6) 10.00
kgCO2eq/m2 656.21
Carbon (kgCO2eq)
Sudha & Nawab Name Project 0.08 Chartered Bank 545811.84
Carbon Emission per kWh Totalcarbon Energywith used (kWh) total embodied PV (kgCO2eq)
8610820.70
87200.00
mixed mode/circulation hybrid cooling AC Check!
100%
mixed mode/circulation % of building hybrid cooling demolished AC
16282 m2 11503 m2 1728 m2
mixed mode/circulation hybrid cooling
25 kWh/m2a 66 kWh/m2a
mixed mode/circulation hybrid cooling AC
195386 kgCO2eq/a 364421 kgCO2eq/a 156803 kgCO2eq/a
m2 carbon emissions
717 tCO2eq/a 24 kgCO2eq/m2a
56% 38% 6%
15.3%
AC 189 kWh/m2a 22047405.17 729.64 32.26% of the carbon that Full Demolition and reconstruction of the building would SAME GFA EUIemit with the50 kWh/m2a 3.10 times the amount of carbon emitted from Adaptive Reuse with the SAME GFA
total carbon emissions PV OFFSET CALCULATIONS:
Name Student Name Project
floor area grid emission factor
1891 tCO2eq/a
63 kgCO2eq/m2
mixed mode/circulation hybrid cooling AC Check!
100%
mixed mode/circulation hybrid cooling AC
16282 m2 11503 m2 1728 m2
mixed mode/circulation hybrid cooling AC EUI
25 kWh/m2a 66 kWh/m2a 189 kWh/m2a 50 kWh/m2a
mixed mode/circulation hybrid cooling AC
195386 kgCO2eq/a 364421 kgCO2eq/a 156803 kgCO2eq/a
total carbon emissions m2 carbon emissions
717 tCO2eq/a 24 kgCO2eq/m2a
56% 38% 6%
PV offset 2835 m2
total PV emissions production
736 tCO2eq
total PV production per year (400 kWh/m2) grid savings per year
1133944 kWh/a -544 tCO2eq/a
overview year
2025 2026
2835 m2 736 tCO2eq
total PV production per year (400 kWh/m2) grid savings per year
1133944 kWh/a -544 tCO2eq/a
Chartered Bank 2627 tCO2eq 2799 tCO2eq
Emmisions Post Offset 172 tCO2eq/a
overview year
0.48
operational carbon (phase B6)
PV area
PV area total PV emissions production
30217 m2
grey carbon (phase A) total embodied carbon with PV m2 embodied carbon
PV offset
Sudha & Nawab Chartered Bank
general data
0 1
Embodied Carbon Name Student Factor (kgCO2eq/kg)
6822648.00 2231574.45 2.89 1557897.00 0.24 20205.90 3.91 41445.00 16.53 112075.00 general data 1.22 228140.00 floor area 0.25 145320.00 0.30 grid emission factor 510700.00 0.30
4.00
OPERATIONAL CARBON / EUI:
54
Mass (kg)
2400.00 7850.00 1650.00 7850.00 2700.00 2500.00 500.00 700.00 2000.00
284.28 944.18 2.57 15.35 44.83 456.28 207.60 255.35 Number of Panels
Carbon (kgCO2eq)
51668.90
Transport to Landfil 10.82 33356.65 EMBODIED CARBON OF REPLACEMENT (If any) - Partial Structure + Reinforcement (If any) Materials USED to replace
13122
GFA of Replacement
Embodied Carbon Factor (kgCO2eq/kg) 0.13 2.89 0.24 3.91 16.53 1.22 0.53
0 1 2 3 4 5 6 7 8 9 10 11 12 13 14 15 16 17 18 19 20 21 22 23 24 25 26 Emmisions Post Offset 27 172 tCO2eq/a 28 29 30 31 32 33
Chartered Bank 2025 2627 tCO2eq 2026 2799 tCO2eq 2027 2971 tCO2eq 2028 3144 tCO2eq 2029 3316 tCO2eq 2030 3488 tCO2eq 2031 3661 tCO2eq 2032 3833 tCO2eq 2033 4005 tCO2eq 2034 4177 tCO2eq 2035 4350 tCO2eq 2036 4522 tCO2eq 2037 4694 tCO2eq 2038 4867 tCO2eq 2039 5039 tCO2eq 2040 5211 tCO2eq 2041 5384 tCO2eq 2042 5556 tCO2eq 2043 5728 tCO2eq 2044 5901 tCO2eq 2045 6073 tCO2eq 2046 6245 tCO2eq 2047 6418 tCO2eq Embodied Carbon: 2048 6590 tCO2eq 2049 6762 tCO2eq Operational Carbon: 2050 7502 tCO2eq 2051 7674 tCO2eq 2052 7846 tCO2eq 2053 8019 tCO2eq 2054 8191 tCO2eq 2055 8363 tCO2eq 2056 8536 tCO2eq 2057 8708 tCO2eq 2058 8880 tCO2eq
348 CO2eq/m2 50 kWh/m²a
WEEK 13 FINAL CARBON REPORT EMBODIED CARBON: PARAMETERS GFA of Building to be rennovated 20178 (BEFORE) CARBON FOR PARTIAL DEMOLISHING BUILDING (MATERIALS) Materials DISPOSED
Volume (m³)
Density (kg/m³)
Mass (kg)
Transport
Concrete 1187.92 2400.00 Rebar (4%) 47.52 7850.00 Bricks 901.60 1650.00 Steel 0.00 7850.00 Aluminum 3.99 2700.00 Glass 23.83 2500.00 Timber 0.00 620.00 ENERGY USED TO PARTIALLY DEMOLISH BUILDING Carbon Emission Carbon Emission for Demo Items Used kgCO2e/m2 building 16.76
Excavator
3083
GFA of destroyed (m2)
2851008.00 373006.88 1487640.00 0.00 10773.00 59583.33 0.00
Volume (m³)
Density (kg/m³)
3556.05
Low-Carbon Concrete Rebar (10%) Bricks Steel Aluminum Glass Cross Laminated Timber Beams Engineered Bamboo Facade GFRC Planters CARBON FOR PV PANELS
Energy used for PV manufacturing
Energy Used per Unit (kWh)
2180
TOTALS Type of Carbon Embodied carbon of REPLACEMENT Carbon Emission from Partial Demolition
kgCO2eq
Carbon for Adaptive Reuse Carbon for New Demo (For comparison of SAME GFA) CARBON SAVINGS Carbon Savings Adaptive reuse will produce New Demolition will produce
8534517.60 2791498.47 1557897.00 20205.90 41445.00 112075.00 228140.00 145320.00 510700.00
370631.04 1077989.88 357033.60 0.00 178077.69 72691.67 0.00
2.89 0.24 3.91 16.53 general data 1.22 floor area 0.25 0.30 grid emission factor 0.30
grey carbon (phase A)
m2 embodied carbon
Carbon per m2 (kgCO2eq/m2)
120.22 349.67 115.81 0.00 57.76 23.58 0.00
789.96
2141449.43
694.63
12507400.11
413.92
37263430.15
1444.78
Carbon per m2 (kgCO2eq/m2)
8067430.56 373895.28 79005.07 685085.85 136731.50 57035.00 30217 m2 43596.00 0.48 153210.00
52.03 614.80 28.49 6.02 52.21 10.42 4.35 3.32 11.68
Carbon (kgCO2eq) 1891 tCO2eq/a
63 kgCO2eq/m2
10.00 operational carbon (phase8720.00 B6)
kgCO2eq/m2
10365950.67
Carbon (kgCO2eq)
Sudha & Nawab Name Project 0.08 Chartered Bank 682761.41
Carbon Emission per kWh Total carbon Energywith usedPV (kWh) total embodied (kgCO2eq)
4.00
87200.00
mixed mode/circulation hybrid cooling AC Check!
67.60% 27% 5.80%
mixed mode/circulation % of building hybrid cooling demolished AC
20573 m2 7915 m2 1728 m2
mixed mode/circulation hybrid cooling
25 kWh/m2a 66 kWh/m2a
mixed mode/circulation hybrid cooling AC
246879 kgCO2eq/a 250759 kgCO2eq/a 156803 kgCO2eq/a
m2 carbon emissions
654 tCO2eq/a 22 kgCO2eq/m2a
100% 15.3%
24756030.04 819.27 AC 189 kWh/m2a 33.56% of the carbon that Full Demolition and reconstruction of the building would SAME GFA EUIemit with the45 kWh/m2a 2.98 times the amount of carbon emitted from Adaptive Reuse with the SAME GFA
OPERATIONAL CARBON / EUI:
PV OFFSET CALCULATIONS: total carbon emissions
Name Student Name Project
floor area grid emission factor
30217 m2
0.48
grey carbon (phase A) total embodied carbon with PV m2 embodied carbon
1891 tCO2eq/a
63 kgCO2eq/m2
operational carbon (phase B6) mixed mode/circulation hybrid cooling AC Check!
67.60% 27% 5.80%
mixed mode/circulation hybrid cooling AC
20573 m2 7915 m2 1728 m2
mixed mode/circulation hybrid cooling AC EUI
25 kWh/m2a 66 kWh/m2a 189 kWh/m2a 45 kWh/m2a
mixed mode/circulation hybrid cooling AC
246879 kgCO2eq/a 250759 kgCO2eq/a 156803 kgCO2eq/a
total carbon emissions m2 carbon emissions
654 tCO2eq/a 22 kgCO2eq/m2a
100%
PV offset PV area
2835 m2
total PV emissions production
736 tCO2eq
total PV production per year (400 kWh/m2) grid savings per year
1133942 kWh/a -544 tCO2eq/a
overview year
2025
PV offset
Sudha & Nawab Chartered Bank
general data
0
Embodied Carbon Name Student Factor (kgCO2eq/kg)
Mass (kg)
2400.00 7850.00 1650.00 7850.00 2700.00 2500.00 500.00 700.00 2000.00
355.60 944.18 2.57 15.35 44.83 456.28 207.60 255.35 Number of Panels
Carbon (kgCO2eq)
51668.90
Transport to Landfil 10.82 33356.65 EMBODIED CARBON OF REPLACEMENT (If any) - Partial Structure + Reinforcement (If any) Materials USED to replace
13122
GFA of Replacement
Embodied Carbon Factor (kgCO2eq/kg) 0.13 2.89 0.24 3.91 16.53 1.22 0.53
Chartered Bank 2627 tCO2eq
PV area
2835 m2
total PV emissions production
736 tCO2eq
total PV production per year (400 kWh/m2) grid savings per year
1133942 kWh/a -544 tCO2eq/a
Emmisions Post Offset 110 tCO2eq/a
overview year
WEEK 12 TO WEEK 13 - REFINEMENTS / LEARNINGS Chartered Bank
2025 beams to 2627 - 0Added the piles, pile caps and ground thetCO2eq carbon calculation, increasing 1 2026 2737 tCO2eq embodied carbon from 348 to 414 an increase of approximately 66 or 19%. 2 2027 2847 tCO2eq - 3This again highlighted the significant carbon impact of structural and 2028embodied2957 tCO2eq 4 2029 3067 tCO2eq foundation systems. 2030 we assumed 3177 tCO2eq - 5For the lighter seven-storey extension, 25 m piles, compared with the 40 6 2031 3287 tCO2eq m7 piles used for the existing 15-storey Chartered Bank. 2032 3398 tCO2eq - 8Used shorter 10 m piles beneath columns supporting only the podium, reducing 2033 3508 tCO2eq 9 3618 tCO2eq unnecessary foundation depth and 2034 associated carbon. 2035 3728 tCO2eq -10 Further refined the environmental zoning by reducing hybrid-cooled space from 38% 11 2036 3838 tCO2eq to 27.4% and air-conditioned space from 6% to 5%.tCO2eq 12 2037 3948 203850 to 45 4059 tCO2eq -13These changes reduced the EUI from kWh/m²/year and lowered emissions 14 2039 4169 tCO2eq after the PV offset from 172 to 110 tCO₂e/year. 15 2040 4279 tCO2eq -16Although net zero was not achieved, the proposal reduced gross operational 2041 4389 tCO2eq emissions from approximately 11,526 17 2042to 654, representing 4499 tCO2eq a reduction of about 94% 18 2043 Bank. After 4609the tCO2eq compared with the existing Chartered PV offset, only 110 tCO₂e/year.
19 20 21 22 23 24 25 Emmisions Post Offset 26 110 tCO2eq/a 27 28 29 30 31 32
2044 4719 tCO2eq 2045 4830 tCO2eq 2046 4940 tCO2eq 2047 Carbon: 5050 tCO2eq Embodied 2048 5160 tCO2eq Operational Carbon: 2049 5270 tCO2eq 2050 5948 tCO2eq 2051 6058 tCO2eq 2052 6168 tCO2eq 2053 6278 tCO2eq 2054 6388 tCO2eq 2055 6498 tCO2eq 2056 6608 tCO2eq 2057 6719 tCO2eq
414 CO2eq/m2 45 kWh/m²a
55
INTRODUCTION
56
Equatorial School of Architecture Equatorial School of Architecture reimagines the Chartered Bank building completed in 1964 in Kuala Lumpur, Malaysia as a climate-responsive university campus, focusing on creating flexible learning spaces and workshops for architecture and design faculty. The adaptive reuse project retained the existing strcuture of the Chartered Bank with a light-touch approach with selective removal of floor plates to create vertical connection, introducing mixed-mode and hybrid ventilation strategies that reduce the operational energy of the building. The extension building features deep veils and elevation combined with a performative building facade system that together recalibrate the Chartered Bank to a contemporary equatorial campus that respond directly to the tropical climate in Kuala Lumpur.
Adaptive Re-Use & Decarbonisation Embodied Carbon/sqm Operational Carbon EUI (kgCO₂e/m²) (kWh/m²/yr) 1. Chartered Bank 1031 164 2. Proposed Extension 146 60
Desmond Li & Nick McDonald & Tanner Wang
57
EQUATORIAL CAMPUS CARBON REPORT: 2, Jln Ampang, City Centre, 50100 Kuala Lumpur, Wilayah Persekutuan Kuala Lumpur, Malaysia Architect: BEP Year: 1964 Total Embodied Carbon for Adaptive Reuse (kgCO2e): Embodied Carbon for Adaptive Reuse (kgCO2e/m²):
3,129,334 146.84
Total Embodied Carbon for Extension (kgCO2e): Embodied Carbon for Extension (kgCO2e/m²):
2,800,013.27 390.35
Material
Embodied Carbon Carbon Intensity Total (kgCO₂e) (kgCO₂e/m²) (%)
Concrete 815,951.35 113.75 29.44% Rebar (3.3%) 1,185,581.23 165.28 42.77% Bricks 0.00 0.00 0.00% Steel 293,715.36 40.95 10.60% Aluminium 357,659.08 49.86 12.90% Glass 78,916.17 11.00 2.85% Timber 40,030.08 5.58 1.44% Annual Operational Carbon - Post Pv Offset (kgCO2e/yr): Gross Floor Area Operational EUI (m²) (kWh/m²/yr)
612,000
Average Malaysia Grid Emission Factor (kgCO2e/kWh)
21,312 60 0.48 Embodied Carbon Savings
- Adaptive reuse will produce 7.24% of the carbon that Full Demolition and reconstruction of the building would emit with the SAME GFA. New Demolition will produce 13.81 times the amount of carbon emitted from Adaptive Reuse with the SAME GFA.
Operational Carbon Savings - The existing Chartered Bank building (20,178 m²) produced approximately 1,871,000 kgCO₂e annually, while the proposed adaptive reuse and extension scheme, including PV offset, produces only 612,000 kgCO₂e annually, resulting in a 67.3% reduction in operational carbon emissions and a significant improvement in overall building performance. Desmond Li & Nick McDonald & Tanner Wang 5002 4001 5001
58
WEEK 14 - FINAL REPORT
59
Final Model of Chartered Bank Adaptive Reuse. Photo: Desmond Li
60
WEEK 14 - FINAL MODEL
61
62
WEEK 14 - FINAL MODEL
63
64
WEEK 14 - FINAL MODEL
65
66
WEEK 14 - FINAL MODEL
67
68 BANK BUILDING (BEP,1964) CHARTERED OVERALL SITE AXONOMETRIC
0
3
6
9
12
Embodied Carbon of Extension: 390.35 kgCO2eq/m2 Embodied Carbon of Adaptive Reuse: 146.84 kgCO2eq/m2 Energy Use Intensity (EUI): 60 kWh/m2
15m
WEEK 14 - FINAL DRAWINGS
69
CHARTERED BANK ADAPTIVE REUSE - BEFORE
70
HOT AIR ANALYSIS - BEFORE
OUTSIDE AIR AIR CONDITIONED HYBRID AIR
71
CHARTERED BANK ADAPTIVE REUSE - AFTER
72
HOT AIRE ANALYSIS - AFTER
OUTSIDE AIR AIR CONDITIONED HYBRID AIR
73
74
CHARTERED BANK - EXTENSION
75
76
HOT AIR ANALYSIS - EXTENSION
OUTSIDE AIR AIR CONDITIONED HYBRID AIR
77
78 BANK BUILDING (BEP,1964) CHARTERED SECTIONAL AXONOMETRIC - CHARTERED BANK
0
3
6
9
12
Embodied Carbon of Extension: 390.35 kgCO2eq/m2 Embodied Carbon of Adaptive Reuse: 146.84 kgCO2eq/m2 Energy Use Intensity (EUI): 60 kWh/m2
15m
WEEK 14 - FINAL DRAWINGS
CHARTERED BANK BUILDING (BEP,1964) SECTIONAL AXONOMETRIC - EXTENSION
0
3
6
9
7912
Embodied Carbon of Extension: 390.35 kgCO2eq/m2 Embodied Carbon of Adaptive Reuse: 146.84 kgCO2eq/m2 Energy Use Intensity (EUI): 60 kWh/m2
15m
OUTSIDE AIR AIR CONDITIONED HYBRID AIR
80 BANK BUILDING (BEP,1964) CHARTERED SECTIONAL AXONOMETRIC - CHARTERED BANK
0
5
10
15
20
Embodied Carbon of Extension: 390.35 kgCO2eq/m2 Embodied Carbon of Adaptive Reuse: 146.84 kgCO2eq/m2 Energy Use Intensity (EUI): 60 kWh/m2
25m
OUTSIDE AIR AIR CONDITIONED HYBRID AIR
CHARTERED BANK BUILDING (BEP,1964) SECTIONAL AXONOMETRIC - CHARTERED BANK
0
5
10
15
20 81
Embodied Carbon of Extension: 390.35 kgCO2eq/m2 Embodied Carbon of Adaptive Reuse: 146.84 kgCO2eq/m2 Energy Use Intensity (EUI): 60 kWh/m2
25m
PROCESS WORK
82
WEEK 12
CHARTERED BANK BUILDING (BEP,1964) SECTIONAL AXONOMETRIC - EXTENSION
0
3
6
9
12
15m
Embodied Carbon: 238.48 kgCO2eq/m2 Energy Use Intensity (EUI): 60 kWh/m2
83
84
WEEK 10 - STRUCTURE / COLOUR / ENVELOPE
85
86
WEEK 09 - STRUCTURE / COLOUR / ENVELOPE
87
88
WEEK 09 - FORM AND ENVELOPE EXPLORATION
89
90
WEEK 05 - FORM EXPLORATION
91
Week 14 Carbon Report EMBODIED CARBON: PARAMETERS
GFA of Building to be 14569 rennovated (BEFORE) CARBON FOR PARTIAL DEMOLISHING BUILDING (MATERIALS)
430
GFA of destroyed (m2)
GFA of Replacement
New GFA of Renovated building
7173
Concrete
91.24
2400.00
218972.15
Embodied Carbon Factor (kgCO2eq/kg) 0.13
Rebar (4%) Bricks Steel Aluminum Glass
3.65
7850.00 1650.00 7850.00 2700.00 2500.00
28648.86 0.00 0.00 0.00 178737.00
2.89 0.24 3.91 16.53 1.22
82795.20 0.00 0.00 0.00 218059.14
192.37 0.00 0.00 0.00 506.64
620.00
0.00
0.53
0.00
0.00
Materials DISPOSED
Volume (m³)
Density (kg/m³)
0.00 0.00 0.00 71.49 0.00
Transport
Timber ENERGY USED TO PARTIALLY DEMOLISH BUILDING Carbon Emission Items Used kgCO2e/m2
Carbon (kgCO2eq) 28466.38
Carbon per m2 (kgCO2eq/m2)
66.14
Carbon Emission for Demo building
0.00
Excavator
Mass (kg)
0.00
Transport to Landfil 0.00 0.00 EMBODIED CARBON OF REPLACEMENT (If any) - Partial Structure + Reinforcement (If any) Materials USED to replace
Volume (m³)
Density (kg/m³)
Embodied Carbon Factor (kgCO2eq/kg)
Mass (kg)
Carbon (kgCO2eq)
Carbon per m2 (kgCO2eq/m2)
2615.23
2400.00
6276548.82
0.13
815951.35
113.75
Rebar (3.3%)
86.30
7850.00
677474.99
1.75
1185581.23
165.28
Bricks Steel Aluminum Glass
0.00
1650.00 7850.00 2700.00 2500.00
0.00 391620.49 132466.33 64685.39
0.24 0.75 2.70 1.22
0.00 293715.36 357659.08 78916.17
0.00 40.95 49.86 11.00
500.00
160120.33
0.25
40030.08
5.58
Carbon Emission per kWh (kgCO2eq)
Total Energy used (kWh)
10.00
2816.00
Concrete (adjusted hollow)
49.89 49.06 25.87 320.24
Timber CARBON FOR PV PANELS
Number of Panels Energy used for PV manufacturing TOTALS Type of Carbon Embodied carbon of REPLACEMENT Carbon Emission from Partial Demolition
Energy Used per Unit (kWh)
704 kgCO2eq
Carbon for Adaptive Reuse Carbon for New Demo (For comparison of SAME GFA) CARBON SAVINGS Carbon Savings Adaptive reuse will produce New Demolition will produce
4.00
2800013.27
390.35
329320.72
765.15
3129333.99
146.84
43203373.52
2278.03
% of building demolished
3.0%
TOTALS 40074039.53 1880.39 7.24% of the carbon that Full Demolition and reconstruction of the building would emit with the SAME GFA 13.81 times the amount of carbon emitted from Adaptive Reuse with the SAME GFA
Name Student Name Project
Nick, Des,Tanner Chartered Bank
general data floor area grid emission factor
21312 m2
0.48
grey carbon (phase A) total embodied carbon with PV m2 embodied carbon
3129 tCO2eq/a
147 kgCO2eq/m2
operational carbon (phase B6) mixed mode/circulation hybrid cooling AC Check!
100%
mixed mode/circulation hybrid cooling AC
12787 m2 5328 m2 3197 m2
mixed mode/circulation hybrid cooling AC EUI
25 kWh/m2a 66 kWh/m2a 189 kWh/m2a 60 kWh/m2a
mixed mode/circulation hybrid cooling AC
153444 kgCO2eq/a 168788 kgCO2eq/a 290008 kgCO2eq/a
total carbon emissions m2 carbon emissions
612 tCO2eq/a 29 kgCO2eq/m2a
60% 25% 15%
PV offset PV area
1550 m2
total PV emissions production
402 tCO2eq
total PV production per year (330 kWh/m2) grid savings per year
511500 kWh/a -246 tCO2eq/a
overview year
0 1 2 3
28160.00
kgCO2eq/m2
OPERATIONAL CARBON / EUI:
92
Carbon (kgCO2eq)
2025 2026 2027 2028
Chartered Bank 3532 tCO2eq 3898 tCO2eq 4265 tCO2eq 4632 tCO2eq
Concrete
Steel
CLT
Total
237 kgCO2/m2
238 kgCO2/m2
103 kgCO2/m2
*recycled steel
98 kgCO2/m2 *without carbon sequestration
66 kgCO2/m2 *without carbon sequestration
Embodied Carbon Study prepred by Nick McDonald
Embodied Carbon and Design Strategy One of the important process during the design of the extension building is to re-evaluate the design decisions in relation to different structural systems and material combinations. The comparative embodied carbon study explores the carbon intensity of concrete, steel, and CLT, to understand the impact of each design options. Through the comparative study, we have decided to propose a hybrid construction system using precast hollow core concrete, recycled steel, and CLT to achieve a lower embodied carbon.
93
INTRODUCTION
94
Timber Confluence Timber Confluence transforms the former Chartered Bank building (Booty, Edwards & Partners, 1964) in central Kuala Lumpur into a low-carbon university campus, demonstrating how the adaptive reuse of a post-Merdeka modernist landmark can cut embodied carbon while making room for future learning. Developed within the Hot Air Studio, the project investigates architecture in the equatorial tropics through passive environmental design, mixed-mode cooling, and material reuse. The proposal retains the existing concrete post-and-beam frame and carves a light-and-ventilation well into the deep east floor plate, setting a new engineered mass-timber tower back from the bank so old and new share a sheltered, daylit court. Salvaged brick, a landscaped podium park, distributed photovoltaics, geothermal ground loops, and jet-fan-assisted natural ventilation work together to lower operational demand. By pairing structural retention with low-carbon timber, renewable energy generation, and mixed-mode environmental systems, the campus emits roughly a fifth of the carbon of an equivalent new build — charting a pathway toward a low-carbon urban future for Kuala Lumpur.
Adaptive Re-Use & Decarbonisation Embodied Carbon/sqm Operational Carbon EUI (kgCO₂e/m²) (kWh/m²/yr) 1. Chartered Bank 1031 164 2. Proposed Extension 188 34 Robert Guzman
95
WINTER SOLSTICE
SUMMER SOLSTICE
N
s
E
HOT-AIR UNIVERSITY CAMPUS - ADAPTIVE REUSE ROB
96
20 hrs
0
10
20
30
40m
Embodied Carbon: Operational Carbon:
188 kgCO2eq/m2 34 kWh/m2a
FUTURE CAMPUS METABOLISM
Prevailing West Winds
Natural Ventilation
South Winds
Westerly Shading
Public Access Ramp Community Park
Vehicle Access
PROJECT STAKEHOLDERS •
Monash University property management and resident faculties
•
Architect, Builder, Trade Services, Material Suppliers (concrete, steel, mass timber, glass, PV panels, fittings, office supplies, etc.)
•
Students
•
Neighbouring community
HOT-AIR UNIVERSITY CAMPUS - ADAPTIVE REUSE ROB
10 hrs
0
10
20
30
40m
Embodied Carbon: Operational Carbon:
188 kgCO2eq/m2 34 kWh/m2a
97
HOT-AIR UNIVERSITY CAMPUS - ADAPTIVE REUSE ROB
98
20 hrs
0
8
16
24
36 m
Embodied Carbon: Operational Carbon:
188 kgCO2eq/m2 34 kWh/m2a
Horizontal Jet Fans <1.5 m/s automatic variable speed control 45o Timber Slat Ventilation Band
Bauhaus-Style Black Steel Mullion Curtain Wall
Rendered Brick Base Wall
Fabric Air Conditioning Duct Diffusers ~1m/s
TEMPERATURE 35oC ~ 80% Humidity
25oC ~ 60% Humidity
HOT-AIR UNIVERSITY CAMPUS - ADAPTIVE REUSE ROB
40 hrs Total
Embodied Carbon: Operational Carbon:
188 kgCO2eq/m2 34 kWh/m2a
99
HOT-AIR UNIVERSITY CAMPUS - ADAPTIVE REUSE ROB
100
20 hrs
0
8
16
24
36 m
Embodied Carbon: Operational Carbon:
188 kgCO2eq/m2 34 kWh/m2a
101
SITE ANALYSIS (CONT.)
URBAN CONTEXT URBAN SETTLEMENT ORIGINS (Gullick, 242) It is not exactly known how the Chinese adopted names for the main streets of Kuala Lumpur. But, after 1880, the Europeans used names such as ‘Ampang Road’ to accord for the direction of the road out of town towards outlying mining villages of the same name. (Gullick, 248) In 1913, there were no buildings on the riverside of Ampang Road, until beyond Treacher Rd. The whole area was unoccupied, without roads and covered in rubber trees. ECOLOGY Being next to Kalang River, the underlying soil is muddy and silty. Although, the modern concrete and asphalt landscape that predominates the immediate area reduces the capacity for the environment to support natural levels of biodiversity in a sustainable manner. The closest community park is the Kuala Lumpur Eco Park, which is approximately 400m north-east of the building. There are several mature, what appear to be, Rain Tree’s (Samanea saman), also commonly known as Pokok Hujan in Malay, along Jalan Ampang and Melaka. BUILDING DESIGN LANGUAGE Designed by Booty, Edwards & Partners (BEP) and opened in 1964, the Chartered Bank building was a clean expression of post-Merdeka tropical modernism. A central lift core organised a tower block above a wider podium that housed the double-volume banking hall. The side elevations were structured by an exposed post-and-beam concrete frame whose cantilevered beams terminated in deliberately expressed ends — a façade strategy that did real climatic work (shading the east and west walls) while reading as a structural statement. The north and south façades, less exposed to direct sun, took on a flatter, more urban character. BUILDING SITE The building is now owned by Wisma Amanah Raya, is unoccupied and currently in negotiation of sale. The plot is approximately 3,900 m2, which includes the two storey brick building extension to the north-east. The topography rises significantly along Jalan Ampang by approximately 6m from the base of Chartered Bank to the north-east end of the brick extension building.
102
CHARTERED BANK
mpang
EXTENSION
ENVIRON. VARIABLES Date Time 14/04/2026 09:29
SUNLIGHT Lux 3700 x 100
WIND Wind Speed (MPS) Windchill (C) 0.3
Conditions Overcast
27.4
Temp 28.7
NOISE Noise (dbA) Street
65.9
TEMPERATURE (C) Temp Comfort IndexDelta 28
38.2
2.9
0
10
20
30
40m
103
104
105
CARBON CALCULATIONS PARAMETERS
GFA of Building to be 20123 rennovated (BEFORE) CARBON FOR PARTIAL DEMOLISHING BUILDING (MATERIALS) Materials DISPOSED
Volume (m³)
Density (kg/m³)
Concrete 1281.00 Rebar (4%) 51.00 Bricks 985.00 Steel 0.00 Aluminum 5.00 Glass 0.00 Timber 0.00 ENERGY USED TO PARTIALLY DEMOLISH BUILDING Carbon Emission kgCO2e/m2
Transport
Items Used
2400.00 7850.00 1650.00 7850.00 2700.00 2500.00 620.00
Mass (kg) 3074400.00 400350.00 1625250.00 0.00 13500.00 0.00 0.00
New GFA of Renovated building
GFA of Replacement 13208
Embodied Carbon Factor (kgCO2eq/kg) 0.13 2.89 0.24 3.91 16.53 1.22 0.53
Carbon (kgCO2eq) 399672.00 1157011.50 390060.00 0.00 223155.00 0.00 0.00
30127
Carbon per m2 (kgCO2eq/m2) 124.74 361.11 121.74 0.00 69.65 0.00 0.00
Carbon Emission for Demo building
16.76
Excavator
3204
GFA of destroyed (m2)
53699.04
Transport to Landfil 10.82 34667.28 EMBODIED CARBON OF REPLACEMENT (If any) - Partial Structure + Reinforcement (If any) Materials USED to replace
Volume (m³)
Density (kg/m³)
Mass (kg)
2035.00 122.10 520.00 10.00 0.00 55.00 6900.00
2400.00 7850.00 1650.00 7850.00 2700.00 2500.00 620.00
4884000.00 958485.00 858000.00 78500.00 0.00 137500.00 4278000.00
Number of Panels
Energy Used per Unit (kWh)
Carbon Emission per kWh (kgCO2eq)
895
4.00
10.00
Concrete Rebar (6%) Bricks Steel Aluminum Glass Mass Timber CARBON FOR PV PANELS
Energy used for PV manufacturing TOTALS Type of Carbon
kgCO2eq
Embodied carbon of REPLACEMENT
Embodied Carbon Factor (kgCO2eq/kg)
Carbon (kgCO2eq)
0.13 2.89 0.24 3.91 16.53 1.22 -0.16
634920.00 2770021.65 205920.00 306935.00 0.00 167750.00 -690000.76
Total Energy used (kWh) 3580.00
Carbon per m2 (kgCO2eq/m2)
Carbon (kgCO2eq) 35800.00
kgCO2eq/m2
3431345.89
259.79
Carbon Emission from Partial Demolition
2258264.82
704.83
Carbon for Adaptive Reuse
5689610.71
188.85
Carbon for New Demo (For comparison of SAME GFA) CARBON SAVINGS Carbon Savings Adaptive reuse will produce New Demolition will
31518826.01
1257.68
25829215.30 857.34 18.05% of the carbon that Full Demolition and reconstruction of the building would emit with the SAME GFA 5.54 times the amount of carbon emitted from Adaptive Reuse with the SAME GFA
Name Student
Robert Guzman
Name Project
Chartered Bank
floor area grid emission factor
30127 m2
0.48
grey carbon (phase A) total embodied carbon with PV m2 embodied carbon
2258 tCO2eq/a
75 kgCO2eq/m2
operational carbon (phase B6) mixed mode/circulation hybrid cooling AC Check!
100%
mixed mode/circulation hybrid cooling AC
26210 m2 3013 m2 904 m2
mixed mode/circulation hybrid cooling AC EUI
25 kWh/m2a 66 kWh/m2a 189 kWh/m2a 34 kWh/m2a
mixed mode/circulation hybrid cooling AC
314526 kgCO2eq/a 95442 kgCO2eq/a 81994 kgCO2eq/a
total carbon emissions m2 carbon emissions
492 tCO2eq/a 16 kgCO2eq/m2a
87% 10% 3%
PV offset PV area
2000 m2
total PV emissions production
519 tCO2eq
total PV production per year (330 kWh/m2) grid savings per year
660000 kWh/a -317 tCO2eq/a
overview year
106
% of building demolished
15.9%
TOTALS
general data
0 1 2 3 4 5 6 7 8 9 10 11 12 13 14 15 16 17 18 19
48.07 209.72 15.59 23.24 0.00 12.70 -52.24
2025 2026 2027 2028 2029 2030 2031 2032 2033 2034 2035 2036 2037 2038 2039 2040 2041 2042 2043 2044
Chartered Bank 2777 tCO2eq 2953 tCO2eq 3128 tCO2eq 3303 tCO2eq 3478 tCO2eq 3653 tCO2eq 3828 tCO2eq 4004 tCO2eq 4179 tCO2eq 4354 tCO2eq 4529 tCO2eq 4704 tCO2eq 4879 tCO2eq 5055 tCO2eq 5230 tCO2eq 5405 tCO2eq 5580 tCO2eq 5755 tCO2eq 5930 tCO2eq 6106 tCO2eq
DISCUSSION: For the “CARBON FOR PARTIAL DEMOLISHING BUILDING (MATERIALS)” section, the main contributor is the concrete removed from the building’s original roof ‘capital’ structure, podium east side facade, and tower floor plate sections for new light well. These parts of the building do not contain significant amounts of glass or aluminum, so these were not considered. Also, the demolition of existing two storey east-side extension is built primarily of brick, so this was considered and foreseen to be re-used as part of the new mass timber building extension envelope. For the “EMBODIED CARBON OF REPLACEMENT” section, the concrete is attributed to the ground floor foundation slab, and podium underside slab holding up the ‘community park’ soil. Foundation pilings were not considered. The bricks are additional to those reused from the demolished two storey east-side extension building. These bricks, plus the steel and glass, are used on the mass timber building envelope. For the negative mass timber “Embodied Carbon Factor (kgCO2eq/kg)” value of 0.1612905, which gives an embodied carbon -690,000 kgCO2eq, is derived from the assumption of EN 16485, ‘End-of-Life’ Module D GWP credits of -100kgCO2eq/m3. For reference, EPD’s from XLam (2026) and NeXTimber (2024) have Module D GWP values of -447 kg CO2eq/ m³ and -248 kg CO2eq/m³ for CLT respectively. Although, further investigation found that European CLT EPD’s (Stora Enso, Binderholz) between −50 to −150 kg CO2eq/m³, for GWP values. PV capacity could be added, by mounting panels on high poles distributed expeditiously throughout the community garden. This additional PV capacity can be used to power a centralised dehumidifier, to improve thermal comfort. 14000 tCO2eq Finally, the 87% mixed mode/circulation assumes Geothermal Heat Exchanger loops are installed into the foundation piles for the new mass timber building extension, and (possibly) 12000 tCO2eq under the adjacent canal using Horizontal Directional Drilling (HDD) technology. For reference, see (Muhammad et al. 2025) https://doi.org/10.37934/arfmts.126.1.156170. 10000 tCO2eq
8000 tCO2eq
6000 tCO2eq
4000 tCO2eq
2000 tCO2eq
INDIVIDUAL PROCESS WORK
107
108
109
Hot Air Transformations
Monash University 110
Erik L’ Heureux