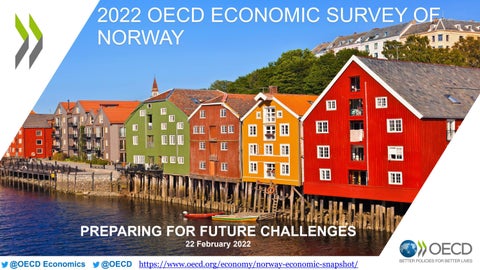
2022 OECD ECONOMIC SURVEY OF NORWAY
PREPARING FOR FUTURE CHALLENGES 22 February 2022
@OECD Economics
@OECD https://www.oecd.org/economy/norway-economic-snapshot/
Most of the population is fully vaccinated against COVID-19 Share of people fully vaccinated against COVID-19, 7-day moving average % 80 Norway
70
European Union
OECD
60 50 40 30 20 10 0 Jan-21
Feb-21
Mar-21
Apr-21
May-21
Jun-21
Jul-21
Aug-21
Sep-21
Oct-21
Nov-21
Dec-21
Jan-22
Feb-22
Mar-22
Source: Our World in Data. 2
The recovery is set to continue Mainland real GDP, index 2019 Q4 = 100, s.a. 110
Pre-crisis growth path
108
December 2021 Economic Outlook
Provisional update
106 104 102 100 98 96 94 92 90
2019
2020
2021
2022
2023
Note: The pre-crisis growth path is based on the November 2019 OECD Economic Outlook projection, with linear extrapolation. Source: OECD Economic Outlook 106 and 110 (databases); and provisional updates.
3
The economic outlook remains solid Annual percentage change
2020
2021
2022
2023
Gross domestic product (mainland)
-2.3
4.2
3.7
2.2
Unemployment rate (%)
4.6
4.3
3.5
3.2
Inflation (CPI)
1.3
3.5
2.5
1.5
Source: OECD Secretariat provisional projection.
4
Inflation has been pushed up by rising energy prices Energy price index, January 2020 = 100 160 Norway
150
Other Nordics
OECD-Europe
140 130 120 110 100 90 80 70
Jan-20
Mar-20
May-20
Jul-20
Sep-20
Nov-20
Jan-21
Mar-21
May-21
Jul-21
Sep-21
Nov-21
Note: OECD-Europe includes OECD countries that are also European countries. Geographic definition of Europe including Turkey. Source: OECD (2022), Main Economic Indicators (database).
5
The 2022 budget deficit will be below target Projection of the structural non-oil deficit, % of trend mainland GDP
12
Fiscal rule
11
10
Estimate
9
8
7
6
2015
2016
2017
2018
2019
2020
2021
2022
2023
2024
2025
Note: The mainland structural deficit refers to the cyclically-adjusted total budget surplus excluding petroleum and oil fund revenues. Fiscal rule refers to the “3 percent path”, which is the guideline spending of 3% of the value of the wealth fund. Source: Ministry of Finance, National Budget 2022.
6
Ensuring fiscal sustainability
7
Public spending remains high % of GDP 70
2020
2019
60 50 40 30 20 10 0
Note: Norway total general government disbursements as % of mainland GDP. Source: OECD (2021), OECD Economic Outlook (database).
8
Ensuring affordable housing
9
House prices have surged Index 2010 = 100, s.a. 240 Oslo
220
Norway
OECD
200 180 160 140 120 100 80 2010
2011
2012
2013
2014
2015
2016
2017
2018
2019
2020
Source: Calculations based on Real Estate Norway (Eiendom Norge) data; OECD (2021), Analytical house prices database.
2021
2022 10
Household debt is elevated Household indebtedness ratio, % of gross disposable income, 2021Q3 or latest 240 210 180 150 120 90 60 30 0
Source: OECD dashboard of household statistics.
11
Household rent costs are significant Median rent burden, % of disposable income, 2019 or latest year available 35 30 25 20 15 10 5 0
Note: Rent burden includes private market and subsidised rents. Source: OECD Affordable Housing database.
12
Property taxes are underutilised Recurrent taxes on immovable property, % of total taxation, 2020 or latest available year % 12 10 8 6 4 2 0
Source: OECD (2021), OECD Revenue Statistics (database).
13
Strengthening productivity and employment
14
Productivity growth is edging up but remains relatively low Output per hour worked, trend % change 3.0 2.5 Norway (Mainland)
OECD
2.0 1.5 1.0 0.5 0.0
2000 2001 2002 2003 2004 2005 2006 2007 2008 2009 2010 2011 2012 2013 2014 2015 2016 2017 2018 2019 2020 2021
Note: Labour productivity for the OECD is measured as output per worker instead of per hour worked. Source: OECD (2021), OECD Economic Outlook (database).
15
Labour force participation has fallen Labour force participation rate, 15-64 years 84 Average of top 5 OECD countries
Norway
83
Average of top 10 OECD countries
82 81 80
Rank: 3
79
78
77 76
Rank: 13
2000
2001
2002
2003
2004
2005
2006
2007
2008
2009
2010
2011
2012
2013
2014
Note: Norway's rank amongst the OECD countries is shown at the beginning and at the end of the period. Source: OECD (2021), Employment and Labour Market Statistics.
2015
2016
2017
2018
2019
2020
16
Moving to a greener economy
17
Renewable energy is significant Renewable energy share, in % of energy supply % 60 Norway
OECD
50
40
30
20
10
0
2000
2001
2002
2003
2004
2005
Source: OECD Environment Statistics database.
2006
2007
2008
2009
2010
2011
2012
2013
2014
2015
2016
2017
2018
2019
2020 18
The emission-reduction challenge is sizeable Greenhouse gas emissions, million tons of CO2-equivalent
MtCO2-equivalent 60
50
Projections under current policies
40
Trajectory to 2030 target
30
Trajectory to 2050 target
20
10
0
1990
1995
2000
2005
2010
2015
2020
2025
2030
2035
2040
2045
2050
Note: Projections under current implemented policies do not include reductions that are intended via participation in the EU-ETS. Norway’s emissions targets are in “gross” terms, meaning notably that the CO2 absorption from forestry is not included. Source: Climate Action Tracker, Country Assessments 2020 - http://climateactiontracker.org.
19
Key messages Maintain a close watch on price and wage inflation Retain a prudent fiscal strategy Address housing market imbalances Strengthen productivity and employment Make green transition happen 20
For more information
https://www.oecd.org/economy/norway-economic-snapshot/ OECD OECD Economics Disclaimer: The statistical data for Israel are supplied by and under the responsibility of the relevant Israeli authorities. The use of such data by the OECD is without prejudice to the status of the Golan Heights, East Jerusalem and Israeli settlements in the West Bank under the terms of international law.
21