159
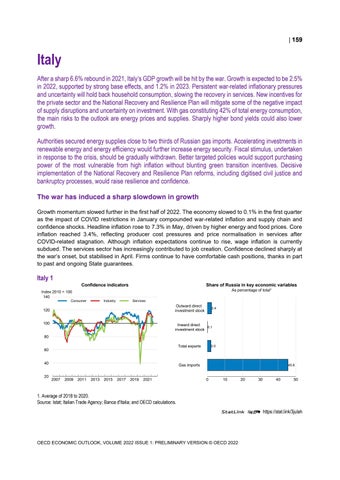
Italy After a sharp 6.6% rebound in 2021, Italy’s GDP growth will be hit by the war. Growth is expected to be 2.5% in 2022, supported by strong base effects, and 1.2% in 2023. Persistent war-related inflationary pressures and uncertainty will hold back household consumption, slowing the recovery in services. New incentives for the private sector and the National Recovery and Resilience Plan will mitigate some of the negative impact of supply disruptions and uncertainty on investment. With gas constituting 42% of total energy consumption, the main risks to the outlook are energy prices and supplies. Sharply higher bond yields could also lower growth. Authorities secured energy supplies close to two thirds of Russian gas imports. Accelerating investments in renewable energy and energy efficiency would further increase energy security. Fiscal stimulus, undertaken in response to the crisis, should be gradually withdrawn. Better targeted policies would support purchasing power of the most vulnerable from high inflation without blunting green transition incentives. Decisive implementation of the National Recovery and Resilience Plan reforms, including digitised civil justice and bankruptcy processes, would raise resilience and confidence. The war has induced a sharp slowdown in growth Growth momentum slowed further in the first half of 2022. The economy slowed to 0.1% in the first quarter as the impact of COVID restrictions in January compounded war-related inflation and supply chain and confidence shocks. Headline inflation rose to 7.3% in May, driven by higher energy and food prices. Core inflation reached 3.4%, reflecting producer cost pressures and price normalisation in services after COVID-related stagnation. Although inflation expectations continue to rise, wage inflation is currently subdued. The services sector has increasingly contributed to job creation. Confidence declined sharply at the war’s onset, but stabilised in April. Firms continue to have comfortable cash positions, thanks in part to past and ongoing State guarantees.
Italy 1 Confidence indicators
Share of Russia in key economic variables As percentage of total¹
Index 2010 = 100 140
Consumer
Industry
Services
Outward direct investment stock
120 100
2.4
Inward direct 0.1 investment stock
80 Total exports
60 40 20
2.0
Gas imports
2007
2009
2011
2013
2015
2017
2019
2021
0
45.6
0
10
20
30
40
50
1. Average of 2018 to 2020. Source: Istat; Italian Trade Agency; Banca d'Italia; and OECD calculations. StatLink 2 https://stat.link/3julah
OECD ECONOMIC OUTLOOK, VOLUME 2022 ISSUE 1: PRELIMINARY VERSION © OECD 2022
160
Italy: Demand, output and prices 2018
2019
GDP at market prices Private consumption Government consumption Gross fixed capital formation Final domestic demand Stockbuilding¹ Total domestic demand Exports of goods and services Imports of goods and services Net exports¹ Memorandum items GDP deflator Harmonised index of consumer prices Harmonised index of core inflation² Unemployment rate (% of labour force)
2021
2022
2023
Percentage changes, volume (2015 prices)
Current prices EUR billion
Italy
2020
1 771.3 1 066.3 334.5 316.2
0.5 0.2 -0.5 1.2
-9.1 -10.6 0.5 -9.2
6.6 5.2 0.6 17.0
2.5 1.6 0.6 8.6
1.2 0.7 0.7 1.5
1 716.9 11.5
0.3 -0.5
-8.2 -0.3
6.4 0.2
2.8 0.5
0.9 0.0
1 728.5 555.5 512.6 42.8
-0.2 1.8 -0.5 0.7
-8.5 -14.2 -12.7 -0.9
6.6 13.4 14.3 0.2
3.3 7.9 10.5 -0.6
0.8 3.2 2.3 0.3
_ _ _ _ _ _ _ _ _
0.9 0.6 0.5 9.9
1.4 -0.1 0.5 9.3
0.5 1.9 0.8 9.5
2.9 6.3 2.8 9.0
3.3 3.8 2.7 9.3
Household saving ratio, net (% of disposable income) General government financial balance (% of GDP) General government gross debt (% of GDP) General government debt, Maastricht definition³ (% of GDP) Current account balance (% of GDP)
2.4 10.2 7.5 4.5 4.3 -1.5 -9.6 -7.2 -6.1 -4.2 155.6 185.5 175.0 174.4 172.4 134.1 155.4 151.0 150.4 148.3 3.2 3.8 2.4 -0.5 -0.7
1. Contributions to changes in real GDP, actual amount in the first column. 2. Harmonised index of consumer prices excluding food, energy, alcohol and tobacco. 3. The Maastricht definition of general government debt includes only loans, debt securities, and currency and deposits, with debt at face value rather than market value. Source: OECD Economic Outlook 111 database.
StatLink 2 https://stat.link/2unrjx
Italy 2 10-year government bond spread between Italy and Germany
Wage inflation and long-term inflation expectations
% pts 3.5
% 10
2.5 2.0 1.5 1.0 0.5
Long-term inflation expectations² →
8
3.0
2015
2016
2017
2018
2019
2020
2021
2022
0
% 4.0
← Wage inflation¹
3.5
6
3.0
4
2.5
2
2.0
0
1.5
-2
1.0
-4
0.5
-6
2011
2013
2015
2017
2019
2021
0.0
1. Average hourly wages and salaries of industry, construction and services (except activities of households as employers and extra-territorial organisations and bodies). 2. Firms' expectations for consumer price inflation in 2 years time. Source: OECD Economic Outlook 111 Database; Eurostat; Banca d'Italia; and OECD calculations. StatLink 2 https://stat.link/ynats0
OECD ECONOMIC OUTLOOK, VOLUME 2022 ISSUE 1: PRELIMINARY VERSION © OECD 2022
161 The war will impact growth as higher prices erode spending power and confidence. Natural gas supplies 42% of Italy’s energy needs. The government has introduced substantial policy supports, including reduced energy price surcharges and VAT rates, tax credits for energy intensive users and a one-off cash and public transport bonus for lower-income workers. State guarantees for firms’ credit and short-time work schemes have been expanded alongside green energy investment incentives. The government estimates Italy can be completely independent of Russian gas by the end of 2024. Alternative gas sources have been negotiated and regulations to raise gas reserves are in place, providing important shock absorbers, but lower energy consumption will also be required in the event of a possible decrease in gas supplies. Over the longer term, accelerated renewable energy supply would support energy security. Some administrative hurdles to renewable energy supply have been removed. The authorities expect 175 000 Ukrainian refugees will arrive in 2022, mostly women and children, support to whom is budgeted to cost 0.1% of GDP.
Policy is supportive but reforms must continue to be implemented Government policy remains focused on raising growth and gradually reducing fiscal support so that by 2030 total debt returns to 2019 levels. The fiscal stance is set to remain expansionary in 2022, with a deficit of 6.1% declining to 4.2% in 2023. Higher spending on energy price support and other stimulus to offset the impact of the war, and unanticipated payments for inflation-linked bonds, were partially offset by higher tax revenues and a windfall tax on energy companies. Gross debt (Maastricht definition) is projected to reach 148.3% of GDP in 2023. A spending review will identify funds for new spending commitments, including gradually higher military spending by 2030. Better targeted energy price support could generate savings. Whilst interest payments from higher government bond spreads will not rise significantly in the short term due to the longer duration of bonds, the risks from sharply higher interest rates could be substantial by 2025. Implementing additional reforms will send an important signal and support confidence and growth. The single child allowance and initial changes to personal income tax rates were introduced in December 2021 to support labour force participation and consumption. The National Recovery and Resilience Plan is being implemented. Public investment reached 2.9% of GDP in 2021 and will grow at double-digit rates in 2022 and 2023. The government allocated almost EUR 6 billion between 2022 and 2023 to counteract the impact of high construction inflation on investment projects. Nonetheless, the Plan’s very ambitious investment targets have been affected by delays. Planned investments of about EUR 9.5 bn were moved beyond 2026, although these sums were not financed by the Recovery and Resilience Fund.
A consumption driven slowdown in 2022 before a gradual recovery in 2023 Growth momentum will slow in 2022, as inflation lowers households’ purchasing power and willingness to spend, before gradually recovering in 2023. Growth is forecast to reach 2.5% in 2022 and 1.2% in 2023, with strong carry-over effects contributing 2.2 percentage points to 2022 growth. Although energy price moderation is expected to reduce headline inflation through 2023, core inflation is forecast to remain persistent, due to lasting effects from energy and trade supply disruptions. Food inflation is projected to remain elevated throughout the forecast. Wage rises will not fully compensate households for the higher cost of living. Uncertainty and high construction prices will delay investment somewhat, but this will be offset to an extent by increased investment incentives and strong public investment. International trade frictions will weigh on exports throughout the forecast, although competiveness will be supported by euro weakness and relatively lower inflation.
OECD ECONOMIC OUTLOOK, VOLUME 2022 ISSUE 1: PRELIMINARY VERSION © OECD 2022
162 Downside risks to growth dominate. A possible restriction in the supply of natural gas could further lower growth and increase inflation. Higher interest rates could lower growth, and through this channel raise public debt levels. If growth does not recover quickly, confidence and profitability could be damaged, raising bankruptcies, reducing bank profitability and lowering growth further. On the upside, the fiscal impact of tax reforms may have a larger effect, allowing wages, employment and household confidence to recover faster than forecast.
Supporting viable, greener firms will raise long-term resilience to shocks To mitigate the impacts of a drawn-out Ukraine conflict, policy should increasingly target temporary assistance to the most vulnerable, rather than lower energy prices. De-linking this support from future energy consumption and phasing out environmentally harmful subsidies accelerates the green transition. Energy security would be boosted by supporting investments in energy efficiency and renewable energy supply; long-term energy pricing contracts can help manage fiscal costs whilst providing certainty to investors. The measured fiscal consolidation strategy should be implemented to reduce the public debt-to-GDP ratio gradually. Social safety nets and training should be the main instruments to protect workers affected by firm closures, rather than policies that may inadvertently reduce willingness to hire or lengthen bankruptcy procedures. Implementing bankruptcy and public administration reforms, alongside the digitisation of civil justice, will support a faster, more predictable and more resilient recovery from the most recent crisis. Continued effective implementation of the National Recovery and Resilience Plan reforms will raise growth, and demonstrate political commitment to help offset war-related uncertainty.
OECD ECONOMIC OUTLOOK, VOLUME 2022 ISSUE 1: PRELIMINARY VERSION © OECD 2022