119
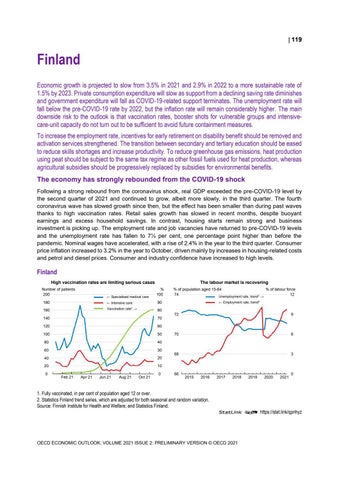
Finland Economic growth is projected to slow from 3.5% in 2021 and 2.9% in 2022 to a more sustainable rate of 1.5% by 2023. Private consumption expenditure will slow as support from a declining saving rate diminishes and government expenditure will fall as COVID-19-related support terminates. The unemployment rate will fall below the pre-COVID-19 rate by 2022, but the inflation rate will remain considerably higher. The main downside risk to the outlook is that vaccination rates, booster shots for vulnerable groups and intensivecare-unit capacity do not turn out to be sufficient to avoid future containment measures. To increase the employment rate, incentives for early retirement on disability benefit should be removed and activation services strengthened. The transition between secondary and tertiary education should be eased to reduce skills shortages and increase productivity. To reduce greenhouse gas emissions, heat production using peat should be subject to the same tax regime as other fossil fuels used for heat production, whereas agricultural subsidies should be progressively replaced by subsidies for environmental benefits. The economy has strongly rebounded from the COVID-19 shock Following a strong rebound from the coronavirus shock, real GDP exceeded the pre-COVID-19 level by the second quarter of 2021 and continued to grow, albeit more slowly, in the third quarter. The fourth coronavirus wave has slowed growth since then, but the effect has been smaller than during past waves thanks to high vaccination rates. Retail sales growth has slowed in recent months, despite buoyant earnings and excess household savings. In contrast, housing starts remain strong and business investment is picking up. The employment rate and job vacancies have returned to pre-COVID-19 levels and the unemployment rate has fallen to 7½ per cent, one percentage point higher than before the pandemic. Nominal wages have accelerated, with a rise of 2.4% in the year to the third quarter. Consumer price inflation increased to 3.2% in the year to October, driven mainly by increases in housing-related costs and petrol and diesel prices. Consumer and industry confidence have increased to high levels.
Finland High vaccination rates are limiting serious cases Number of patients 200
← Specialised medical care
The labour market is recovering % 100
180
← Intensive care
90
160
Vaccination rate¹ →
80
140
70
120
60
100
50
80
40
60
30
40
20
20
10
0
Feb 21
Apr 21
Jun 21
Aug 21
Oct 21
0
% of population aged 15-64 74
Unemployment rate, trend² →
% of labour force 12
← Employment rate, trend²
72
9
70
6
68
3
66
2015
2016
2017
2018
2019
2020
2021
0
1. Fully vaccinated, in per cent of population aged 12 or over. 2. Statistics Finland trend series, which are adjusted for both seasonal and random variation. Source: Finnish Institute for Health and Welfare; and Statistics Finland. StatLink 2 https://stat.link/qpnhyz
OECD ECONOMIC OUTLOOK, VOLUME 2021 ISSUE 2: PRELIMINARY VERSION © OECD 2021
120
Finland: Demand, output and prices 2018
2019
GDP at market prices Private consumption Government consumption Gross fixed capital formation Final domestic demand Stockbuilding¹,² Total domestic demand Exports of goods and services Imports of goods and services Net exports¹ Memorandum items GDP deflator Harmonised index of consumer prices Harmonised index of core inflation³ Unemployment rate (% of labour force) Household saving ratio, net (% of disposable income) General government financial balance (% of GDP) General government gross debt (% of GDP) General government debt, Maastricht definition⁴ (% of GDP) Current account balance (% of GDP)
2021
2022
2023
Percentage changes, volume (2015 prices)
Current prices EUR billion
Finland
2020
233.5 123.9 53.5 56.2
1.3 0.7 2.0 -1.6
-2.9 -4.7 0.5 -0.7
3.5 3.2 3.6 2.8
2.9 3.4 0.0 3.6
1.5 2.0 -1.4 1.9
233.6 2.8
0.4 -0.8
-2.5 -0.2
3.2 0.1
2.6 0.0
1.1 0.0
236.4 89.8 92.7 - 2.9
-0.1 6.8 2.3 1.7
-1.1 -6.8 -6.5 -0.1
3.5 3.1 2.6 0.2
2.6 6.1 5.0 0.4
1.1 3.9 3.3 0.2
1.5 1.1 0.7 6.7
1.3 0.4 0.5 7.8
2.7 1.9 1.1 7.7
2.2 1.9 1.4 6.6
1.7 1.8 1.8 6.3
0.6 -0.9 73.0 59.5 -0.3
4.8 -5.5 85.7 69.5 0.8
3.2 -4.0 93.6 77.4 -0.7
_ _ _ _ _ _ _ _ _
1.7 1.2 -2.2 -1.3 98.6 101.4 82.4 85.2 -0.1 0.1
1. Contributions to changes in real GDP, actual amount in the first column. 2. Including statistical discrepancy. 3. Harmonised index of consumer prices excluding food, energy, alcohol and tobacco. 4. The Maastricht definition of general government debt includes only loans, debt securities, and currency and deposits, with debt at face value rather than market value. Source: OECD Economic Outlook 110 database.
StatLink 2 https://stat.link/w46tl9
The number of serious coronavirus cases has increased but remains lower than during the first half of the year. The vaccination rate reached 81% of the population aged 12 or over in mid-November, but is now increasing only slowly. The government announced in early September that its hybrid COVID-19 strategy with national restrictions and comprehensive recommendations would be waived when 80% of the target population had been vaccinated or had the opportunity to be vaccinated, in favour of regionally determined measures. The regional phasing out of restrictive measures started in late September.
Fiscal policy will tighten as COVID-19 measures unwind Fiscal policy is set to tighten, with discretionary fiscal measures falling from 3.8% of GDP in 2020 to 0.7% of GDP in 2023 mostly owing to the termination of COVID-19 measures in 2021 and 2022 and of future-oriented investments and other temporary measures in 2023. The large increase in public investment that took place in 2020 will start to unwind in 2023 when a hospital construction and modernisation programme draws to a close and some transport infrastructure projects are completed. The underlying primary balance is projected to increase by 0.3 and 0.6 percentage point of GDP in 2022 and 2023, respectively. This takes account of grants from the EU Recovery and Resilience Facility of 0.2 percentage point of GDP in 2022 and 2023 that will be channelled to investment grants, subsidies, public consumption and investment. The temporary layoff scheme remains an important non-discretionary instrument to protect jobs in the event of a sharp downturn.
OECD ECONOMIC OUTLOOK, VOLUME 2021 ISSUE 2: PRELIMINARY VERSION © OECD 2021
121
Economic growth will slow to more sustainable rates Economic growth is projected to slow from 3.5% in 2021 to 1.5% in 2023 as the effects of the rebound from the COVID-19 shock fade. Consumption expenditure will slow as earnings growth weakens and, with household saving approaching desired levels, declines in the saving rate diminish. Government consumption and investment will fall as temporary increases to counter the COVID-19 shock terminate. The unemployment rate should fall to around 6¼ per cent in 2023 and wages should accelerate as the labour market tightens and workers get compensation for higher inflation, which is projected only to ease to 1.8% in 2023. The main downside risk to the outlook is that vaccination rates, booster shots for vulnerable groups and intensive-care-unit capacity would turn out not to be sufficient to avoid future containment measures. An upside risk is that the Recovery and Resilience Facility encourages more private investment than assumed.
Structural reforms would increase sustainable growth To increase the employment rate towards rates in other Nordic countries, conditions for awarding disability benefit for persons aged 60 or over should be aligned with those for other applicants, and public employment service resources and efficiency enhanced. Easing the transition between secondary and tertiary education by reforming the highly selective tertiary education admission system and increasing the number of study places available would help to reduce skills shortages and increase productivity. To reduce greenhouse gas emissions in the burden-sharing sector efficiently, a comprehensive package of price and complementary measures should be implemented, including subjecting heat production using peat to the same tax regime as for other fossil fuels used for heat production and by progressively replacing agricultural subsidies with subsidies for environmental benefits.
OECD ECONOMIC OUTLOOK, VOLUME 2021 ISSUE 2: PRELIMINARY VERSION © OECD 2021