157
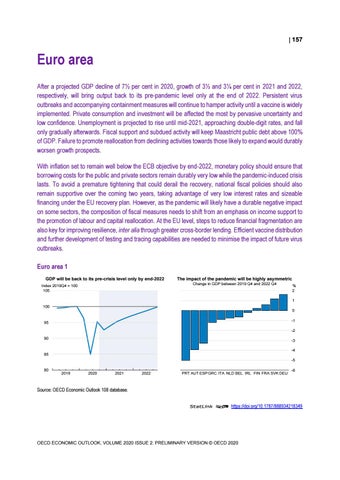
Euro area After a projected GDP decline of 7½ per cent in 2020, growth of 3½ and 3¼ per cent in 2021 and 2022, respectively, will bring output back to its pre-pandemic level only at the end of 2022. Persistent virus outbreaks and accompanying containment measures will continue to hamper activity until a vaccine is widely implemented. Private consumption and investment will be affected the most by pervasive uncertainty and low confidence. Unemployment is projected to rise until mid-2021, approaching double-digit rates, and fall only gradually afterwards. Fiscal support and subdued activity will keep Maastricht public debt above 100% of GDP. Failure to promote reallocation from declining activities towards those likely to expand would durably worsen growth prospects. With inflation set to remain well below the ECB objective by end-2022, monetary policy should ensure that borrowing costs for the public and private sectors remain durably very low while the pandemic-induced crisis lasts. To avoid a premature tightening that could derail the recovery, national fiscal policies should also remain supportive over the coming two years, taking advantage of very low interest rates and sizeable financing under the EU recovery plan. However, as the pandemic will likely have a durable negative impact on some sectors, the composition of fiscal measures needs to shift from an emphasis on income support to the promotion of labour and capital reallocation. At the EU level, steps to reduce financial fragmentation are also key for improving resilience, inter alia through greater cross-border lending. Efficient vaccine distribution and further development of testing and tracing capabilities are needed to minimise the impact of future virus outbreaks. Euro area 1 GDP will be back to its pre-crisis level only by end-2022
The impact of the pandemic will be highly asymmetric Change in GDP between 2019 Q4 and 2022 Q4
Index 2019Q4 = 100 105
% 2 1
100
0 -1
95
-2 90
-3 -4
85
-5 80
2019
2020
2021
2022
0
0
PRT AUT ESP GRC ITA NLD BEL IRL FIN FRA SVK DEU
-6
Source: OECD Economic Outlook 108 database. StatLink 2 https://doi.org/10.1787/888934218349
OECD ECONOMIC OUTLOOK, VOLUME 2020 ISSUE 2: PRELIMINARY VERSION © OECD 2020
158
Euro area: Demand, output and prices 2017
2018
Current prices EUR billion
Euro area GDP at market prices Private consumption Government consumption Gross fixed capital formation Final domestic demand Stockbuilding1 Total domestic demand
2019
2020
2021
2022
Percentage changes, volume (2015 prices)
11 190.4 6 024.9 2 296.7 2 305.3 10 626.9 78.8 10 705.7
1.9 1.5 1.2 3.2 1.8 0.1 1.9
1.3 1.3 1.8 5.8 2.4 -0.5 1.9
-7.5 -8.3 1.8 -10.7 -6.7 -0.2 -6.9
3.6 4.4 2.7 2.1 3.5 -0.3 3.2
3.3 3.5 0.4 4.8 3.1 0.0 3.1
484.7
0.1
-0.5
-0.8
0.6
0.3
_ _
1.4 1.8
1.7 1.2
1.6 0.3
0.9 0.7
1.0 1.0
Net exports1 Memorandum items GDP deflator Harmonised index of consumer prices Harmonised index of core inflation2
_ _ _ _ _ _ _
Unemployment rate (% of labour force) Household saving ratio, net (% of disposable income) General government financial balance (% of GDP) General government gross debt (% of GDP) General government debt, Maastricht definition (% of GDP) Current account balance (% of GDP)
1.0 1.0 0.7 0.7 0.9 8.2 7.5 8.1 9.5 9.1 6.4 6.7 14.3 11.4 9.2 -0.5 -0.6 -8.6 -6.5 -4.1 102.5 103.6 119.4 122.2 122.9 87.7 85.9 101.8 104.5 105.1 3.5 3.1 3.0 3.4 3.5
Note: Aggregation based on euro area countries that are members of the OECD, and on seasonally-adjusted and calendar-daysadjusted basis. 1. Contributions to changes in real GDP, actual amount in the first column. 2. Harmonised index of consumer prices excluding food, energy, alcohol and tobacco. Source: OECD Economic Outlook 108 database.
StatLink 2 https://doi.org/10.1787/888934218368
Euro area 2 Services have been hit hardest
Fiscal policy has strongly supported activity Change in the underlying primary balance²
Index, 50 = neutral 65
% pts 2.0
60
1.5
55
1.0
50
0.5
45
0.0
40
-0.5
35
-1.0
30
-1.5
Manufacturing PMI
25
-2.0
Services PMI¹
20
-2.5
15
-3.0
10
2007
2009
2011
2013
2015
2017
2019
0
0
2006 2008 2010 2012 2014 2016 2018 2020 2022
-3.5
1. Private service sector firms. 2. Measured in percent of potential GDP. Source: IHS Markit; and OECD Economic Outlook 108 database. StatLink 2 https://doi.org/10.1787/888934218387
OECD ECONOMIC OUTLOOK, VOLUME 2020 ISSUE 2: PRELIMINARY VERSION © OECD 2020
159
The epidemic has strongly resurged After a marked epidemiological improvement from May to July, COVID-19 infections have flared up again across Europe, placing a heavy burden on healthcare systems. There has been widespread introduction of targeted containment measures aimed at reducing personal interactions, such as curfews or closing of bars and restaurants, especially in areas with a high risk of contagion, and some countries have reimposed country-wide lockdowns. These, however, have tended to be less strict than in spring: schools have often remained open, and more firms have been allowed to operate than during the first lockdown. As diverse cross-border travel restrictions have re-emerged, the European Union adopted a recommendation to member states on a coordinated approach to the restriction of free movement, based on common criteria for assessing the epidemiological situation in countries or regions of origin or destination.
After a strong rebound, activity is declining again, hampered by the resurgence of the pandemic Following the end of lockdown measures, activity rebounded vigorously until mid-summer, although the performance in different sectors varied widely. Retail sales caught up to, and even exceeded, pre-pandemic levels, partly reflecting pent-up demand. In contrast, the recovery in industrial production remained incomplete, especially in capital goods, due to considerable investment weakness. The rebound in services relying on travel or direct personal contact was more muted, as illustrated by a very weak tourist season, especially in places mostly reliant on international travel. Differences in sectoral specialisation, and especially in the economic weight of international tourism, are a key driver of the asymmetric impact of COVID-19 across the euro area, with southern countries generally hit hardest and, among them, Spain more affected than Italy. Cross-country variation in the length and strictness of containment measures and in the extent of discretionary fiscal support also help explain the asymmetry in impacts. With the resurgence of the pandemic in the autumn and new measures restricting activities, a reversal of the recovery is likely in the fourth quarter of 2020. High-frequency indicators based on internet searches often point to a decline in activity, while business surveys show diminishing confidence in services. The magnitude of the decline in output, however, is much smaller than in the second quarter.
Strong EU support has increased fiscal space at the national level Decisive action at the EU level has created very favourable financing conditions for sovereigns. Following a series of policy announcements between March and June, the ECB has continued to provide abundant liquidity and conduct wide-scale asset purchases, while signalling its willingness to step up support if needed. In line with the recent decrease in, and subdued outlook for, inflation, ECB policy rates are assumed to remain unchanged over the coming two years. SURE, a EU lending facility to support national short-time work schemes, has become operational and witnessed strong take-up, with loans approved to 17 member states, almost exhausting the facility’s EUR 100 billion envelope. Furthermore, in July the European Council reached an agreement on Next Generation EU, a recovery plan envisaging EUR 750 billion of financing (about 5.5% of EU27 2019 GDP), mainly in the form of loans (EUR 360 billion) and grants (almost EUR 380 billion) to member states. A substantial part of these grants will be allocated to member states most affected by the pandemic, thus increasing their fiscal space. As a result of these actions, sovereign spreads in the euro area have narrowed substantially.
OECD ECONOMIC OUTLOOK, VOLUME 2020 ISSUE 2: PRELIMINARY VERSION © OECD 2020
160 ď ź National fiscal policies have provided substantial support to activity, backed by the temporary lifting of Stability and Growth Pact constraints until end-2021, which is welcome. Successive measures have been announced throughout 2020, leading to a discretionary stimulus of close to 3 percentage points of euro area GDP, though considerable uncertainty surrounds these estimates. A broadly neutral fiscal stance is expected in 2021, followed by moderate budget consolidation in 2022. In these years, national budgets will benefit from Next Generation EU grants, supporting investment and reforms set out in national recovery and resilience plans. These plans, assessed and approved at the EU level, are also designed to contribute to the broader priorities of digitalisation and climate change mitigation.
A mild recovery with important risks GDP is projected to grow only moderately over the coming two years, hampered by the recurrent need for containment measures for the next six to nine months and the ensuing high uncertainty and depressed confidence until vaccination is generally deployed. Investment will remain far below its pre-pandemic levels, but the recovery of private consumption is also projected to be sluggish, held back by high unemployment, modest wage growth and precautionary saving. Though a bit more dynamic, export growth will be constrained by the subdued recovery in international trade. After declining in 2020, inflation will return to around 1%. As in 2020, the impact of the pandemic is projected to remain asymmetric across the euro area, potentially widening the gap in prosperity between countries. Worse-than-expected virus outbreaks or unexpected delays in implementing effective vaccination, threatening to overwhelm healthcare systems, could force governments to impose stricter or longer-lasting confinement measures, resulting in higher output losses. Failure to overcome quickly current disagreements over the required legislation for Next Generation EU could delay public investment and reignite market tensions. A no-deal Brexit at the end of 2020 would further weaken trade and confidence. The expected increase in non-performing loans (NPLs), particularly in the sectors hit hardest by the pandemic, could threaten financial stability in some countries. Moreover, protracted NPL disposal would hamper the reallocation of bank credit and thus weaken investment further. Likewise, failure to foster labour reallocation through reinforced active labour market policies and increased investment would worsen the scarring effects of the pandemic. On the upside, swift production and distribution of vaccines, coupled with more effective testing, tracing and isolation strategies, would minimise future virus outbursts and thus bolster activity and confidence. Prompt and efficient implementation of the EU recovery plan could enhance structural reform implementation and help the euro area achieve stronger productivity growth.
Policies need to support resource reallocation National fiscal policies should continue to support aggregate demand, and avoid premature budget consolidation. In this context, governments should start to implement recovery and resilience plans swiftly, regardless of procedural lags that may slow down the receipt of Next Generation EU grants. Public investment and reforms should promote resource reallocation from activities that may face long-lasting subdued demand towards those likely to expand. An example of the latter is residential retrofitting for higher energy efficiency, which is essential to meet decarbonisation targets. Electric vehicles, another avenue for a green recovery, offer huge potential for innovation and investment. Fostering labour and capital reallocation requires enhanced training opportunities and speedier and more harmonised insolvency regimes. At the EU level, reducing financial fragmentation would also strengthen resilience and more efficient resource allocation. Welcome steps would include common deposit insurance, a European asset-management company to facilitate NPL disposal, and freer movement of capital and liquidity across borders within banking groups.
OECD ECONOMIC OUTLOOK, VOLUME 2020 ISSUE 2: PRELIMINARY VERSION Š OECD 2020