121
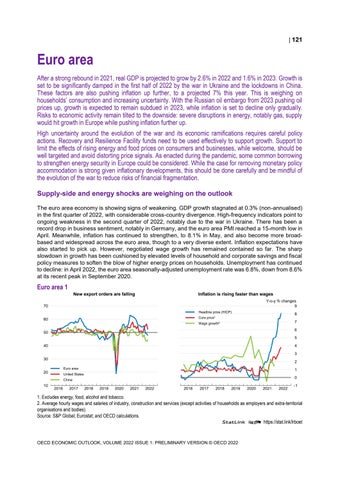
Euro area After a strong rebound in 2021, real GDP is projected to grow by 2.6% in 2022 and 1.6% in 2023. Growth is set to be significantly damped in the first half of 2022 by the war in Ukraine and the lockdowns in China. These factors are also pushing inflation up further, to a projected 7% this year. This is weighing on households’ consumption and increasing uncertainty. With the Russian oil embargo from 2023 pushing oil prices up, growth is expected to remain subdued in 2023, while inflation is set to decline only gradually. Risks to economic activity remain tilted to the downside: severe disruptions in energy, notably gas, supply would hit growth in Europe while pushing inflation further up. High uncertainty around the evolution of the war and its economic ramifications requires careful policy actions. Recovery and Resilience Facility funds need to be used effectively to support growth. Support to limit the effects of rising energy and food prices on consumers and businesses, while welcome, should be well targeted and avoid distorting price signals. As enacted during the pandemic, some common borrowing to strengthen energy security in Europe could be considered. While the case for removing monetary policy accommodation is strong given inflationary developments, this should be done carefully and be mindful of the evolution of the war to reduce risks of financial fragmentation. Supply-side and energy shocks are weighing on the outlook The euro area economy is showing signs of weakening. GDP growth stagnated at 0.3% (non-annualised) in the first quarter of 2022, with considerable cross-country divergence. High-frequency indicators point to ongoing weakness in the second quarter of 2022, notably due to the war in Ukraine. There has been a record drop in business sentiment, notably in Germany, and the euro area PMI reached a 15-month low in April. Meanwhile, inflation has continued to strengthen, to 8.1% in May, and also become more broadbased and widespread across the euro area, though to a very diverse extent. Inflation expectations have also started to pick up. However, negotiated wage growth has remained contained so far. The sharp slowdown in growth has been cushioned by elevated levels of household and corporate savings and fiscal policy measures to soften the blow of higher energy prices on households. Unemployment has continued to decline: in April 2022, the euro area seasonally-adjusted unemployment rate was 6.8%, down from 8.6% at its recent peak in September 2020.
Euro area 1 New export orders are falling
Inflation is rising faster than wages Y-o-y % changes 9
70 Headline price (HICP)
8
Core price¹
60
7
Wage growth²
6
50
5 40
4 3
30
2 Euro area
20
1
United States
0
China
10
2016
2017
2018
2019
2020
2021
2022
0
0
2016
2017
2018
2019
2020
2021
2022
-1
1. Excludes energy, food, alcohol and tobacco. 2. Average hourly wages and salaries of industry, construction and services (except activities of households as employers and extra-territorial organisations and bodies). Source: S&P Global; Eurostat; and OECD calculations. StatLink 2 https://stat.link/lrboet
OECD ECONOMIC OUTLOOK, VOLUME 2022 ISSUE 1: PRELIMINARY VERSION © OECD 2022
122
Euro area: Demand, output and prices 2018
2019
GDP at market prices Private consumption Government consumption Gross fixed capital formation Final domestic demand Stockbuilding¹ Total domestic demand Net exports¹ Memorandum items GDP deflator Harmonised index of consumer prices Harmonised index of core inflation² Unemployment rate (% of labour force)
2021
2022
2023
Percentage changes, volume (2015 prices)
Current prices EUR billion
Euro area
2020
11 571.0 6 204.7 2 364.8 2 426.5
1.6 1.4 1.8 6.8
-6.5 -7.9 0.8 -7.2
5.3 3.6 3.9 4.1
2.6 2.6 0.8 4.8
1.6 1.5 0.4 3.2
10 996.0 108.4
2.7 -0.2
-5.9 -0.4
3.8 0.4
2.7 0.4
1.7 0.0
11 104.4 466.7
2.4 -0.8
-6.2 -0.4
4.2 1.3
3.1 -0.3
1.6 0.1
_ _ _ _ _ _ _ _ _
1.7 1.2 1.0 7.6
1.7 0.3 0.7 8.0
2.1 2.6 1.4 7.7
4.4 7.0 3.8 7.1
3.8 4.6 4.0 7.4
Household saving ratio, net (% of disposable income) General government financial balance (% of GDP) General government gross debt (% of GDP) General government debt, Maastricht definition³ (% of GDP) Current account balance (% of GDP)
7.1 13.6 11.5 8.7 7.8 -0.7 -7.1 -5.1 -4.1 -3.0 103.1 121.1 115.7 115.0 114.0 85.7 99.3 97.5 96.9 95.9 3.0 2.8 3.6 2.2 2.0
Note: Aggregation based on euro area countries that are members of the OECD, and on seasonally-adjusted and calendar-daysadjusted basis. 1. Contributions to changes in real GDP, actual amount in the first column. 2. Harmonised index of consumer prices excluding food, energy, alcohol and tobacco. 3. The Maastricht definition of general government debt includes only loans, debt securities, and currency and deposits, with debt at face value rather than market value. Source: OECD Economic Outlook 111 database.
StatLink 2 https://stat.link/edlw7x
Euro area 2 The fiscal stance is set to be broadly neutral % pts 6 4
Monetary policy will begin to normalise
Underlying government primary balance¹ as a percentage of potential GDP Euro area
United Kingdom
United States
% 3.5 3.0
Euro area United States
2.5
2
2.0
0
1.5
-2
1.0
-4
0.5
-6
0.0
-8
2019
2020
2021
2022
2023
0
0
2019
2020
2021
2022
2023
-0.5
1. The underlying government primary balance is cyclically-adjusted government net lending excluding net interest paid and net one-off operations. Source: OECD Economic Outlook 111 database; and OECD calculations. StatLink 2 https://stat.link/h1n4l7
OECD ECONOMIC OUTLOOK, VOLUME 2022 ISSUE 1: PRELIMINARY VERSION © OECD 2022
123 The war is having significant effects on the euro area economy and spending to support Ukrainian refugees (over 5 million within the European Union) will add to pressures on public finances in the short term until refugees gradually join the labour force or return home. The war is also affecting imports of critical base metals and agricultural commodities as well as their global prices. The escalation of sanctions on fossil fuels (coal, oil and possibly natural gas in the future) could also have profound adverse macroeconomic effects in Europe, notably in the countries that are the most dependant on Russian energy.
Fiscal measures are supporting businesses and consumers from rises in energy prices While starkly different within the euro area, the fiscal stance is projected to be broadly neutral in 2022, with a moderate consolidation in 2023. Measures to minimise the impact of the pandemic are being phased out, but member states are introducing additional fiscal support to help shelter vulnerable consumers and businesses from the rapid rise in energy prices. However, in the absence of common European guidelines, the measures taken are not equally well designed and targeted across the euro area, which might reduce their effectiveness and possibly create distortions in competition. In addition, the ongoing conflict in Ukraine has triggered a rise in military spending in many countries, and a rise in energy-related investment to strengthen the diversity of energy sources. This strengthened energy independence will require significant national and European investments in energy infrastructure. Eventually, and noting the consequences of the war for public finances and investment, an ambitious reform of the European fiscal framework will be needed. The ECB had signalled the gradual removal of monetary policy accommodation before the war erupted, and recent communication from the ECB governing council has pointed to further progress given upward surprises to prices. Net asset purchases are now planned to end early in the third quarter of 2022. However, it is expected that maturing bonds will be fully reinvested over the projection period, keeping the size of the ECB’s balance sheet unchanged. A first rise in policy rates is assumed to take place shortly after the end of net asset purchases in July, followed by additional increases, before stabilising by mid-2023 as inflationary pressures progressively wane. Further rises in policy rates in 2023 will depend on data developments and the evolution of the war in Ukraine, as well as on the evolution of long-term interest rates and the need to avoid financial fragmentation.
After a soft patch in the first half of 2022, growth will resume but risks are to the downside Quarterly growth is projected to slow in the first half of 2022, although strong carryover effects from 2021 mean that annual GDP growth of 2.6% is projected. The increase in oil prices from the embargo on Russian oil will weaken the pace of the recovery in 2023. Despite relatively robust wage growth, consumer price inflation of 7% in 2022 and 4.6% in 2023 will lead to a contraction of real disposable income in 2022 and only modest growth in 2023. This will weigh on private consumption but be partially offset by further declines in household saving rates. Inflation is projected to moderate only very slowly through 2023, with progressively lower global energy prices, waning supply chain bottlenecks, and subdued domestic growth helping to contain price and cost pressures. The risks to the projections are to the downside. The ongoing energy price shock and disruptions to supply chains could worsen, either through an additional round of sanctions or a worsening of the COVID-19 outbreak in China. Empirical studies suggest that a complete or partial gas embargo in Europe would reduce output in different countries significantly, although to a varying extent depending on each country’s energy dependency. The risks to inflation are to the upside, especially in case of a severe disruption in gas supply or through stronger wage growth. This could lead to a more rapid tightening of monetary policy than assumed. OECD ECONOMIC OUTLOOK, VOLUME 2022 ISSUE 1: PRELIMINARY VERSION © OECD 2022
124
Supporting the recovery and long-term resilience to shocks Ensuring a rapid and effective disbursement of Next Generation EU funds would continue to support the recovery. In case member states need to further increase economic support measures to shelter businesses and the most vulnerable citizens from the energy and food price shock, they should ensure that they remain temporary and better targeted. Common EU guidelines would help to maximise their effectiveness and ensure a level playing field. It is also important to ensure that price signals keep operating, for example by protecting vulnerable households through financial support and offering cleaner alternatives to current energy sources, rather than price freezes or tax cuts. In addition to national fiscal policy, this crisis might also warrant some common spending and borrowing, as implemented during the pandemic crisis, for example to invest in critical common energy infrastructure. The European Commission should accelerate proposals for reforming the European fiscal framework. Finally, while the case for gradually removing monetary policy accommodation is strong given inflationary developments, high economic uncertainty calls for maintaining a cautious and flexible approach. In particular, flexibility in the reinvestment of maturing asset purchases will be critical to avoid financial fragmentation.
OECD ECONOMIC OUTLOOK, VOLUME 2022 ISSUE 1: PRELIMINARY VERSION © OECD 2022