MARKET
PERSPECTIVES

WHERE THE RUBBER MEETS THE ROAD: MONEY AND ENERGY HOLD STEADY
THE CONFLICT IN IRAN: THE SOONER WE STABILIZE THE SOONER WE GROW
UNEVEN INFLATION, RISING OIL PRICES AND FADING HOPES FOR RATE CUTS
OUR INVESTMENT COMMITTEE’S TOP PREDICTIONS FOR 2ND QUARTER AND KEY TAKEAWAYS FROM 1ST QUARTER
FIRST-QUARTER 2026 RECAP
SECOND-QUARTER OUTLOOK APRIL 2026

LETTER FROM OUR CHIEF INVESTMENT OFFICER

FIRST-QUARTER KEY TAKEAWAYS






SPECIAL REPORT: THE COST OF NECESSITY
15 19 22 25 ASSET ALLOCATIONS
26 LIFETIME TAX PLANNING STRATEGIES SECOND -QUARTER PR E DI CTIONS 02 04 06

SPECIAL REPORT: A CRUDE SITUATION IN IRAN 11 STATE OF THE ECONOMY FIRST-QUARTER EQUITIES

A Letter from Our Chief Investment Officer
At the end of 2025, my forecast for the upcoming year was: “if you liked the U.S. economy this past year, there is a good chance you will like it in 2026.” There was little in the available economic data to suggest anything other than relatively modest growth in aggregate.
To be sure, as is always the case, some sectors had a better go of it than others. However, where the rubber meets the road, our analysis suggested there was little reason to expect the costs of either money or energy to experience significant directional change.
As a result, it was difficult to forecast either a spike or a collapse in economic activity. If history serves as a guide— while acknowledging historical patterns are not predictive— the U.S. economy doesn’t just turn on a dime or pivot dramatically without cause. It often takes something significant to knock things out of equilibrium.
Then, well…let’s just say March Madness took on a whole new meaning.
As we now know, the U.S. and Israel began coordinated military strikes against strategic positions in Iran on Feb. 28, 2026. Not surprisingly, the progression of the conflict dominated headlines for the remainder of the quarter. Also, perhaps even less surprisingly, crude oil prices climbed sharply, as the war significantly disrupted supply from the Persian Gulf region.1
According to Bloomberg, the Generic 1st CL Future,—a proxy for West Texas Intermediate (WTI) crude oil—rose from $67.02 per barrel at the end of February to $101.38 by the end of the first quarter. Clearly, that is a large move in a critical commodity over a very short period.
While consumers may have felt some “pain at the pump” during March, it remains to be seen exactly what impact higher oil prices will have on longer-term economic activity. Intuitively, the longer crude prices remain elevated, the greater the potential drag on the economy—and not in a good way.
The inverse is also true: The shorter crude prices remain elevated, the more limited the impact on economic activity. Hopefully, that makes sense.
As a result, at the end of March, economic forecasts for the remainder of the year were—perhaps unsurprisingly—nebulous at best, hinging largely on the duration of the conflict in the Middle East. The sooner things stabilize, the sooner the U.S. economy can get back to relatively modest growth.
Put another way, it is my opinion that if we exit Iran quickly, the economy could potentially get back to something closer to the conditions we saw in 2025.
And, of course, if something changes in the tea leaves—or the crystal ball—we’ll be sure to let you know.
Thank you for your continued support.
John Norris Chief Economist and Chief Investment Officer
Chief Investment Officer
JOHN NORRIS
Oakworth Asset Management Investment Committee




Catch More From Our Investment Committee Experts

Common Cents
SOURCES:
Started over 20 years ago, Common Cents is a weekly blog written by Chief Economist John Norris, detailing and explaining the events that impact our economy. John distills the latest information, making it easy to understand how these events affect daily life.
READ OUR BLOG: LISTEN TO OUR PODCAST:
Trading Perspectives
In this weekly podcast, Chief Economist John Norris and Portfolio Manager Sam Clement exchange perspectives on the driving factors influencing our economy. Trading Perspectives can be found on Apple Podcasts, Spotify, Google Play, YouTube and all other major podcast outlets.
SCAN TO READ COMMON CENTS

SCAN TO LISTEN TO TRADING PERSPECTIVES
1. NBC News. “Live updates: Iran war, oil ship attacks, Hormuz, Trump, Israel, Lebanon.” March 13, 2026
The views expressed herein reflect the opinions of the author as of the date of publication and are subject to change without notice. This material is for informational purposes only and should not be construed as investment advice or a recommendation regarding any security, strategy or market sector. Past performance is not indicative of future results. All market and economic data are obtained from sources believed to be reliable, but accuracy cannot be guaranteed.
DAVID MCGRATH, CFA® Managing Director Associate Managing Director
SAM CLEMENT
Analyst
RYAN BERNAL Portfolio Manager
CHRIS COOPER
FIRST-QUARTER KEY TAKEAWAYS
The first quarter was marked by uneven inflation, rising oil prices, fading hopes for rate cuts and a growing “Vegas effect.” When people feel flush, they go; when they don’t, they stay home—raising more questions than answers.

THE INFLATION FRUSTRATION GAP
We have traditionally maintained that “inflation is wherever you want to look for it.” This remained true throughout the first quarter of 2026. According to the Consumer Price Index (CPI) report for February, the price of “uncooked ground beef” had risen 15.2% over the previous 12 months. On the other hand, televisions were down 4.1%. Naturally, consumers buy hamburgers far more frequently than TVs.
TARIFFS AND THE GROWING TRADE DEFICIT
According to the Federal Reserve, the U.S. ran an estimated $911.7 billion trade deficit in 2025. For comparison, the deficit was $903.5 billion in 2024 and $774.2 billion in 2023. Weren’t those tariffs supposed to improve our trade imbalances?
A COLLEGE FOOTBALL WORST TO FIRST
The Indiana Hoosiers, historically one of the weaker NCAA FBS programs, won the college football national
championship in January. This capped off a perfect 16–0 season, a first for any FBS team. In 2023, just two seasons prior, the Hoosiers were 3–9, with a 1–8 record in the Big Ten. Miracles really do happen.
THE LOW HIRE, LOW FIRE ECONOMY
The U.S. labor market started 2026 like they ended 2025: “low hire and low fire.” This means sluggish job creation coupled with few massive layoffs. According to the Bureau of Labor Statistics (BLS), the economy added 126,000 payroll jobs in January 2026 and shed 92,000 jobs in February, for a net add of only 34,000. The question then remains—how much longer can the consumer-driven U.S. economy continue to grow if it isn’t creating many new consumers?
THE VEGAS EFFECT
Las Vegas’ tourism slump continued into the start of 2026. Historically, some people have made the case that Sin City is an economic indicator of sorts.
When people are flush with cash and feel good about things, they go to Vegas. When they don’t, they stay home. Is this slowdown an ill wind? Or does it reflect the simple fact that gambling has become so ubiquitous, you don’t have to go to Las Vegas to do it?
WAR, OIL, SUPPLY AND DEMAND
Most adults know the basics of supply and demand. When the supply of something is less than the demand, its price will go up. The inverse is also true. However, it seems the armed conflict in the Middle East also affects prices. In our observation there seems to be a positive correlation between bombs and crude oil prices. That doesn’t mean we have to like it, though.
MOVING MARKETS WITH TWEETS
In the past, we’ve said that “politicians typically get too much credit for the good times, and too much blame for the bad.” However, the current administration is making us rethink this conviction. More than any other president in recent memory, President Donald Trump seems to be able to move the markets with his comments, tweets and not always predictable actions.
A VOLATILE QUARTER FOR GOLD
Even “boring” assets like gold have become more exciting. First-quarter gold prices swung as investors shifted from rate-cut hopes to rate-hike fears amid rising crude oil. Despite the volatility, many still believe gold hasn’t lost its luster.
IS AI DESTRUCTIVE OR PRODUCTIVE?
When folks weren’t talking about gold, oil, Iran or Trump, artificial intelligence (AI) seemed to be on their minds—more specifically, its potential impact on
SOURCES:
1. U.S. Bureau of Labor Statistics, Consumer Price Index — February 2026, March 11, 2026.
2. Federal Reserve Bank of St. Louis, Trade Balance: Goods and Services, Balance of Payments Basis (BOPGSTB)
3. U.S. Bureau of Labor Statistics, The Employment Situation — February 2026.
4. Axios, Las Vegas tourism slump signals wider economic slowdown, Aug. 9, 2025
5. CNBC, Oil prices today: WTI, Brent rise amid Middle East tensions involving Iran, March 24, 2026.
6. NBC News, Markets: Stocks turn sharply as Trump escalates tensions with Europe over Greenland, Jan. 21, 2026.
7. TheStreet, Gold’s biggest drop in decades hides a powerful tailwind, March 23, 2026.
job growth and economic activity. These concerns may be misplaced. AI will likely make some workers more productive, increasing output and the economy’s need for additional capacity. This could ultimately support future job growth.
GRAMMY DRAMA OR JUST BAD MUSIC?
According to Nielsen, the 68th Grammy Awards in February drew 14.41 million viewers. While higher than 2021’s all-time low, it was significantly lower than the estimated 51.7 million who watched in 1984. Defenders might say viewing habits have changed over the past 40 years. We suspect the truth is that the music may have just been better back then.
OIL ON THE RISE; RATES HOLD STEADY
As expected, the Federal Reserve did not cut its target rate during the quarter. Investors still hoped for a cut by year-end, but by late March rising crude oil prices had largely dashed those expectations.
MUSK, MEASURED IN MILLIONS
According to some sources, Elon Musk’s net worth was estimated at $852 billion in February 2026. For perspective, if Musk were to spend $1 million each day, it would take him more than 2,334 years to spend it all.
EUROPEAN RELEVANCE IN QUESTION
The political left, right and middle all bemoaned Europe’s relative weakness during the quarter, whether in military, economic or diplomatic terms. While this became glaringly apparent during the first quarter of 2026, it has been a long time coming. The question remains: What can Europe do to make itself relevant again?
8. Federal Reserve Bank of Dallas, Advances in AI Will Boost Productivity, Living Standards over Time, June 24, 2025.
9. CME Group, CME FedWatch Tool, accessed March 29, 2026.
10.Forbes, Elon Musk Just Became the First Person Ever Worth $800 Billion After SpaceX Acquired xAI. Feb. 3, 2026
11.Responsible Statecraft, Europe’s weakness on Iran, Gaza has radicalized politics at home, March 4, 2026.
13.Bloomberg News, Iran war energy fallout is exposing another European weakness, March 7, 2026
14.Statista, Share of the EU in the inflation-adjusted global gross domestic product, accessed March 20, 2026.
STATE OF THE ECONOMY
Have you ever watched a basketball game where the outcome was clear in five minutes? Dull and devoid of energy? The first quarter of 2026 played out in much the same way.
John Norris

We’ve all seen it: a game that looks competitive on paper but is effectively decided in the opening minutes. I’m not talking about the typical David vs. Goliath matchup that college powerhouses schedule early in the season. Rather, I mean those supposedly competitive games where one team jumps out to a 10-point lead, and the two sides basically trade baskets for the remaining 35 minutes.
Of course, you’ve seen it. These games are dull and nearly devoid of energy—sports on autopilot, or cruise control.
In many ways, this is a fitting analogy for the U.S. economy during the first quarter of 2026. Despite the barrage of headlines and global uncertainty, where the rubber meets the road, the economic data was fairly uneventful. If you liked the fourth quarter of 2025, you probably liked the first three months of 2026.
If basketball isn’t your thing, consider a food analogy. The first quarter was the economic equivalent of a chicken-and-rice casserole, or maybe poppy seed chicken. Something along those lines.
One more? If the U.S. economy in the first quarter of 2026 were a rock ’n’ roll band, it would be either Styx or Journey. There, I’ve said it.
Following the underwhelming fourth-quarter 2025 gross domestic product (GDP) reading of 0.7%, it is unlikely the U.S. economy gained much momentum to start 2026—at least, that’s what the data suggest.
The following table shows the final reading for 2025 and the most recent observation as of March 30, 2026. All data in the table is sourced from Bloomberg Financial.
In truth, January and February were about as uneventful as it gets when it comes to analyzing—perhaps overanalyzing— economic reports.
Then came March.
On Feb. 28, 2026, the United States and Israel launched a coordinated, large-scale attack on Iran, contributing to increased volatility in energy markets. Not surprisingly, the price of crude oil rose sharply as the conflict escalated.1
Perhaps even less surprising, this created uncertainly about future economic growth and inflation. As a result, the world’s investment markets fell.
Suffice it to say, many investors appear reluctant to hold “risky” assets when tensions in the Middle East escalate. Longerterm interest rates climbed as investors seemingly grew more comfortable avoiding long-duration risk, favoring cash over longbonds.2 Meanwhile, the domestic stock market, represented by the S&P 500, posted one of its worst months in recent memory. From the end of February 2026 through March 27, the index delivered a total return of approximately negative 7.32% for this index.3
Unsurprisingly, many investors are unlikely to be pleased with their first-quarter 2026 statements.
Even so, investment returns are one thing and economic activity is something else. While they might move together at times, there is no guarantee they always will.
While some of the data may be “Greek” to those who don’t closely follow the economic release calendar, the overall picture is fairly straightforward. In aggregate, the data appears satisfactory. It does not point to a sharp acceleration in economic activity, but it certainly does not signal an impending economic collapse, either.
Just because investors may be acting rationally does not mean they are always right. As of March 31, 2026, it remains unclear what impact this past month’s geopolitical turmoil has had on U.S. consumer activity and overall economic growth. My personal experience suggests not much has changed.
Put another way, if the rise in crude oil prices and heightened geopolitical tension have had an immediate, negative effect on domestic economic activity, there has been little observable evidence of a measurable shift in consumer behavior.
Traffic on Interstate 65 south of Birmingham remains as heavy as ever. In Atlanta, Interstates 85 and 75 are still the parking lots they’ve long been. Congestion around Greenville, South Carolina, continues to frustrate, as does Interstate 77 heading west toward Huntersville and Davidson, North Carolina.
In short, there are still too many people going too many places to buy too many things. And, of course, plenty of trucks are on the road.
The restaurants I visited in March were full, as were grocery stores and gas stations. Service at these establishments was dispassionate and often painfully slow. In other words, it was business as usual.
Nothing changed in my daily work activities. In fact, I might argue things were a bit busier in March than in January or February. Most of my co-workers would likely say the same.
In our view, through the end of March 2026, any economic slowdown in the U.S. attributable to the conflict in Iran has likely not been significant enough to push first-quarter GDP into recession. However, because the war in the Middle East IS such a wildcard, it is difficult to make concrete predictions about the near term or to estimate March's economic data with precision.
At its core, the situation comes down to some very basic questions that, as of late March, no one can answer with any certainty:
• How high will the price of crude oil ultimately rise? 4
• How long will it remain at that level?
• And how will the Trump administration respond to countries that did not support the United States in its war against Iran?
This brings us back to what we do know—or think we know— with greater confidence: January and February.
As noted earlier, the economy was, for the most part, fairly dull at the start of the year. To be sure, the now-familiar angst about artificial intelligence (AI) remained alive and well.5 The labor market continued to suggest a “low-hire, low-fire” environment—neither particularly strong nor week.
Official inflation data showed modest improvement, even if that did not always align with the experiences of those doing the grocery shopping. Banks were extending a reasonable level of credit, and the money supply was growing at a steady pace. January’s trade balance came in slightly better than expected, though that series has become increasingly difficult to predict.
All told, prior to March, I would have estimated first-quarter 2026 gross domestic product (GDP) growth in the range of 2.25% to 2.50%, even without knowing the final month’s data. After March, however, the outlook is far more uncertain, and I would hesitate to offer a prediction until just before the Bureau of Economic Analysis (BEA) releases its estimate.
That is, if I still participated in those surveys, which I do not.
In conclusion, the U.S. economy in the first quarter was likely not as eventful as headlines may have suggested. In fact, it was fairly uneventful, at least in terms of the economic data. In many ways, it was like eating a chicken-and-rice casserole while watching a lopsided basketball game with Styx playing in the background.
Then, along came March, and we may simply have to believe whatever the government ultimately tells us about the economy for the month.

SPECIAL REPORT: THE COST OF NECESSITY
Why is the cost of living rising faster than the cost of living it up?
Ryan Bernal

For the first few decades of the 21st century, Americans put little thought into inflation. Yet for the past five years, it has dominated headlines. Many consumers have likely felt the impact, but much like a slow leaking tire, it isn’t noticeable until one day it is.
Yet anyone following the headline inflation data might conclude that price pressures are more contained than consumers report. This raises an important question: Is the data flawed? Or is the Bureau of Economic Analysis missing something?
Not necessarily. While economists sometimes question the data’s validity, a more complex issue is emerging in the economy.
The gap between economic reports and consumer sentiment reflects a growing divide in the underlying health of the consumer.
The Divided Consumer and K-shaped K-shaped Economy
For American households, the experience of inflation has not been consistent.
The essentials of daily life—housing, insurance and food— have steadily become more expensive, adding downward pressure to the discretionary budgets of the bottom 80% of consumers.
By contrast, the top 20% of consumers appear largely unaffected. Some have even seen their spending bolstered by rising asset prices in recent years.
This concept is often described as a “K-shaped” economy—a divergence between higherearning households at the top and lower-earning households at the bottom. 1
While the cost of living has continued to rise, many goods and services associated with “living it up” have seen only modest price increases or have remained flat. The result is a deeper structural divide. Essential inflation is straining lower-income households and weighing heavily on sentiment, while higher-income consumers, more insulated from these pressures, have sustained spending and buoyed headline economic data.
What the Data Says
To understand the present, it is important to first examine the past. Since COVID-19, inflation has remained top of mind for most Americans—and for good reason. From January 2020 to January 2026, the Federal Reserve’s preferred inflation measure, Personal Consumption Expenditures (PCE), increased by 21.70%, equating to roughly 3.62% annualized inflation. 2 While this figure is well above the Federal Reserve’s 2% target, it still understates the experience of many consumers, particularly as price increases have been concentrated in essential categories.
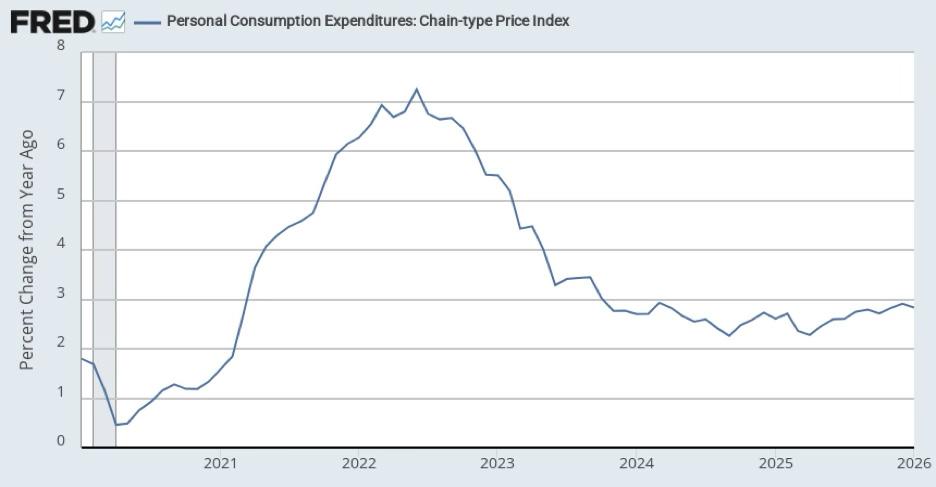
Source: U.S. Bureau of Economic Analysis via FRED
A closer look at the underlying PCE data reveals meaningful differences across categories. For example, recreational goods and vehicles averaged a monthly price change of -0.05% between January 2020 and January 2026, indicating relatively stable pricing. 3 In contrast, necessity categories show a clear divergence. Food and beverages purchased for offpremises consumption rose an average 0.35% per month over the same period, peaking at 2.20% in April 2020.
Personal Consumption Expenditures: Chain-Type Price Index
This divergence is also evident in services, which have outpaced goods inflation overall, Services increased at an average monthly rate of 0.33% compared with 0.19% for goods. Within services, essential categories stand out. Housing and utilities — a fundamental need for all households — rose an average 0.39% per month. Financial services and insurance, which affect the majority of Americans, increased at an even higher monthly rate of 0.43%. 3
Why the Experience Feels Different
If essential goods and services are rising in cost, it is no surprise that many Americans—particularly those in lower-income tiers—feel increasingly pessimistic about the economy. The question, then, is why this divergence exists and how it has developed. There is no single explanation, but several key factors help explain the disparity.
• Technology has long acted as a deflationary force, as seen in the relatively modest price changes of high-cost consumer technology. Advances in production have made once-expensive manufacturing processes more efficient improving product quality while in some cases, reducing prices. Television technology offers a clear example: bulky, complex screens have evolved into thinner, lighter and more cost-effective designs. This can also be applied to other industries that are not so obvious, with the global rise of automation.
• Even entertainment events can lower overhead costs by using technology to assist in ticketing, organization and disseminating information.
Another reason some goods and services have experienced uneven price increases is the distinction between temporary supply chain disruptions and sustained increases in input costs and cost of goods sold.
During and after the pandemic, global supply chains were severely disrupted, leaving suppliers and distributors unable to access necessary goods and services. As the global economy reopened, many of these bottlenecks eased and prices began to normalize. However, some cost pressures have proven more persistent due to structural increases in key inputs. Energy is a prime example, with prices influenced by shifting geopolitical, economic and social conditions. Events such as the war in Ukraine and ongoing tensions involving the United States and Iran have contributed to elevated oil prices, which ripple through the broader U.S. economy.
By comparison, housing faces more structural supply constraints. Higher financing costs and limited turnover— particularly in a market shaped by previously low mortgage rates—have sustained upward pressure on both home prices and rents. Unlike many goods, housing is location-dependent, slow to adjust and heavily influenced by regulation and zoning.
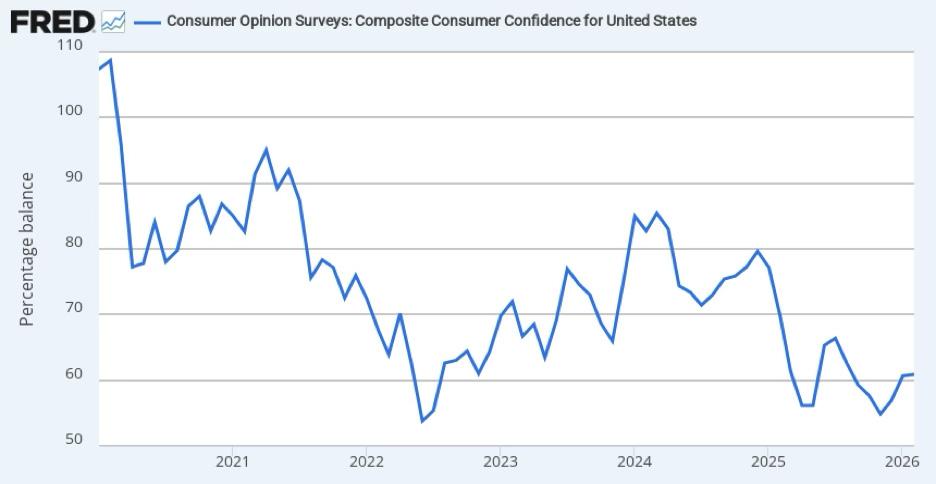
This divergence is reflected in consumer sentiment. Many households, particularly lower-income earners, report growing frustration with economic conditions. Consumer confidence, as measured by the Consumer Opinion Surveys Composite Consumer Confidence Index for the United States (St. Louis Fed), has declined since early 2020. The index peaked at 108.67 in February 2020 before falling steadily as the pandemic unfolded.
The reading never fully recovered even as global supply chains reopened and broader economic conditions improved. The Federal Reserve reported consumer confidence at an all-time low of 53.79 in July 2022. In the years since, it has remained subdued—never exceeding 85 and most recently reading 60.89. Viewed in context, this suggests that while consumers were initially uncertain and anxious during the pandemic, that sentiment has persisted—and in some cases intensified—even as headline conditions have improved.4
Consumer Opinion Surveys:
States
Source:Organization for Economic Co-Operationand Development via FRED®
Looking Ahead
It is reasonable to anticipate a shift in the consumer environment. Sticky inflation—particularly in essential categories—continues to weigh on household financial health. While wages have increased, the cost of everyday necessities has risen even faster. This presents a complex challenge for policymakers, including the Federal Reserve and elected officials: how can these pressures be effectively addressed?
Limits and Constraints
The Federal Open Market Committee has tools at its disposal to influence economic conditions, including adjusting monetary policy to stimulate growth or reduce liquidity. However, some of these challenges extend beyond its reach. Services inflation, for example, tends to be more persistent
SOURCES:
1. NPR, "What is a K-Shaped Economy? Dec. 31, 2025.
and difficult to control. Additionally, structural factors outside the Fed’s jurisdiction—such as zoning regulations that constrain housing supply or healthcare policies that drive up costs—continue to contribute to elevated prices.
There is unlikely to be a simple or immediate resolution. Like many economic challenges facing Americans today, this issue will take time to unfold. Still, there is reason for cautious optimism over the long term. Consumers have consistently demonstrated an ability to adapt, adjusting behaviors and priorities to navigate periods of economic strain—even when doing so involves meaningful trade-offs. For most households, the distinction is clear. Luxuries can be adjusted. Necessities cannot. That is what makes the current environment feel fundamentally different.

2. U.S. Bureau of Economic Analysis, Personal Consumption Expenditures (PCE), via Federal Reserve Bank of St. Louis (FRED) Accessed 6 Apr. 2026.
3. Bureau of Economic Analysis, “Interactive Data Tables.”
4. Organization for Economic Co-operation and Development (OECD), via Federal Reserve Bank of St. Louis (FRED).
FIRST-QUARTER EQUITIES
How a late-quarter geopolitical shock reversed early market leadership and reshaped the outlook for equities.
David McGrath, CFA®
As I sit here on the morning of April 1, it seems like April Fool’s Day is a fitting day to write about the stock market. It is amazing to think about the amount of news that has occurred this past quarter—and the speed at which things are currently changing. Most of the pressing concerns the market is facing today may seem very dated to someone reading this eight or 10 weeks from now.
The military action in Iran that started on February 28 changed the narrative for equity investor, and the daily status updates—and its impact on oil prices—seem to be the primary drivers of stock prices right now.
Before the war in Iran, we were having a very interesting start of the year. To help make sense of this past quarter, let’s look at the last three months in two distinct periods: before and after the start of military action in Iran.

Before Iran (Jan. 1, 2026–Feb. 27, 2026)
We started the year with some optimism that the labor market was stabilizing, inflation was under control and corporate earnings were moving higher. Some investors began to voice concern that the massive amounts of artificial intelligence spending by large growth companies was not producing the returns they'd expected. Even after very strong earnings reports, many of the “Magnificent Seven” stocks did not see gains like in previous quarters.
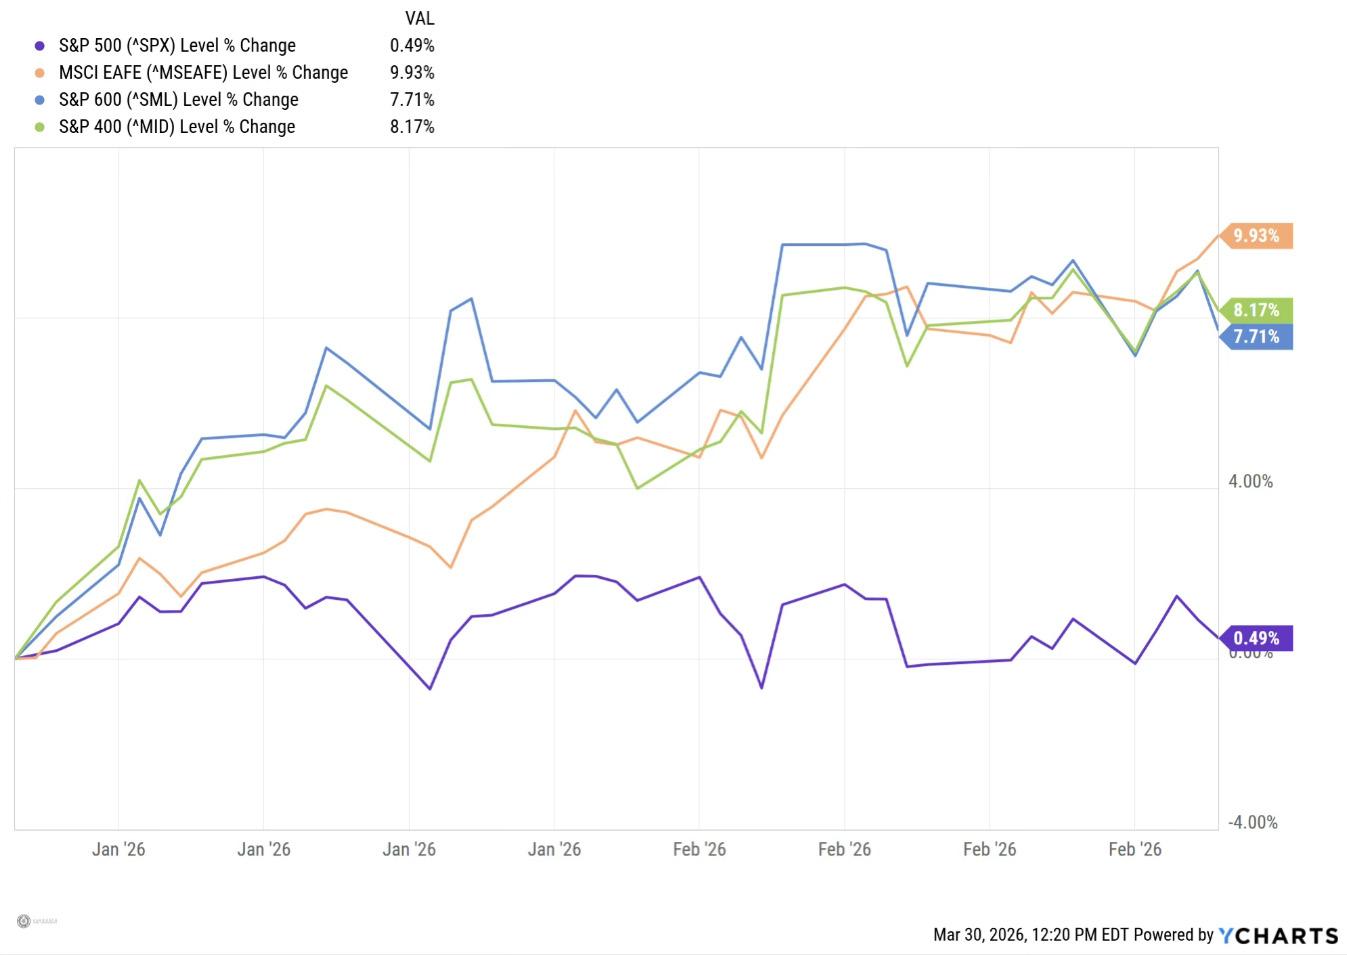
Investors who wanted exposure to the equity markets—but were concerned about having too much concentration in those massive growth stocks—began rotating into areas of the markets that have been somewhat overlooked over the past three years. Large-value sectors, smaller-cap domestic stocks and international stocks all started the year strong, while the relatively poor performance of the largest growth stocks held back the S&P 500.
Then, in early February, new plug-ins for Anthropic’s Claude AI model sparked fear that they could have a dramatic negative long-term impact on existing software companies. This led to a significant drop in most software stocks in the quarter, including declines in Microsoft (23%), Oracle (24%) and Salesforce (30%).
By the close of trading on February 27, midcap, small-cap and international indices had all advanced more than 7%, while the S&P 500 was up less than 1%.
Another story that began to unfold in 2026 was stress in the private credit market. Blue Owl, a major private credit lender, faced significant redemption requests from investors. Blue Owl, along with several other providers, was forced to
sell assets to cover those redemptions, and some firms have since limited withdrawal requests.
There is growing concern that default rates in private credit could rise as higher interest rates make it more difficult for heavily indebted borrowers to repay loans. This became a drag on financial stocks with private credit exposure, including Apollo (APO, -22.7%) and Blackstone (BX, -24.6%).
By the end of February, most investors believed that the Federal Reserve was on track to cut interest rates one or two more times in 2026. The consumer remained resilient, and confidence was growing that 2026 could be another strong one for equity investors. That confidence started to disappear on February 28.
After Iran (Feb. 29, 2026–March 31, 2026)
Joint military action between the U.S. and Israel against Iran dominated the news as we woke up on Saturday, Feb. 28. The stock market hates uncertainty, and plenty of new uncertanties were suddenly being priced in.
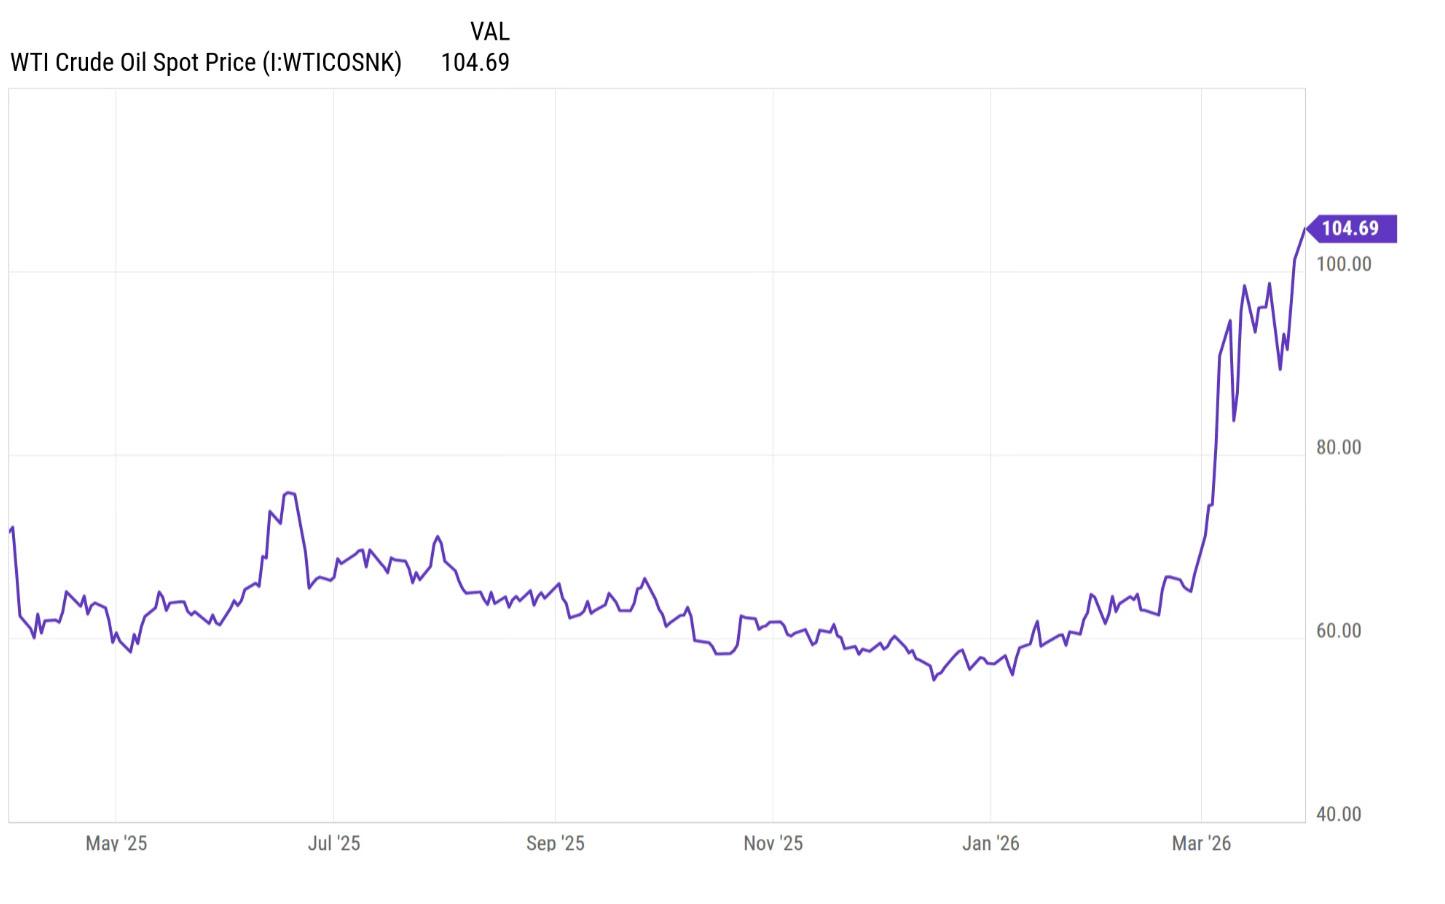
According to the International Energy Agency, around 25% of the world’s oil—roughly 20 million barrels a day—travels through the Strait of Hormuz. The sudden halt of tanker traffic through the strait caused an immediate spike in oil prices. Within a few days, the price of a barrel of West Texas Intermediate crude oil jumped from the mid-$60s to the mid-$90s.
Here are some of the questions equity investors were (and are still) asking:
• How long will military operations continue?
• Can the U.S. secure the Strait of Hormuz and maintain the flow of oil through it?
• How long can oil prices remain elevated before the resilient consumer is affected?
• How will spiking oil prices impact in flation—and how might that influence Federal Reserve interest rate policy?
Oil prices affect the entire economy because oil is a key input for manufacturing, transportation and consumer goods. Think of it as a tax on both businesses and consumers. We started the year with concerns over the health of the consumer and pesky inflation levels. A spike in oil prices is likely to put pressure on both.
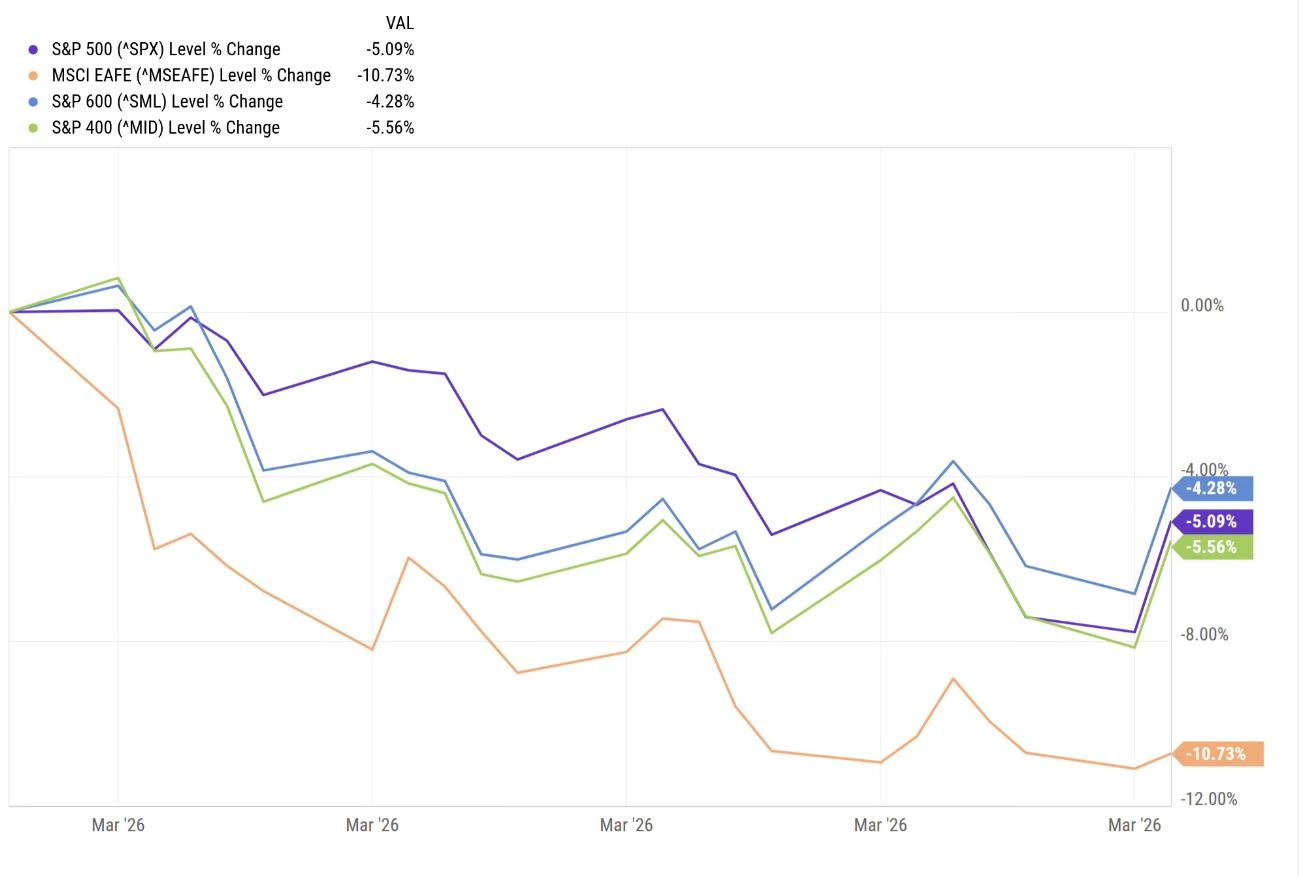
Following the military action in Iran—and the resulting rise in oil prices—all major stocks indices moved lower in unison. The mid and long end of the yield curve shifted higher, pushing mortgage rates up with them. Throughout the month of March, the focus remained squarely on Iran, with investors asking questions that, for now, have no clear answers.
For the full quarter, the S&P 500 declined 4.4%. That performance was helped by a almost 3% rally on the final day of the quarter. Both the small-cap (+3.6%) and mid-cap (+2.5%) indexes posted slightly positive returns, while the EAFE International index fell 1.1%.
Taking an optimistic viewpoint on the past quarter, six of the 11 economic sectors posted positive returns, led by the energy sector’s 38.25% gain. With oil prices spiking at the end of the quarter, it’s no surprise that energy stocks delivered the strongest performance.
Other sectors that managed positive returns over the past three months include basic materials (+9.7%), utilities (+8.3%), consumer staples (+7.7%), industrials (+4.6%) and real estate (+2.8%). The problem for the S&P 500 is that these six sectors carry the smallest weight in the index. In fact, the 224 stocks across those sectors account for only about 24% of theS&P 500’s total weight, less than the combined weight of the four largest stocks in the index (NVDA, AAPL, GOOG and MSFT).
The heavy weighting—and stellar performance—of these large-growth stocks benefited the S&P 500 over the past three years, but became a drag to performance, at least in the first quarter of 2026.
The three sectors that house the Mag 7 stocks, technology (-9.1%), consumer discretion (-9.2%) and communication services (-6.9%) all struggled in the quarter, but the worst performing sector this past quarter was financials (-9.5%).
Financial stocks faced headwinds from several fronts. As mentioned earlier, issues in private credit firms weighed on the firms with exposure to that market. Early in the year, President Donald Trump also floated the idea of capping credit card interest rates at 10%, which pressured companies that rely on credit card revenue. In addition, rising oil prices increased pressure on consumers, and growing concerns about a potential recession raised the risk of defaults across existing loan portfolios. Altogether, this perfect storm of bad news proved to be too much for the financial sector to overcome.
Looking Ahead
As we move into the second quarter, we believe markets will likely react to how the war in Iran winds down and begin to resolve some of the unknowns we faced on April Fool’s Day.
• How long will it take for the Strait of Hormuz to fully reopen?
• What will be the new price range for a barrel of oil?
• Can the consumer remain resilient through ongoing inflationand uncertainty?
• How will companies respond in terms of their workforce?
• Will we start to see an increase in layoffs?
You would think we won’t have to wait too long to start getting answers. Earnings season kicks off in earnest on April
14, when some of the largest banks report results. It’s hard to imagine management will provide overly rosy full-year guidance with so much uncertainty in the air. That doesn’t necessarily mean actual earnings will disappoint, just that companies may set a slightly lower bar for themselves.
It’s also tough to underestimate the resilience of the American consumer. In mid-March—right in the middle of spiking oil prices and long TSA lines at airports—both Delta and American Airlines raised their earnings guidance at an Airline conference hosted by J.P. Morgan, citing strong bookings. If war in the Middle East, $100+ oil prices and three-hour TSA security lines don’t change travel plans, it’s fair to wonder what will.
Source: YCharts
One takeaway from market performance in March may be that countries in Asia and Europe are more dependent on oil flowing through the Strait of Hormuz than the U.S. The longer it takes to fully reopen the strait, the more difficult it may be for international stocks to recover from the price decline seen in March.
Another data point that proved highly volatile in the first quarter was expectations for Federal Reserve interest rate policy. In just four weeks, according to CME, investor expectations shifted from an anticipated two 25-basis-point rate cuts in 2026 to the possibility of a 25-basis-point rate hike by year-end. Many believe that this dramatic reversal reflects the impact higher energy prices could have on inflation. If inflation begins to drift higher, it may make it more difficult
for the Federal Reserve to support a weakening labor market with lower interest rates.
Over the past several years, as inflation has moved above the Fed’s 2% target rate, the stock market has focused closely on each CPI and PCE inflation report. That focus will likely intensify in the second-quarter, so don’t be surprised to see increased volatility in equity markets on the days those reports are released.
When I sit down to write the second quarter stock market review on July 1, I certainly hope that I won’t need to revisit ongoing military operations in Iran. If current speculation proves correct and the conflict winds down in coming weeks, the focus will shift to restoring normal traffic
through the Strait
Hormuz.

SPECIAL REPORT: A CRUDE SITUATION IN IRAN
How a “not-quite war” Is Fueling Market Anxiety
Chris Cooper

Geopolitical tensions in the Middle East have escalated, though whether the situation qualifies as a formal war remains a matter of interpretation. Regardless of the label, financial markets have begun to price in rising risk, with oil serving as the primary transmission mechanism.
Oil influences nearly every corner of the global economy, including energy, transportation, manufacturing, pharmaceuticals and plastics. When conflict spreads in the world’s most oil-rich region, prices can rise quickly.
This development comes at a challenging time. The global economy remains in a late-cycle phase, still battling stubborn inflation tied to post-COVID supply bottlenecks and stimulus measures. Like a runner stranded on third, the expansion has come within sight of a soft landing—but can’t quite cross home. Each spike in oil prices pushes the game further into extra innings.
Beyond the human toll of conflict, the market implications have dominated headlines, driven largely by oil at a time when inflation still refuses to fully subside. The path forward appears
increasingly constrained, given current conditions. What impact has the situation in Iran had on markets, how severe could it become and what comes next?
Control the Straight, Control the Story
“In war, truth is the first casualty.”
—Aeschylus, ancient Greek tragedian
As with most fluid situations, a healthy dose of “we don’t know what we don’t know” is a useful starting point. This moment is no different.
We’ve heard a range of stated and implied objectives, including:
• Preventing Iran from obtaining a nuclear weapon
• Destroying their ballistic missile capabilities
• Diminishing their naval capacity to eliminate a military response and limit disruption in the Strait of Hormuz
• Factoring in, to a lesser extent, the potential for regime change
These objectives have been described as partially achieved, according to public statements from administration officials. Whether that holds over time remains an open question, but the market is focused on something more tangible: control of the Strait.
Threats from Iran targeting the roughly two-mile-wide shipping lanes that vessels must navigate in each direction remain. Roughly 20% of global petroleum liquids are estimated to pass through this narrow waterway, creating a clear emphasis on safe and secure passage.
To achieve this, the U.S. may pursue a longer-duration policy stance aimed at influencing stability in the region, neutralizing surface-to-surface missiles, countering clusters of fast-
A Two-Sided, Yet Handcuffed, Oil Market
attack boats, preventing mines from being laid and limiting submarine threats beneath the surface. This is not a small task, even for a highly capable military. Iran has been preparing for this type of asymmetric warfare since the late 1980s during the “Tanker War” with Iraq, refining those capabilities over decades.1 The result is a layered defense strategy designed to overwhelm and complicate any external force.
Compounding the challenge are low-cost, high-impact tools such as drone systems like the Shahed-136. These drones can inflict significant damage on critical oil infrastructure at a fraction of the cost of traditional military assets.2 Even the threat of disruption is enough to deter normal tanker traffic, especially when vessels worth approximately $100 million rely on insurance coverage that may not extend to conflict zones.
Within the global oil marketplace, there are two primary pricing benchmarks: Brent crude and West Texas Intermediate (WTI). Brent is seaborne and derived from North Sea production, making it a better barometer of OPEC+ output and Middle East tensions. WTI, priced in Cushing, Oklahoma, is influenced more heavily by U.S. domestic supply and inventory conditions. A widening Brent–WTI spread can signal tighter global seaborne supply relative to U.S. inland supply and often reflects disruption to international oil flows. As markets began pricing in potential disruption in the Strait of Hormuz, the spread between Brent and WTI widened sharply, reaching $17 per barrel intraday on March 19. 3
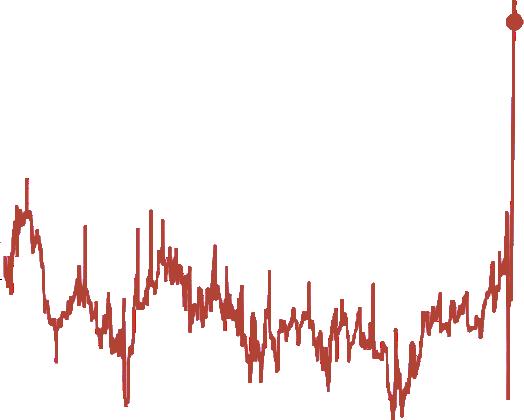
So why does Brent matter to Americans if the U.S. is among the world’s largest oil producers? While both Brent and WTI are considered “sweet” crude, logistical constraints handcuff markets. WTI is landlocked, and transportation bottlenecks can restrict efficient distribution. U.S. refining capacity, approximately 18 to 19 million barrels per day, is insufficient to meet total domestic demand using only U.S.-produced crude.
Refineries are optimized for specific blends, and building new refining capacity would take years and require significant capital investment. As a result, the U.S. continues to rely on a mix of domestic production and imported crude.
At its core, oil is a global market. Over time, arbitrage mechanisms help keep pricing relationships in check, as traders can shift supply routes and absorb transportation costs when spreads become too wide. Oil is fungible, and over time, the market works to rebalance itself.
The Cost of Higher Oil and Gulf State Partners
Even if the shipping through th e Strait of Hormuz stabilizes, oil prices may remain elevated. Longer-term pressures may persist, particularly due to the condition of oil and refining infrastructure across the region. The Islamic Revolutionary Guard Corps (IRGC), along with its proxy forces, has targeted oil infrastructure in neighboring Gulf states as part of a broader strategy to pressure oildependent economies into urging de-escalation. If securing the Strait proves to be the shorter-term challenge, infrastructure damage presents a longer-term risk. This raises the possibility that oil may struggle to return to sub-$60 levels in the near term, even in the absence of direct disruptions to shipping lanes.
Similar to how global supply chains were reassessed following COVID-19 due to over-reliance on China, a parallel realization is emerging in energy markets: diversification is no longer optional—it is necessary.
While oil shocks can still push inflation higher in the short term, their long-term impact is increasingly shaped by broader forces such as monetary policy and supply chain dynamics. Oil above $90 per barrel may contribute
to inflationary pressures, which in some scenarios could influence U.S. 10-year Treasury yields, which have been elevated above 4.3%. In turn, higher yields can act as a headwind to equity markets in certain environments, which can limit valuation expansion and weigh on corporate growth expectations.
Conclusion
Markets may respond positively to temporary pauses in conflict or optimistic rhetoric, but the underlying structure of this situation remains fragile. Control of the Strait of Hormuz is not a switch that can simply be turned on and off. It would most likely rely on a long-duration Geopolitical balancing act involving a wide-scale military operation followed by additional oversight. Even if worstcase scenarios are avoided, the margin for error appears limited under current conditions.
Fo r investors, this reinforces a familiar theme: geopolitical risks are rarely linear and seldom fully priced in at the outset. Oil prices may continue to influence inflation prints and interest rates, while global supply chains shape longerterm market outcomes.
In the meantime, markets are left doing what they do best – reacting in real time to incomplete information, attempting to price a situation where, as always, the truth is still unfolding.

Historically, oil and inflation have been closely correlated, but that relationship has become far less linear.
SOURCES :
1. Brittannica, Strait of Hormuz, accessed March 25, 2026.
2. Drone Warfare, Shahed-136: The Weapon That Rewrote the Economics of Air War, March 2026.
3. Seeking Alpha, Oil divergence: Brent-WTI spread widens, Middle East benchmarks top $150, March 20, 2026.
ASSET ALLOCATIONS
Volatility is a natural and necessary component of functioning markets.
The key is not to avoid it entirely, but to be positioned in a way that can withstand it— and ultimately take advantage of it.
Sam Clement

The first quarter of 2026 unfolded in dramatic fashion. Volatility, which began to emerge late last year, intensified and created a more challenging environment for investors. What first appeared as brief disruptions in the fourth quarter became more sustained, as markets faced a complex and often conflicting mix of signals around economic growth, inflation and monetary policy, along with ongoing geopolitical developments.
Instead of the relatively steady, upward trend seen through much of the prior year, markets experienced drawdowns, sharper rotations and a lack of sustained direction—even within a single trading day. Over all, risk assets moved lower as expectations shifted.
Equity markets showed a clear change in behavior. While broader participation across sectors remains a positive long-term trend, in the near term it contributed to more widespread declines across sectors, styles and market capitalizations. Unlike earlier periods, when weakness in some areas was offset by strength in a small group of leaders, this quarter offered fewer places to hide. Energy was one of the more resilient sectors, but declines were otherwise widespread. As volatility rises and liquidity tightens, stock movements tend to become more correlated, and that was clearly the case this quarter.
What Happened in the Markets
• Growth-oriented segments of the market, in which our portfolios have maintained an underweight po sition, were particularly vulnerable during t his quarter.
• Areas that previously benefited from multiple e xpansion and strong forward expectations faced i ncreased scrutiny as interest rates moved u npredictably and multiples contracted.
• Large-cap technology and AI-adjacent companies, w hich drove a disproportionate share of returns in prior periods, experienced more pronounced p ullbacks as the market reassessed both the timing a nd magnitude of future sustainable growth.
• In an environment where expectations were priced for n ear-perfection, even modest disappointments or s hifts in macro conditions created outsized reactions.
At the same time, more cyclical and value-oriented areas of the market were not immune to weakness. Industrials, financials and other economically sensitive sectors faced headwinds as investors recalibrated their outlook for economic growth and/or the multiple they were willing to pay. While these areas may still benefit from a longer-term normalization in market leadership, in the short term they were pressured by concerns around slowing activity, tighter financial conditions, and policy uncertainty. Small- and mid-cap stocks, which had only recently begun to show more consistent participation, also struggled as higher financing costs and reduced risk appetite weighed more heavily on these segments.
International equities, which had been a source of strength in prior quarters, similarly faced a more difficult environment. Both developed and emerging markets moved lower, influenced by a combination of global growth concerns, currency fluctuations and ongoing geopolitical uncertainty as the war in Iran drags on and influences global markets.
Volatility Persists
Rather than appearing as short-lived spikes that were quickly absorbed by the market, volatility became more persistent. Both realized and implied volatility trended higher, with markets reacting more sharply to economic data releases, central bank communication and geopolitical developments. Interest rate fluctuations played
Volatility was a defining feature of this quarter and, importantly, behaved differently than it had in prior periods.
a central role in shaping portfolio performance, while markets struggled to reconcile soft labor market data, moderating inflation trends with still-resilient economic activity and an uncertain interest rate policy path.
Our Positioning
Against this backdrop, our slightly conservative asset allocation and disciplined approach to risk management appeared to help mitigate the impact of market declines. Our positioning, which leaned neutral to modestly defensive across asset classes and maintained an underweight to higher-valuation growth equities, helped mitigate the impact of the broader market decline.
While no allocation is entirely insulated during periods of broad weakness, avoiding areas where elevated expectations and valuations left little margin for error likely helped reduce downside exposure relative to broader market movements.
Within equities, our emphasis on selectivity and valuation awareness was particularly important. Periods like this tend to expose imbalances that can grow during more benign market environments, especially in areas where optimism becomes embedded in pricing, like the AI adjacent sectors.
By maintaining a more measured exposure to growth and remaining open to opportunities across a broader set of sectors, we were positioned to navigate the volatility that bubbled up as overall market direction remained negative.
Fixed income again played an important role as a stabilizer and a diversifier, though conditions were far from steady. Interest rates—especially at the longer end of the yield curve—were volatile as markets adjusted expectations around inflation, fiscal policy and central bank actions. Longer duration bonds were especially sensitive to these shifts, with price movements reflecting even modest changes in rate expectations.
Our decision to maintain a relatively short duration allocation within fixed income contributed to overall portfolio stability and served as the ballast of the portfolio. As a reminder, the shorter the duration, the less sensitive the portfolio is to interest rate swings, and there were plenty this quarter. As rates moved higher at times and the yield curve experienced periods of steepening and flattening, shorter duration holdings may have historically provided greater stability and helped preserve capital more effectively than long bonds.
In addition to managing our duration, our continued emphasis on higher-quality fixed income was an important contributor to overall portfolio resilience. Credit spreads widened modestly during this quarter; however, they remain relatively tight from a historical perspective.
Fixed income continues to provide not just stability, but also optionality. The improved yield environment relative to recent years allows for meaningful income generation, which contributes to total return while also building the capacity to redeploy capital as opportunities arise. In a market environment where volatility is increasing and asset prices are adjusting, having this “dry powder” can provide flexibility. It allows for a more proactive—rather than reactive—approach to portfolio management.
The persistence of volatility reinforces a core principle of our investment philosophy: volatility is inherently mean-reverting, and periods of relative calm (like much of last year) are often followed by more normalized, and sometimes elevated, fluctuations (like we saw this quarter). While the exact timing and catalysts for these shifts are unpredictable, the presence of vola tility itself is not unusual.
The key is not to avoid volatility entirely, but to be positioned in a way that can withstand it and ultimately take advantage of it.
Our current allocation reflects this mindset.
• Rather than making binary or short-term directional b ets, we remain focused on maintaining a b alanced and flexible portfolio that can adapt as c onditions evolve.
• Our slightly conservative stance provides a degree of downside protection while preserving the ability to i ncrease risk exposure should valuations beco me more compelling.
• This also allows us to become more defensive if e conomic conditions deteriorate more meaningfully.
Volatility is a natural and necessary component of functioning markets.
Looking Ahead
Several key factors will continue to shape the investment landscape: Geopolitics—and the subsequent inflation trends—softening labor markets, the direction of the Federal Reserve and other central banks, as well as corporate earnings, will be an important lens through which we assess the durability of current valuations and the broader market outlook.
The first quarter represented a more complex environment for investors, marked by broader declines across asset classes. Unlike earlier periods where gains were concentrated, this quarter’s weakness was more widespread—reinforcing the importance of diversification, valuation discipline and risk management. We believe that our slightly conservative asset allocation, underweight position in higher-valuation growth stocks; and emphasis on shorter-duration, higher-quality fixed income helped mitigate downside and preserve flexibility.
While the near-term environment remains uncertain, we believe this disciplined approach positions us to navigate volatility and take advantage of opportunities as they arise.
LIFETIME TAX PLANNING: STRATEGIES
THAT MAY HELP REDUCE INCOME TAXES OVER TIME

Mac Frasier, CFP ®
For many high-income and high-net-worth families, tax planning often centers on familiar year-end techniques: deferring income, maximizing deductions and harvesting capital losses. These strategies can be valuable tools. However, they are typically focused on a single calendar year.
Lifetime tax planning takes a broader view and requires coordination with multiple financial professionals. Rather than asking, “How do we reduce this year’s tax bill?” the more strategic question becomes: “How do we manage taxes across decades—during peak earning years, retirement, a business transition and ultimately the transfer of wealth?”
Because income levels, tax laws, asset values and family goals evolve over time, planning opportunities also change. Thoughtful coordination among your wealth adviser, CPA and estate planning attorney can help identify when certain strategies may be more advantageous—and when they may not be appropriate.
The following are several areas where a lifetime approach may create meaningful planning opportunities.
1Managing Tax Brackets Across Life Stages
Chances are your current tax bracket is different from where you were 10 years ago and may not be where you will be 10 years from now.
Income tends to fluctuate through different life phases:
• Early career growth
• Peak earning years
• Business liquidity events
• Retirement income transitions/Required Minimum Distributions (RMD)
Each phase may present different tax planning opportunities. For example, lower-income years may create room to consider:
• Roth conversions
• Realizing long-term capital gains
• Exercising stock options
• Accelerating income intentionally
Conversely, unusually high-income years may create planning opportunities to defer income, bunch deductions or coordinate charitable strategies more strategically.
2
Strategic Charitable Giving
Charitable giving remains an important consideration in tax-aware planning. However, many taxpayers approach it as a December activity instead of an integrated strategy.
A more intentional approach may include:
Donating Appreciated Assets Instead of Cash
When appropriate, gifting appreciated securities directly to charity may allow you to:
• Avoid recognizing capital gains on the donated asset
• Receive a charitable deduction (subject to IRS limits)
• Rebalance or diversify concentrated holdings
For example, instead of donating $30,000 in cash, a donor might transfer $30,000 of highly appreciated stock. The charity receives full value, and the donor may avoid realizing capital gains that would otherwise occur upon sale. The cash that would have been donated can then be used to reinvest in a more diverse allocation.
This strategy can be particularly relevant for executives or business owners with concentrated positions.
Donor-Advised Funds (DAFs)
Donor-advised funds may allow families to bunch multiple years of charitable contributions into a single high-income year while distributing grants to charities over time.
This may be useful during:
• Business liquidity events
• Years with large bonus income
• Stock option exercises
• Significant Roth conversions
DAFs can also simplify recordkeeping and support a longterm family giving strategy.
Qualified Charitable Distributions (QCDs)
Starting at age 70½, individuals may make Qualified Charitable Distributions directly from an IRA to eligible charities. For 2026, the annual limit is $111,000 per person (subject to IRS adjustments each year).
When structured properly, QCDs may:
• Satisfy required minimum distributions
• Reduce taxable income
• Support charitable goals efficiently
For charitably inclined retirees, QCDs can be a useful planning strategy, especially for those who no longer itemize deductions.
Charitable Planning Within Estate Strategies
While this article focuses on income taxes, estate planning remains a critical component of lifetime tax strategy. For example:
• Naming charities as beneficiaries of traditional IRAs
• Structuring charitable bequests in a will or trust
• Coordinating lifetime giving with estate objectives
3
Intentional Capital Gains Planning
Avoiding capital gains at all costs is not always optimal. In many cases, being strategic about when to recognize gains may be more effective.
Opportunities may include:
Realizing Gains in Lower-Income Years
During years with reduced income, such as early retirement or transitional periods, you may be able to realize long-term capital gains at more favorable tax rates.
Coordinating Gains with Losses
Tax-loss harvesting can help offset realized gains and potentially reduce taxable income. When done thoughtfully and aligned with your investment strategy, it can improve tax efficiency over time.
Step-Up in Basis Considerations
For highly appreciated assets intended to be held long term, current law provides for a step-up in basis at death. While this should not be the sole reason to hold an investment, it may influence decisions around selling versus retaining certain assets, particularly in estate planning contexts.
As always, tax laws are subject to change, and these strategies should be evaluated within your broader financial plan.
4
Business Exit Planning
For business owners, a liquidity event often represents both:
• The largest financial transaction of their lifetime
• The largest tax liability of their lifetime
The structure of a business sale can significantly impact after-tax proceeds. Decisions regarding entity type, deal structure,
installment sales, Qualified Small Business Stock (QSBS), charitable planning and retirement plan contributions may all influence outcomes.
One of the most common mistakes in exit planning is addressing tax consequences too late in the process. In many cases, meaningful planning opportunities must be implemented years in advance of a transaction.
The objective is rarely to eliminate taxes entirely. Instead, the goal is to create a controlled and coordinated strategy that aligns:
• Personal cash flow needs
• Investment strategy
• Estate planning goals
• Philanthropic objectives
• Long-term legacy planning
Proactive planning often provides more flexibility than reactive planning.
A Coordinated Approach
Reducing lifetime taxes is rarely accomplished through a single tactic. It is typically the result of coordinated decisions made over many years.
Effective planning often involves:
• Financial planners modeling multi-decade scenarios
• CPAs evaluating current and projected tax impacts
• Estate attorneys aligning structures with family goals
This team-based approach can help ensure that investment strategy, income planning, charitable goals and estate considerations are aligned.
Taking the Next Step
For families with significant assets, equity compensation or closely held business interests, lifetime tax planning can play a meaningful role in long-term financial outcomes.
At Oakworth, our role is to integrate tax-aware planning into a comprehensive financial strategy in collaboration with your CPA and estate planning attorney so that decisions made today support your long-term objectives.
When it comes to taxes, the question isn’t simply how much you paid last year. It’s how intentionally you are planning for the decades ahead.
IMPORTANT CONSIDERATIONS

Tax laws are complex and subject to change. The strategies discussed above may not be appropriate for every investor. Any implementation should be coordinated with your tax professional and legal advisers based on your specific circumstances.
Nothing in this article is intended as tax or legal advice. It is provided for educational purposes to illustrate planning concepts that may be relevant for certain high-income or high-net-worth families.
PREDICTIONS FOR SECOND QUARTER 2026
From oil shocks to AI—and even a shake up in the snack food aisle— our investment committee sees a “low-hire, low-fire” economy, a weaker dollar, and a cautious Fed shaping the second quarter of 2026.

• The federal funds futures market has recently behaved as though the rise in crude oil prices will be sustained. That may not be the case. In our opinion, if tensions in the Middle East ease, oil prices could decline from current levels.
• After a difficult March, our view is that precious metals may stabilize as the year progresses. The long-term case remains intact: global debt levels are elevated, while the supply of gold and silver is limited. By contrast, central banks can expand the money supply, which continues to support demand for hard assets.
• The midterm elections in November are likely to reflect voter sentiment surrounding President Donald Trump. Given the political dynamics seen since 2016, this is not a particularly bold prediction.
• In sports, the Los Angeles Dodgers are widely viewed as the favorites to win the 2026 World Series. By contrast, the Colorado Rockies—and Oakworth’s investment committee—are not expected to contend for the title.
• There is little evidence to suggest a sharp increase in corporate hiring. At the same time, we are of the opinion that the Federal Reserve is unlikely to cut interest rates aggressively. Companies continue to adopt artificial intelligence to improve efficiency, while maintaining pressure to grow profits. As a result, the “low-hire, lowfire” economy is likely to persist in the near term.
• International equities outperformed U.S. markets in 2025, largely due to a weaker U.S. dollar and Federal Reserve rate cuts. If the Fed is less aggressive in cutting rates this year—or begins raising them—foreign markets may struggle to match that performance.
• Political uncertainty continues to complicate economic forecasting. Policy direction remains difficult to predict, which adds another layer of risk for investors.
• Since mid-2023, both the U.S. economy and equity markets have benefited from a more accommodative Federal Reserve. If monetary policy becomes less supportive in 2026, the strong market returns of recent years may be harder to sustain.
• Private credit markets could face increased volatility as investors grow more cautious. If redemptions rise, fund managers may be forced to sell assets at unfavorable prices, potentially putting additional pressure on valuations.
• Conventional thinking suggests that higher oil prices could push inflation higher and lead to rising longterm interest rates. However, the long-term correlation between crude oil prices and the 10-year U.S. Treasury note is modest. As a result, the relationship between energy prices and broader inflation may not be as direct as commonly assumed.
• Predictions of the U.S. dollar’s decline are likely to continue throughout the year. However, those making such forecasts must answer a fundamental question: What is the alternative? While the dollar may not remain dominant indefinitely, there is currently no clear replacement capable of supporting global capital flows.
• As artificial intelligence continues to evolve, policymakers are likely to pursue increased regulation. This approach may resonate with risk-averse voters and could become a prominent issue in the upcoming election cycle. While technological change can be disruptive, a lack of innovation may pose even greater long-term risks.
• Finally, the growing use of GLP-1 weight-loss medications could reshape the food industry. Companies may adjust both product offerings and marketing strategies to reflect changing consumer behavior. This could lead to reformulated products and new messaging aimed at health-conscious consumers.

SOURCES:
1. CME Group, CME FedWatch Tool, accessed March 28, 2026.
2. CLA (CliftonLarsonAllen LLP), “Looking Ahead: Will Gold and Silver Stay Shiny or Become Rusty?” Feb. 10, 2026.
3. ESPN, “Every MLB team’s odds to win the 2026 World Series: Dodgers remain favorites for repeat,” by Doug Greenberg, March 25, 2026.
4. MarketWatch, “CEOs say they won’t add many jobs in 2026. Is a low-hire, low-fire labor market the new norm?” Feb. 26, 2026.
5. BlackRock, “Investing in international equities,” accessed March 28, 2026.
6. Investopedia, “How Interest Rates Affect the Stock Market,” accessed March 28, 2026.
7. CNBC, “Private credit defaults, loan quality and debt risk raise concerns about systemic issues as AI disruption looms,” March 25, 2026.
8. Associated Press, “High oil prices knock down stocks and erase Wall Street’s hopes for a cut to interest rates,” March 20, 2026.
9. Polish Institute of International Affairs, “Alternatives to the U.S. Dollar as a Global Currency Face Brick Walls,” April 18, 2024.
10. The New York Times, “Backed by Anthropic, a Super PAC Group Begins an Ad Blitz in Support of A.I. Regulation,” Feb. 23, 2026.

Central Alabama Office
850 Shades Creek Parkway Birmingham, Alabama 35209
Phone: (205) 263-4700
South Alabama Office
1 St. Louis Street, Suite 3200 Mobile, Alabama 36602
Phone: (251) 375-7800
Central Carolinas Office
6000 Fairview Road, Suite 125 Charlotte, North Carolina 28210
Phone: (704) 901-7250
Middle Tennessee Office
5511 Virginia Way, Suite 110
Brentwood, TN 37027
Phone: (615) 760-1000


Advisory Services, including investment management and financial planning, are offered through Oakworth Asset Management LLC a registered investment advisor and is owned by Oakworth Capital Bank, Member FDIC. Investment products and services offered via Oakworth Asset Management LLC are independent of the products and services offered by Oakworth Capital Bank, and are not FDIC insured, may lose value, have no bank guarantee, and are not insured by any federal or state government agency. Because of the ownership relationship and involvement by Oakworth Asset Management LLC associates with Oakworth Capital Bank, there exists a conflict of interest to the extent that either party recommends the services of the other. Oakworth Asset Management LLC does not provide tax or legal advice. You should consult your tax advisor, accountant, and/or attorney before making any decisions with tax or legal implications. For additional information about Oakworth Asset Management LLC, including its services and fees, send for the firm’s disclosure brochure using the contact information contained herein or visit advisorinfo.sec.gov
This communication contains general information that is not suitable for everyone and was prepared for informational purposes only. Nothing contained herein should be construed as a solicitation to buy or sell any security or as an offer to provide investment advice. The information contained herein is based upon certain assumptions, theories and principles that do not completely or accurately reflect any one client situation. This communication contains certain forward-looking statements that indicate future possibilities. Due to known and unknown risks, other uncertainties and factors, actual results may differ. As such, there is no guarantee that any views and opinions expressed herein will come to pass. Investing involves risk of loss including loss of principal. Past investment performance is not a guarantee or predictor of future investment performance.
Any reference to a market index is included for illustrative purposes only as it is not possible to directly invest in an index. The figures for each index reflect the reinvestment of dividends, as applicable, but do not reflect the deduction of any fees or expenses, the incurrence of which would reduce returns. It should not be assumed that your account performance or the volatility of any securities held in your account will correspond directly to any comparative benchmark index. This communication contains information derived from third party sources. Although we believe these sources to be reliable, we make no representations as to their accuracy or completeness.
All opinions and/or views reflect the judgment of the authors as of the publication date and are subject to change without notice.