DAIRY MARKET REPORT VOLUME 28 | ISSUE 12
12/22/2025
EDITOR’S NOTE Some of the data normally reported in the Dairy Market Report is still delayed due to the recent government shutdown. This issue reports the latest dairy data available.
OVERVIEW Falling milk prices spurred largely by an imbalance between milkfat supply and demand have continued in recent months and may continue into 2026. U.S. fluid milk sales in October were just 0.1% lower than a year earlier. Total domestic commercial use of milkfat was down moderately from a year earlier during June-August, while total skim solids use rose by 3%. U.S. exports of butter and American-type cheese were up by triple-digit percentages during July-September. Total U.S. milkfat production grew by 5.5% from a year earlier during August-October, almost two percentage points faster than liquid milk production during the same period. U.S. cheddar cheese production rose 3.2% year-over-year during August-October, down considerably from its 8.8% annual growth rate during May-July. Prices for cheese, nonfat dry milk and dry whey showed moderate changes from September to November, but butter prices dropped by over $0.40/lb during the same period. Overall retail price inflation ticked down to a 2.7% year-over-year gain in November, while average retail dairy product prices dropped by 1.6% that month. The DMC margin dropped by $1/cwt from August to October, to $10.52/cwt, mostly on a drop of $0.90/cwt in the all-milk price, to $20/cwt.
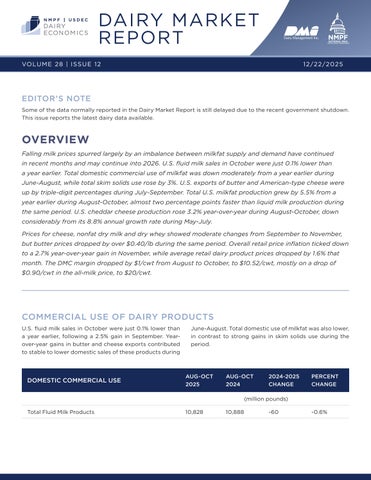
COMMERCIAL USE OF DAIRY PRODUCTS U.S. fluid milk sales in October were just 0.1% lower than a year earlier, following a 2.5% gain in September. Yearover-year gains in butter and cheese exports contributed to stable to lower domestic sales of these products during
DOMESTIC COMMERCIAL USE
June-August. Total domestic use of milkfat was also lower, in contrast to strong gains in skim solids use during the period.
AUG-OCT 2025
AUG-OCT 2024
2024-2025 CHANGE
PERCENT CHANGE
(million pounds) Total Fluid Milk Products
10,828
10,888
-60
-0.6%
DOMESTIC COMMERCIAL USE
JUN-AUG 2025
JUN-AUG 2024
2024-2025 CHANGE
PERCENT CHANGE
(million pounds) Yogurt
1,350
1,231
118
9.6%
Butter
567
567
0
0.0%
American-type Cheese
1,342
1,374
-32
-2.4%
All Other Cheese
1,940
2,019
-79
-3.9%
Total Cheese
3,282
3,393
-112
-3.3%
Dry Skim Milk
163
133
30
22.3%
All Products (milk equiv., milkfat basis)
56,133
56,534
-401
-0.7%
All Products (milk equiv., skim solids basis)
47,292
45,918
1,374
3.0%
All Products (milk equiv., total solids basis)
50,084
49,241
843
1.7%
U.S. DAIRY TRADE Despite continued triple-digit percentage gains in butter and American-type cheese exports, total U.S. dairy exports have dropped moderately month-to-month from June through September on a milk solids equivalent basis. Exports of dry skim milk, lactose, whey protein concentrate and modified whey were important contributors to this downward trend.
U.S. DAIRY EXPORTS
Total U.S. dairy imports, as well as those of the major imported dairy products, continued to decline by double digit percentages during July-September, with the exception of casein.
JUL-SEP 2025
JUL-SEP 2024
2024-2025 CHANGE
PERCENT CHANGE
(metric tons)
2
Butter
23,237
8,041
15,196
189%
Anhydrous Milk Fat/Butteroil
8,694
4,814
3,880
81%
American-type Cheese
30,601
12,916
17,686
137%
Cheddar Cheese
30,488
12,842
17,647
137%
All Other Cheese
128,468
108,887
19,581
18%
Total Cheese
159,069
121,803
37,267
31%
Dry Skim Milk
166,750
201,416
-34,666
-17%
Whole Milk Powder
8,264
6,521
1,744
27%
Dry Whey
53,025
47,302
5,723
12%
Whey Protein Concentrate/Isolate
55,771
58,543
-2,772
-5%
Lactose
111,168
108,796
2,372
2%
Percent of U.S. Milk Solids Exported
17.0%
17.3%
-0.3%
-2%
U.S. DAIRY IMPORTS
JUL-SEP 2025
JUL-SEP 2024
2024-2025 CHANGE
PERCENT CHANGE
(metric tons) Butter
8,716
19,637
-10,921
-56%
Cheese
45,156
55,460
-10,304
-19%
Dry Skim Milk
501
160
342
214%
MPC (all protein levels)
13,103
13,234
-130
-1%
Casein
14,193
12,391
1,803
15%
Percent of U.S. Milk Solids Imported
3.3%
3.9%
-0.6%
-15%
MILK PRODUCTION Total U.S. milkfat production grew by 5.5% from a year earlier during August-October, almost two percentage points faster than liquid milk production during the same period. Growth
in milk cow numbers outpaced growth in milk production per cow in fueling the total milk production growth during the period.
MILK PRODUCTION
AUG-OCT 2025
AUG-OCT 2024
2024-2025 CHANGE
PERCENT CHANGE
Cows (1,000 head)
9,566
9,355
211
2.3%
Per Cow (pounds)
6,059
5,979
80
1.3%
Total Milk (million pounds)
57,969
55,942
2,027
3.6%
Total Milkfat (million pounds)
2,464
2,335
129
5.5%
Milkfat Composition of Milk (percent)
4.2%
4.2%
0.1%
1.8%
DAIRY PRODUCTS U.S. cheddar cheese production rose 3.2% year-over-year during August-October, down considerably from its 8.8% annual growth rate during May-July. Butter production annual growth, by contrast, increased to 9.9% from 7.8%
DAIRY PRODUCTS PRODUCTION
during the same respective periods. Export-focused skim milk powder production continued to drop by double-digit percentages during the most recently-reported period.
AUG-OCT 2025
AUG-OCT 2024
3
PERCENT CHANGE
(million pounds)
Cheese American Types
2024-2025 CHANGE
1,442
1,402
40
2.9%
Cheddar
978
948
30
3.2%
Italian Types
1,562
1,500
61
4.1%
Mozzarella
1,227
1,198
29
2.4%
All Other Types
675
667
8
1.2%
Total Cheese
3,678
3,569
110
3.1%
DAIRY PRODUCTS PRODUCTION
AUG-OCT 2025
AUG-OCT 2024
2024-2025 CHANGE
PERCENT CHANGE
Butter
538
489
49
9.9%
Nonfat Dry Milk
364
357
7
2.0%
Skim Milk Powder
121
142
-21
-14.6%
Dry Whey
205
200
6
2.8%
Whey Protein Concentrate
123
123
0
0.3%
Dry Milk Products
DAIRY PRODUCT INVENTORIES Despite the continued fast pace of overall milk and milk solids production growth, October-ending stocks of dry skim milk
DAIRY PRODUCT INVENTORIES
and whey products were nevertheless reported as stable to lower compared with both a month as well as a year earlier.
OCT 2025
SEP 2025
OCT 2024
2024-2025 CHANGE
(million pounds) Dry Skim Milk
216
229
243
-11%
Dry Whey
50
50
51
-1%
Whey Protein Concentrate
45
51
51
-11%
DAIRY PRODUCT AND FEDERAL ORDER CLASS PRICES The NDPSR-reported prices for cheese and nonfat dry milk each showed small monthly increases in November following larger drops the month before from September. Dry whey prices increased both months, especially in November. The net changes over the two months for all three products were almost the same, between $0.06 and $0.07 per pound in their respective directions. Butter prices reacted much more spectacularly, dropping significantly both months, down a total of more than $0.40/lb. The federal order class prices fell over the two months for totals ranging from roughly $2 to $3 per hundredweight, with the exception of Class III, which lost a net of just $0.41/cwt.
DAIRY PRODUCT AND FEDERAL ORDER PRICES
Retail price inflation, measured by its standard measure of year-over-year change in the Consumer Price Index (CPI) for all items, was 2.7% in November, down from 3.0% in September (the Bureau of Labor Statistics did not report retail price data for October due to the recent shutdown). The corresponding annual changes in the November CPIs for all food and beverages and for all dairy products were 2.6% and -1.6%. For individual dairy product categories, the changes reported for November ranged from -0.2% for lowfat milk to -4.4% for butter.
NOV 2025
OCT 2025
2024-2025 CHANGE
(per pound)
NDPSR Dairy Product Prices Butter
$1.636
$1.734
$2.700
-$1.064
Cheddar Cheese
$1.742
$1.738
$1.920
-$0.178
$1.742
$1.738
$1.910
-$0.168
40-Pound Blocks 4
NOV 2024
NOV 2025
OCT 2025
NOV 2024
2024-2025 CHANGE
Nonfat Dry Milk
$1.161
$1.160
$1.377
-$0.216
Dry Whey
$0.642
$0.593
$0.592
$0.049
DAIRY PRODUCT AND FEDERAL ORDER PRICES
(per hundredweight)
Federal Order Class Prices for Milk Class I Base
$16.75
$18.04
$22.53
-$5.78
Class I Base (Effective for ESL Milk)
$16.76
$18.97
$22.53
-$5.77
Class II
$14.54
$16.02
$21.52
-$6.98
Class III
$17.18
$16.91
$19.95
-$2.77
Class IV
$13.89
$14.30
$21.12
-$7.23
Fluid Whole Milk (per gallon)
$3.997
N/A
$4.138
-$0.141
Lowfat Fluid Milk (per gallon)
$3.410
N/A
$3.866
-$0.456
Cheddar Cheese (per pound)
$5.636
N/A
$5.676
-$0.040
Butter (per pound)
$4.310
N/A
$4.794
-$0.484
Retail Dairy Product Prices
MILK AND FEED PRICES DMC margins for September and October were $10.87/cwt and $10.52/cwt, respectively, falling a total of one dollar from August’s margin of $11.52/cwt. The drops were driven mostly by milk prices declining from $20.90/cwt to $20.40/ cwt and $20.00/cwt, respectively, while the DMC feed cost
calculation stayed relatively steady in the mid-$9/cwt range. Continued milk-price declines are projected to push the DMC margin below the $9.50/cwt trigger for payments in December.
OCT 2025
SEP 2025
OCT 2024
2024-2025 CHANGE
$20.00
$20.40
$25.20
-$5.20
Corn (per bushel)
$3.93
$4.00
$3.99
-$0.06
Soybean Meal (per ton)
$301
$301
$343
-$42
Premium Alfalfa Hay (per ton)
$223
$221
$236
-$13
Corn
$4.22
$4.29
$4.28
-$0.06
Soybean Meal
$2.21
$2.21
$2.52
-$0.31
Premium Alfalfa Hay
$3.06
$3.03
$3.23
-$0.18
DMC Feed Cost* (per cwt.)
$9.48
$9.53
$10.03
-$0.55
DMC Margin* (per cwt.)
$10.52
$10.87
$15.17
-$4.65
MILK AND FEED PRICES Producer Prices All Milk (per cwt.) Feed Prices
Feed Prices (per cwt of milk)
*DMC calculations are not revised 5
LOOKING AHEAD USDA’s monthly World Agricultural Supply and Demand Estimates (WASDE) report for December indicates the department forsees the accelerating buildup in milk production this year transitioning to more stable growth. It kept its 2025 milk production forecast unchanged from the month before and lowered its forecast for 2026 production, as it forsees lower cow numbers next year. The latest estimate projects that annual milk production will grow this year by 2.4% from last year and that next year’s production will be 1.2% higher than this year’s. The December WASDE report is generally bearish on dairy product prices, and decidedly so on milk prices. It estimates that annual average milk prices will drop in two steps from 2024 to 2026, by a total of $1.85/cwt for Class III, $6.35/cwt for Class IV, and $3.80/cwt for the all-milk price.
Dairy Management Inc.™ and state, regional, and international organizations work together to drive demand for dairy products on behalf of America’s dairy farmers, through the programs of the American Dairy Association®, the National Dairy Council®, and the U.S. Dairy Export Council®. Peter Vitaliano, National Milk Producers Federation pvitaliano@nmpf.org www.nmpf.org
6
The National Milk Producers Federation (NMPF) develops and carries out policies that advance dairy producers and the cooperatives they own. NMPF’s member cooperatives produce more than two-thirds of U.S. milk, making NMPF dairy’s voice on Capitol Hill and with government agencies.