After starting the year in a funk, dairy product prices have noticeably improved even as milk production remains robust, increasing 3.4% in January on a liquid basis. While the milking herd continues to grow, component growth surprisingly decelerated to start 2026, indicating that producers are responding to strong economic incentives from beef-on-dairy but not pushing for maximum milkfat tests with the fall in butter prices. Despite heavy milk production, dairy product supplies and inventories are not overly burdensome. In fact, nonfat dry milk prices are rising due to limited supply, and butter is finding support due to reported low inventories. Domestic demand for dairy proteins remains remarkable, as consumers turn to products like cottage cheese, Greek yogurt and high protein beverages to support health goals. With vigorous domestic protein demand and growing milkfat exports, signs are indicating that the U.S. is moving back towards balance. While DMC margins dipped to $7.81/cwt in January, recent commodity price increases should provide a much-needed boost to margins in the coming months.
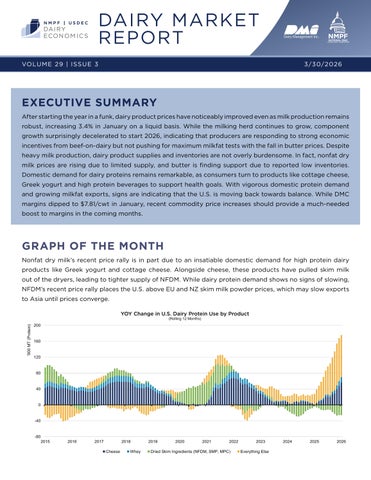
GRAPH OF THE MONTH
Nonfat dry milk’s recent price rally is in part due to an insatiable domestic demand for high protein dairy products like Greek yogurt and cottage cheese. Alongside cheese, these products have pulled skim milk out of the dryers, leading to tighter supply of NFDM. While dairy protein demand shows no signs of slowing, NFDM’s recent price rally places the U.S. above EU and NZ skim milk powder prices, which may slow exports to Asia until prices converge.
PRICES
The first months of 2026 have brought a price rally in butter, cheese, and nonfat dry milk. Despite 2025’s heavy milk production, lower-than-expected supplies of butter and nonfat dry milk are supporting prices. Exponential export growth in 2025 helped support a rebalancing in the balance sheet for butter, while surging demand for dairy proteins in Class II products reduced production of milk powders. Signs of improving domestic demand supported cheese’s rally alongside continued export strength. Even dry whey prices, which have eased modestly in early 2026, are still elevated compared to historical levels.
MARKET COMMENTARY
CHEESE
In 2025, domestic demand for cheese eased as consumers pulled back from food service spending, but increasing exports (+23% in 2025) largely compensated for that volume. More recently, indicators are showing a rebound in domestic demand. Most notably, USDA’s Supply and Utilization report showed growing domestic use of cheese for the third straight month. Still, strong milk production is keeping cheese vats busy. Even if domestic demand continues to strengthen (+5% in January) and exports continue to surge (+11% in January), high cheese production may limit price upside.
WHEY
In contrast to butter, cheese, and dry skim milk, whey prices have eased modestly but remain near the upper bound of historical ranges. Some of the relative softness could be attributed to inventories sitting 4% above prior year levels in January, even as they remain at historically low levels. Positively, further downside is likely limited. With European sweet whey prices climbing, the U.S. should see a surge in dry whey exports, particularly to Southeast Asia. With demand for high protein whey so strong, whey protein concentrates and isolates are continuing to be prioritized over dry whey, likely limiting supply.
BUTTER
Even as milkfat tests failed to grow at a normal pace, butter production jumped 6% in January. Despite the production increase, butter inventories have noticeably tightened (12% lower than in January 2025), helping butter prices rally. Strong exports orders have helped balance the market, as evidenced by January exports nearly tripling over prior year levels. Exporters are likely to maintain these volumes as many buyers have prebooked deliveries well into 2026. However, one X-factor to keep an eye on remains the conflict in the Middle East, as around 15% of U.S. butter exports in 2025 were destined for markets that are currently affected by the closure of the Strait of Hormuz. While those exports are not expected to disappear entirely, new business is likely to be limited while the conflict continues.
NONFAT DRY MILK/SKIM MILK POWDER
Despite the fact that U.S. milk production was up 3.4% in January, nonfat dry milk production continued to slide. As noted in the Graph of the Month, extraordinary demand for high-protein products such as Greek yogurt, cottage cheese, and ultrafiltered milk is pulling protein out the dryers, limiting production of nonfat dry milk. This reduction in supply is supporting NFDM’s current price rally as buyers compete for product. Looking ahead, limited supply is likely to only support higher prices so far as U.S. prices are now sharply higher than other major exporters, and with over 70% of U.S. NFDM/SMP exported, a convergence in global prices is expected at some point in order to maintain export sales.
CHEESE — JANUARY 2026
WHEY — JANUARY 2026
BUTTER —
JANUARY 2026
NONFAT DRY MILK/SKIM MILK POWDER — JANUARY 2026
FLUID MILK
In keeping with a years-long trend, total fluid milk sales fell 2.3% since January 2025. Within the category, organic milk sales fell 5.4% while conventional milk sales decreased by 2.1%. However, whole milk sales rose 1.6%, a figure likely to be bolstered later this year as schools start to incorporate whole milk into their meal plans thanks to the passage of the Whole Milk for Healthy Kids Act. Looking specifically at retail sales data, fluid milk sales eased 0.5% in 2025, but an increase of 3% in whole milk sales boosted the category overall, according to Circana. Products with lactose free claims saw 6% growth in 2025.
CULTURED AND SOFT PRODUCTS
Yogurt and cottage cheese production continue to soar, increasing 6% and 12%, respectively in January, as U.S. consumers continued to look to dairy for high protein options. Circana data suggests that production is barely keeping up with consumer demand, as retail yogurt sales increased 8% in 2025, and cottage cheese sales rose by a remarkable 14%. Consumers particularly favored higher protein Greek yogurt, which saw an 18% increase in sales in 2025 and a 40% gain since January 2024. This demand surge once again helps explain the rapid improvement in NFDM prices, and thus Class IV.
MILK PRODUCTION
Milk production carried its 2025 trends into the new year, with overall production up 3.4%. More surprisingly though, milkfat component growth decelerated, growing only 0.02% year-over-year, as lower butter prices incentivized a change in the ration. For context, butterfat tests rose by 0.11% year-over-year in January 2025. Furthermore, the protein test for milk pooled in the Federal Milk Marketing Orders registered a 0.04% increase since January 2025, the second month in a row in which the increase in the protein test was higher than the milkfat test.
While we are seeing a response to lower prices through slowing component growth, the dairy herd remains sizeable. With beef-on-dairy providing significant support to farm income, producers have added 209,000 milk cows since January 2025, and 34,000 since December, even as margins tightened.
Looking ahead, so long as beef prices remain high, a dairy herd reduction appears unlikely unless milk margins see a significant drop, which also seems unlikely in the near term. Furthermore, with the improvement in the butter price from the low-ebb in January, we anticipate economic signals will once again incentivize dairy farmers and their nutritionists to adjust rations to spur butterfat production. As such, we expect plenty of milk through the flush.
ADJACENT MARKETS
• Corn futures have risen throughout February and March as producers are expected to plant fewer corn acres and conflict in the Middle East constrains fertilizer availability. Soybean meal futures have not seen the same increase.
• The CME Feeder Cattle Index remains elevated but has eased modestly since February.
• Conflict in the Middle East has caused crude oil prices to increase sharply as supplies originating from the Persian Gulf are unable to pass through the Strait of Hormuz.
MAY 2026 CBOT CORN FUTURES MAY 2026 CBOT SOYBEAN MEAL FUTURES
WEST TEXAS INTERMEDIATE CRUDE OIL SPOT PRICE CME FEEDER CATTLE INDEX
Sources: CBOT, CME, EIA
DAIRY MARGIN COVERAGE
DMC Margins dipped to $7.81/cwt in January, largely driven by a $1.50/cwt decrease in the All Milk Price since December. Futures suggest January will be the lowest-margin month for 2026, with a relative increase in margins expected in February to around $8.86/cwt and margins over the $9.50/cwt maximum payment threshold by April.
CONSUMER DEMAND INDICATORS
Consumers are facing a moderately challenging economic environment as prices for goods across the economy remain elevated and the labor market has weakened slightly. Concerns arising from geopolitical shocks to energy and oil markets have stalled interest rate reductions from the Federal Reserve as inflation fears return. The Consumer Confidence Index, which fell 14.4% since January 2025, demonstrates that consumers are feeling pressure, helping explain the pullback in discretionary spending. Positively for consumers, dairy products are offering some inflationary relief, with average retail prices falling since last January.
LOOKING AHEAD
Milk production is expected to remain ample in the coming months, driven by a large number of milk cows. Exports provided a destination for much of the additional production throughout 2025, particularly in cheese and butter, and are expected to continue to do so. If recent trends continue, export growth would be compounded by a rebound in domestic consumption of cheese and butter, all of which would encourage higher prices. The price rally in butter, cheese, and NFDM provides hope for producers that milk checks will gradually strengthen over the course of 2026. Still, while DMC margins are forecasted to increase, high corn and crude oil futures prices may increase feed and transportation costs for dairy producers.
Dairy Management Inc.™ and state, regional, and international organizations work together to drive demand for dairy products on behalf of America’s dairy farmers, through the programs of the American Dairy Association®, the National Dairy Council ® , and the U.S. Dairy Export Council ®
Katriel Marks-Yant, National Milk Producers Federation kmarksyant@nmpf.org www.nmpf.org
The National Milk Producers Federation (NMPF) develops and carries out policies that advance dairy producers and the cooperatives they own. NMPF’s member cooperatives produce more than two-thirds of U.S. milk, making NMPF dairy’s voice on Capitol Hill and with government agencies.