
Dairy Market Report - April 2026

Page 1


DAIRY MARKET REPORT

VOLUME 29 | ISSUE 4

EXECUTIVE SUMMARY

4/27/2026

Dairy product prices have continued to gain strength even as milk production grew 2.9% on a liquid basis in February. While milk supplies weighed on markets in 2025, new processing capacity coming online in early 2026 has funneled milk towards product production. Even as dairy product production grows, demand is growing for most products, both domestically and abroad. Butter, cheese, and dry whey showed growth in both domestic use and exports in February. Despite recent focus on high-protein products, butter had a particularly strong month, with exports up 94% and domestic use up 15% year-over-year. Healthy demand for dairy products is supporting commodity prices at the CME, with all except dry whey posting monthly gains in March. Nonfat dry milk (NFDM) reached record levels in mid-April as high protein products competed for skim solids. DMC margins improved slightly from January, settling at $8.46/cwt for February, and recent price rallies in commodity prices are expected to boost margins in the coming months.

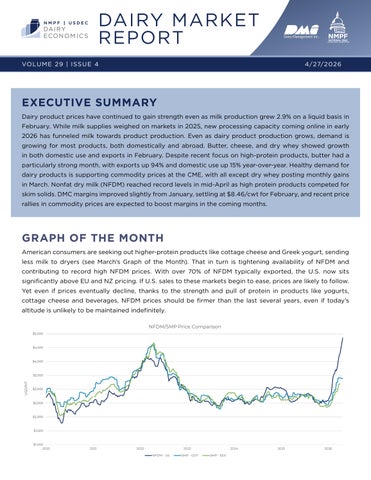
GRAPH OF THE MONTH

American consumers are seeking out higher-protein products like cottage cheese and Greek yogurt, sending less milk to dryers (see March’s Graph of the Month). That in turn is tightening availability of NFDM and contributing to record high NFDM prices. With over 70% of NFDM typically exported, the U.S. now sits significantly above EU and NZ pricing. If U.S. sales to these markets begin to ease, prices are likely to follow. Yet even if prices eventually decline, thanks to the strength and pull of protein in products like yogurts, cottage cheese and beverages, NFDM prices should be firmer than the last several years, even if today’s altitude is unlikely to be maintained indefinitely.

PRICES

In late 2025, high milk production weighed on product prices, but in early 2026 growing domestic use and exports for nearly every product has supported CME dairy prices. While cheese and butter sit below March 2025 levels, all products saw positive month-over-month price movement, except for dry whey. As incredible protein demand pulls milk out of the dryer, nonfat dry milk has reached record highs, reaching $2.20 on April 17.

MARKET COMMENTARY

CHEESE

Strong milk production kept vats busy in February, with cheese production up 4% year-over-year. Domestic demand increased 3%, marking the fourth consecutive month of growth following a slower 2025. The Restaurant Performance Index showed improvements across the food service sector, an important user of cheese products, likely contributing to increased domestic use. Exports have led the way in finding homes for additional cheese production, surging to 30% over last year’s levels. While American-type cheeses make up only 21% of U.S. cheese exports, they are outpacing other cheese types in export growth, with volumes up 35% year-over-year.

WHEY

Despite not experiencing much price support, dry whey had a strong February, with domestic use up 8% and exports surging 37%. China and Canada accounted for much of the export gains, with volumes to those destinations rising 72% and 69% respectively. Even though dry whey production has increased 12% since last year, this was insufficient to compensate for increased demand, leading to a counter-seasonal stock drawdown.

Whey protein concentrate domestic use improved 21% in February as consumers continue to seek out highprotein products. Exports, however, fell 14%, likely due to exorbitantly high prices and lack of available supply. WPC80+ now costs over $15,000/MT, a 79% increase from two years prior. Even as prices soar, total demand for WPC continues to outpace total supply, with stocks falling to 18% below prior year levels by the end of February.

BUTTER

High milkfat production continued to send cream to churns in February, with butter production increasing 9%. However, stocks remained low, ending the month 17% below typical levels. Butter exports increased 94% yearover-year, continuing their recent trend. Yet even as butter exports have recently stolen the spotlight, a 15% increase in domestic use in February is particularly informative as around 90% of U.S. butter production is used domestically. In fact, the increase in domestic sales accounted for over two-thirds of February’s butter demand increase.

Low stocks, rebounding domestic consumption, and strong exports seem to be pushing markets back towards balance rather than creating shortness. Because milkfat production is still strong, butter prices remain low compared to the prior three years. Export figures in the coming months are expected to ease due to conflict in the Middle East, as countries surrounding the Straight of Hormuz account for around 15% of U.S. butter exports.

NONFAT DRY MILK/SKIM MILK POWDER

Despite strong protein competition from Class II products and ultrafiltered milk, nonfat dry milk production responded to increasing prices in February, rising 6%. Exports, which accounted for 63% of NFDM use in February, climbed 8%. However, with U.S. prices significantly higher than other exporters, exports to contested markets are expected to decline in the coming months (see Graph of the Month).

Note: Data tables are available in the Appendix on Page 9

FLUID MILK

While total conventional fluid milk sales eased slightly in February, whole milk sales rose almost 3% as more consumers selected higher-fat milk. Organic fluid milk sales also expanded, bucking a longstanding downward trend. Additionally, ultrafiltered milk, popular for its enhanced nutrition profile and longer shelf life, has grown 8% in the past year and 34% in the past two years at retail, according to Circana. .

CULTURED AND SOFT PRODUCTS

Production of dairy’s high-protein consumer product stars, yogurt and cottage cheese, grew 6% and 7% respectively in February. Sour cream also had a standout month, with production rising 8%, and ice cream saw a slight production boost. Circana data shows that retail sales of cottage cheese has grown 13% for each of the past three years and shows no signs of slowing. Similarly, yogurt consumption has grown 7% per year over the same period yet has done so despite being a much larger category. By contrast, sour cream has shown modest growth of 0.5% per year, and ice cream consumption has contracted slightly, falling 0.7% per year.

MILK PRODUCTION

Turning to the farm, milk production rose 2.9% in February, a slight deceleration from January’s 3.4% growth rate. Most of this growth can be attributed to a 209,000 head addition to the milking heard over the past year as high returns from beef-on-dairy encourage producers to push for additional black calves. Both milkfat tests and FMMO protein tests increased 0.03%, marking an acceleration of protein component growth and a deceleration of milkfat growth. While in previous months producers received signals of milkfat oversupply, rising butter prices may once again incentivize pushing for milkfat component growth.

ADJACENT MARKETS

• CBOT Corn Futures fell as stocks were reported to be larger than expected. Soybean Meal futures have largely risen as domestic demand for feed expands.

• The CME Feeder Cattle Index has regained strength to near record levels, after a slight dip in March.

• Crude oil prices have remained elevated as conflict in the Middle East prevents supplies from passing through the Strait of Hormuz.

Sources: CBOT, CME, EIA

DAIRY MARGIN COVERAGE

DMC Margins rose to $8.46/cwt in February, gaining $0.65/cwt over January. While the All Milk Price rose $0.80/cwt, some of that gain was eroded by a $0.15/cwt increase in feed prices. Futures suggest margins will rise above the maximum payment threshold to $9.65/cwt in March and will remain elevated throughout the rest of 2026.

CONSUMER DEMAND INDICATORS

Consumers felt slightly more optimistic in February, with both consumer confidence and the restaurant performance index rising over January levels. However, conflict in the Middle East, which began in early March, has renewed fears of rising inflation, further complicating the Federal Reserve’s interest rate decisions as the unemployment rate continues to tick upwards. While prices for food at home rose 2.4% over the past year, dairy product prices held steady, providing a break from inflationary pressures.

LOOKING AHEAD

Milk production is anticipated to remain strong through the coming months as beef-on-dairy incentivizes maintenance of current cow numbers at a minimum, if not expansion. Although both domestic use and exports for most dairy products showed positive signals in February, March data will begin to illustrate the effects of conflict in the Middle East. Exports of cheese and butter to the region are expected to fall, which could have broader consequences, as countries along the Strait of Hormuz represent 5% and 15% of export volume for those products, respectively. Beyond the direct impact of lost sales to the region, elevated crude oil and fertilizer prices are putting pressure on producers as transportation and feed costs increase. Furthermore, there remains a significant risk that consumers could begin to feel the effects of intensifying inflation, which would cause a pullback in spending, particularly in food service. However, with product prices elevated above late 2025 levels, and corn futures moderating, DMC margins are expected to remain above maximum coverage levels through the end of the year.

Dairy Management Inc.™ and state, regional, and international organizations work together to drive demand for dairy products on behalf of America’s dairy farmers, through the programs of the American Dairy Association®, the National Dairy Council ® , and the U.S. Dairy Export Council ®

Katriel Marks-Yant, National Milk Producers Federation kmarksyant@nmpf.org www.nmpf.org

The National Milk Producers Federation (NMPF) develops and carries out policies that advance dairy producers and the cooperatives they own. NMPF’s member cooperatives produce more than two-thirds of U.S. milk, making NMPF dairy’s voice on Capitol Hill and with government agencies.

CHEESE — FEBRUARY 2026

WHEY — FEBRUARY 2026

BUTTER — FEBRUARY 2026

NONFAT DRY MILK/SKIM MILK POWDER — FEBRUARY 2026

Turn static files into dynamic content formats.

Create a flipbook
Dairy Market Report - April 2026 by National Milk Producers Federation - Issuu