In the past, this report was published once a year after all data for the previous year became available. This often required waiting for a small amount of data that is released later in the year. However, much of the annual data included in this report is available much earlier.
To provide members with more timely information, the report will now be released twice each year. A mid-year edition will include all relevant data published to date, while a year-end edition will include complete prior-year data, along with any data revisions by USDA or other applicable agencies.
About Us
The Dairy Economics Team, a collaborative effort between the National Milk Producers Federation (NMPF) and the U.S. Dairy Export Council (USDEC), provides comprehensive market analysis for stakeholders within America’s dairy industry. This specialized team combines the expertise of both organizations to offer unparalleled insights into the ever-evolving dynamics of dairy markets in the United States and around the world.
Leveraging data analytics and industry intelligence, the team produces quality, timely reports to assist dairy farmers,
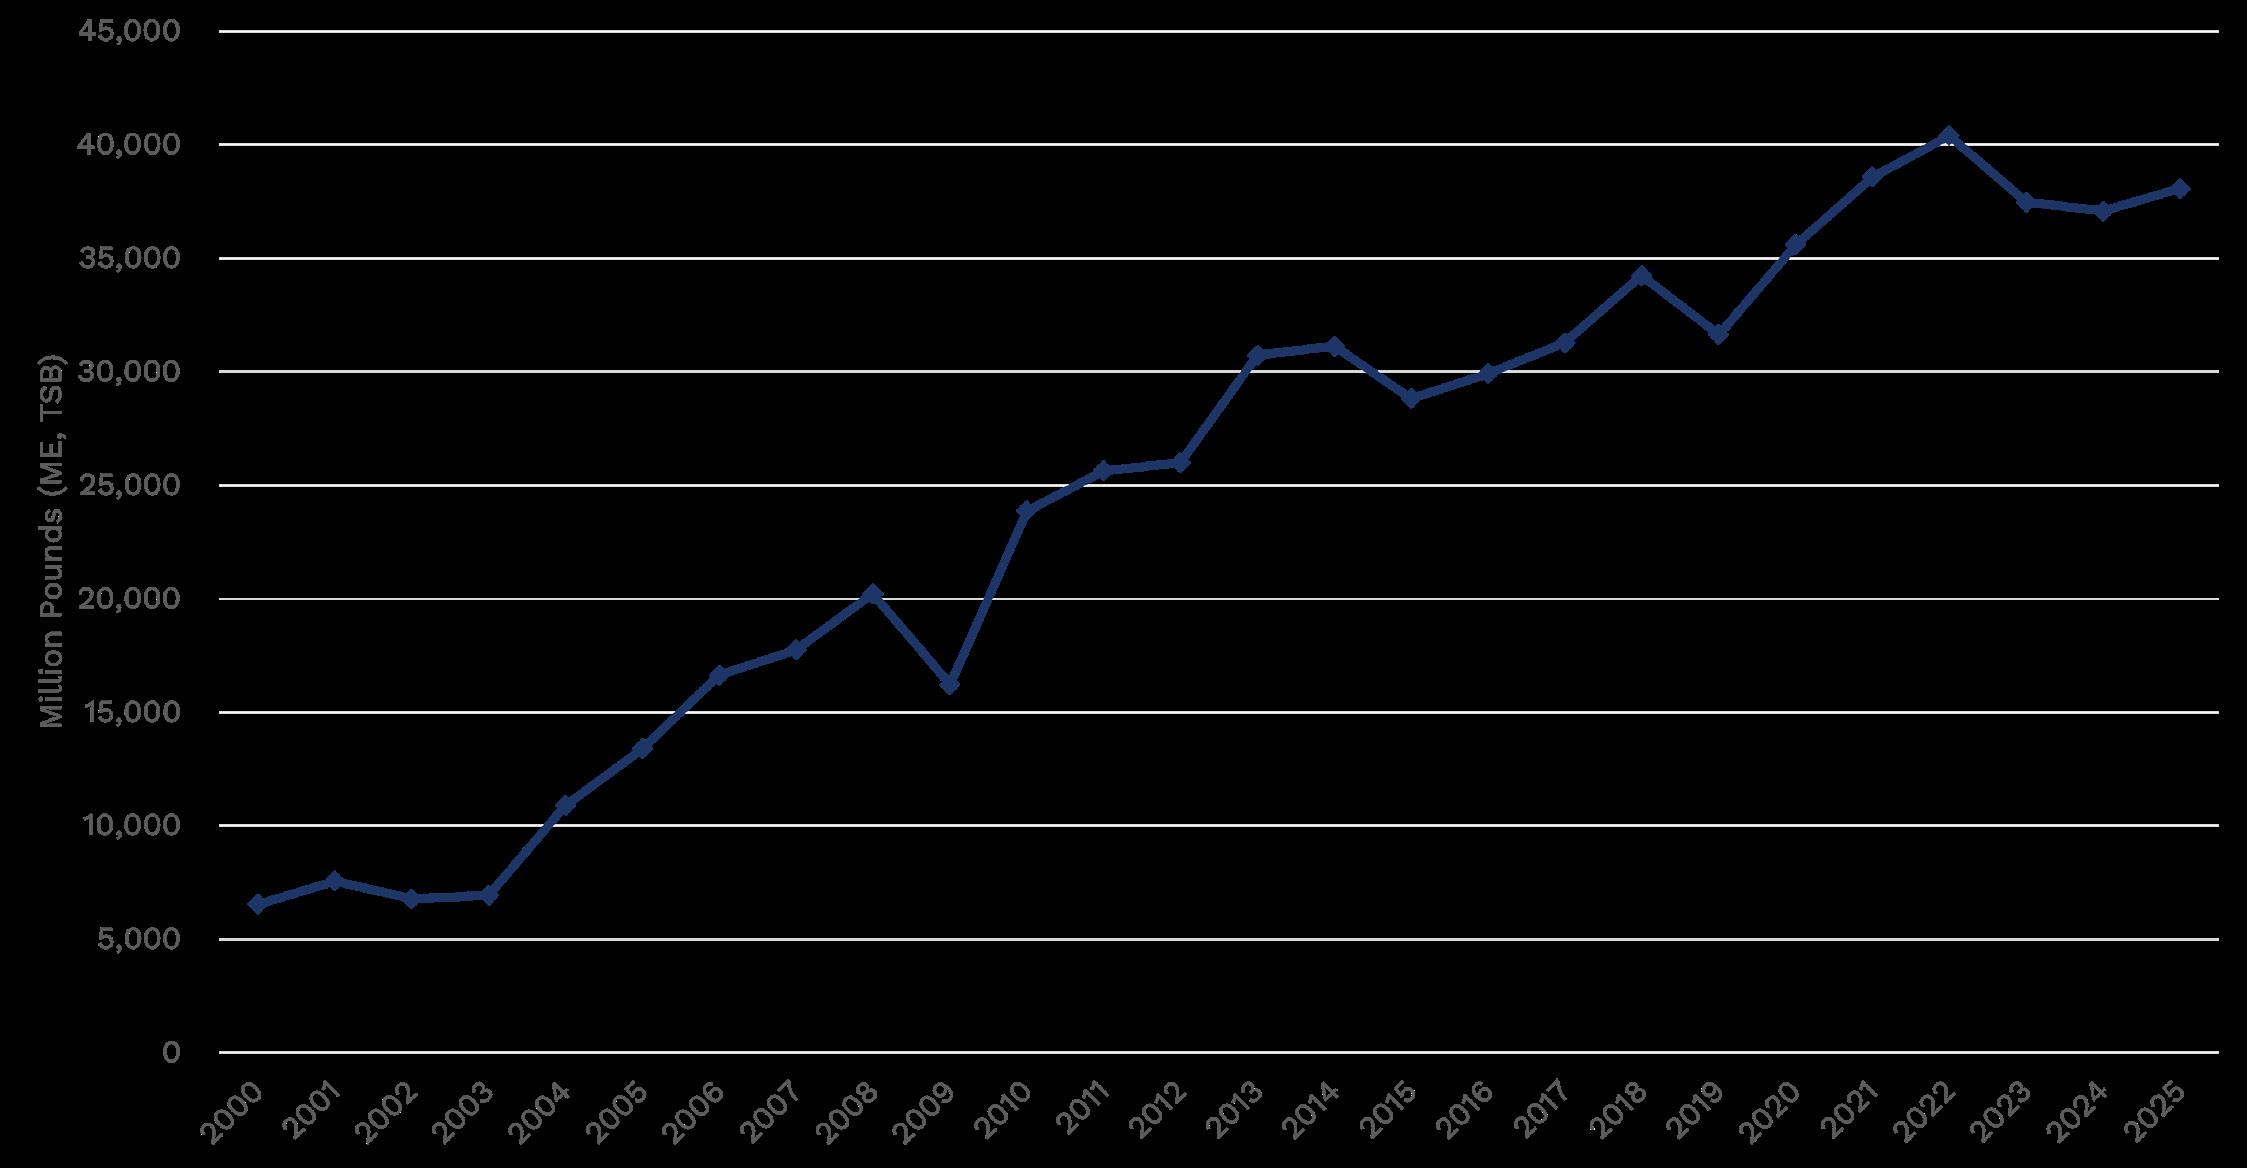
U.S. Production of Milk, Milkfat and Solids-Not-Fat
Sources: USDA/NASS; USDA/ERS; U.S. Census Bureau
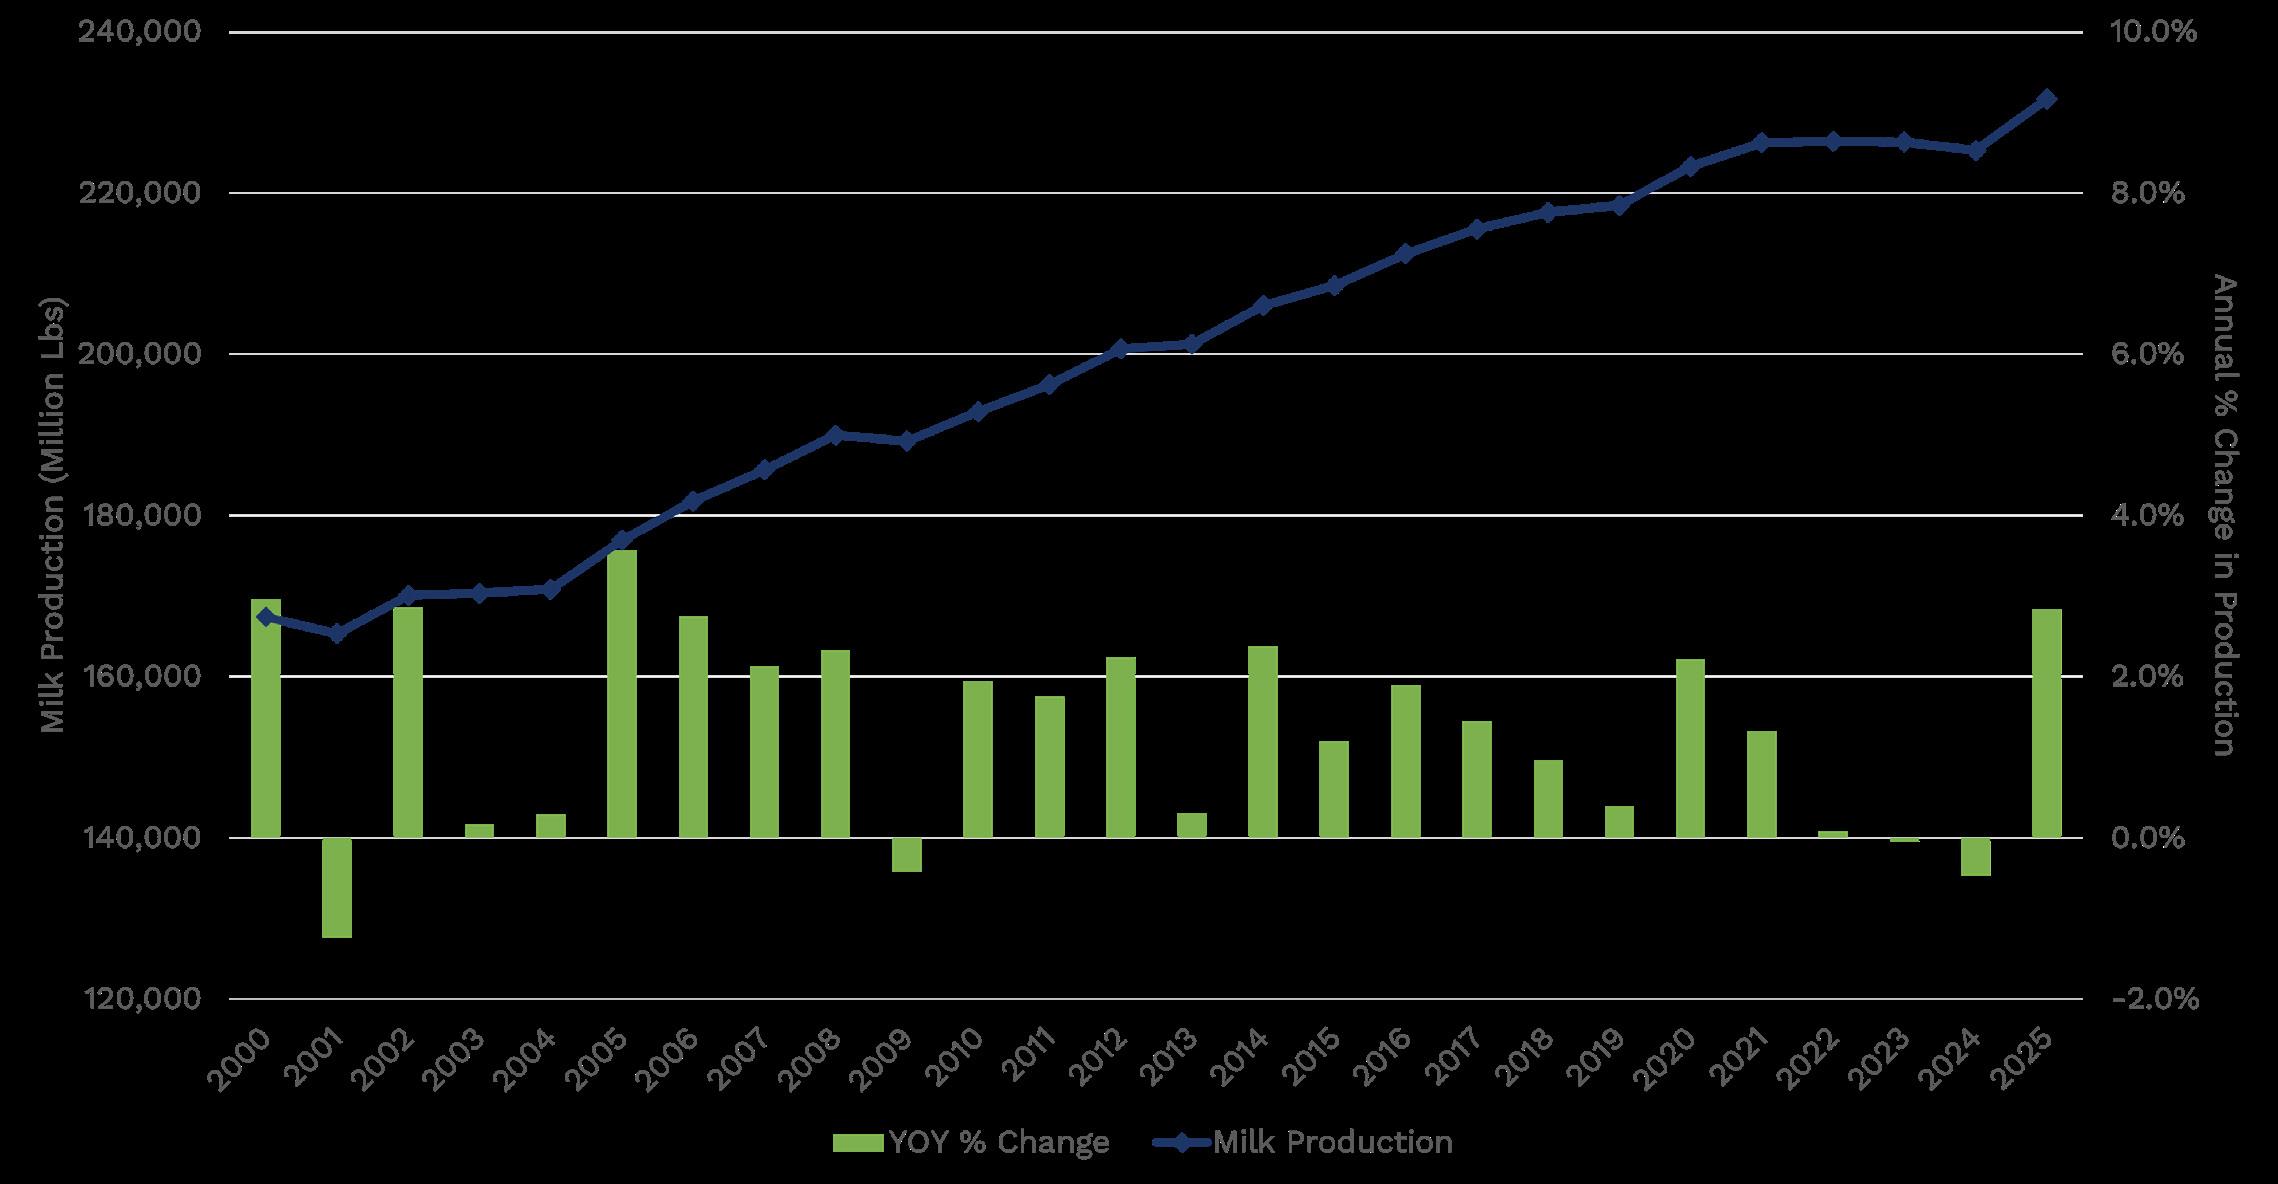
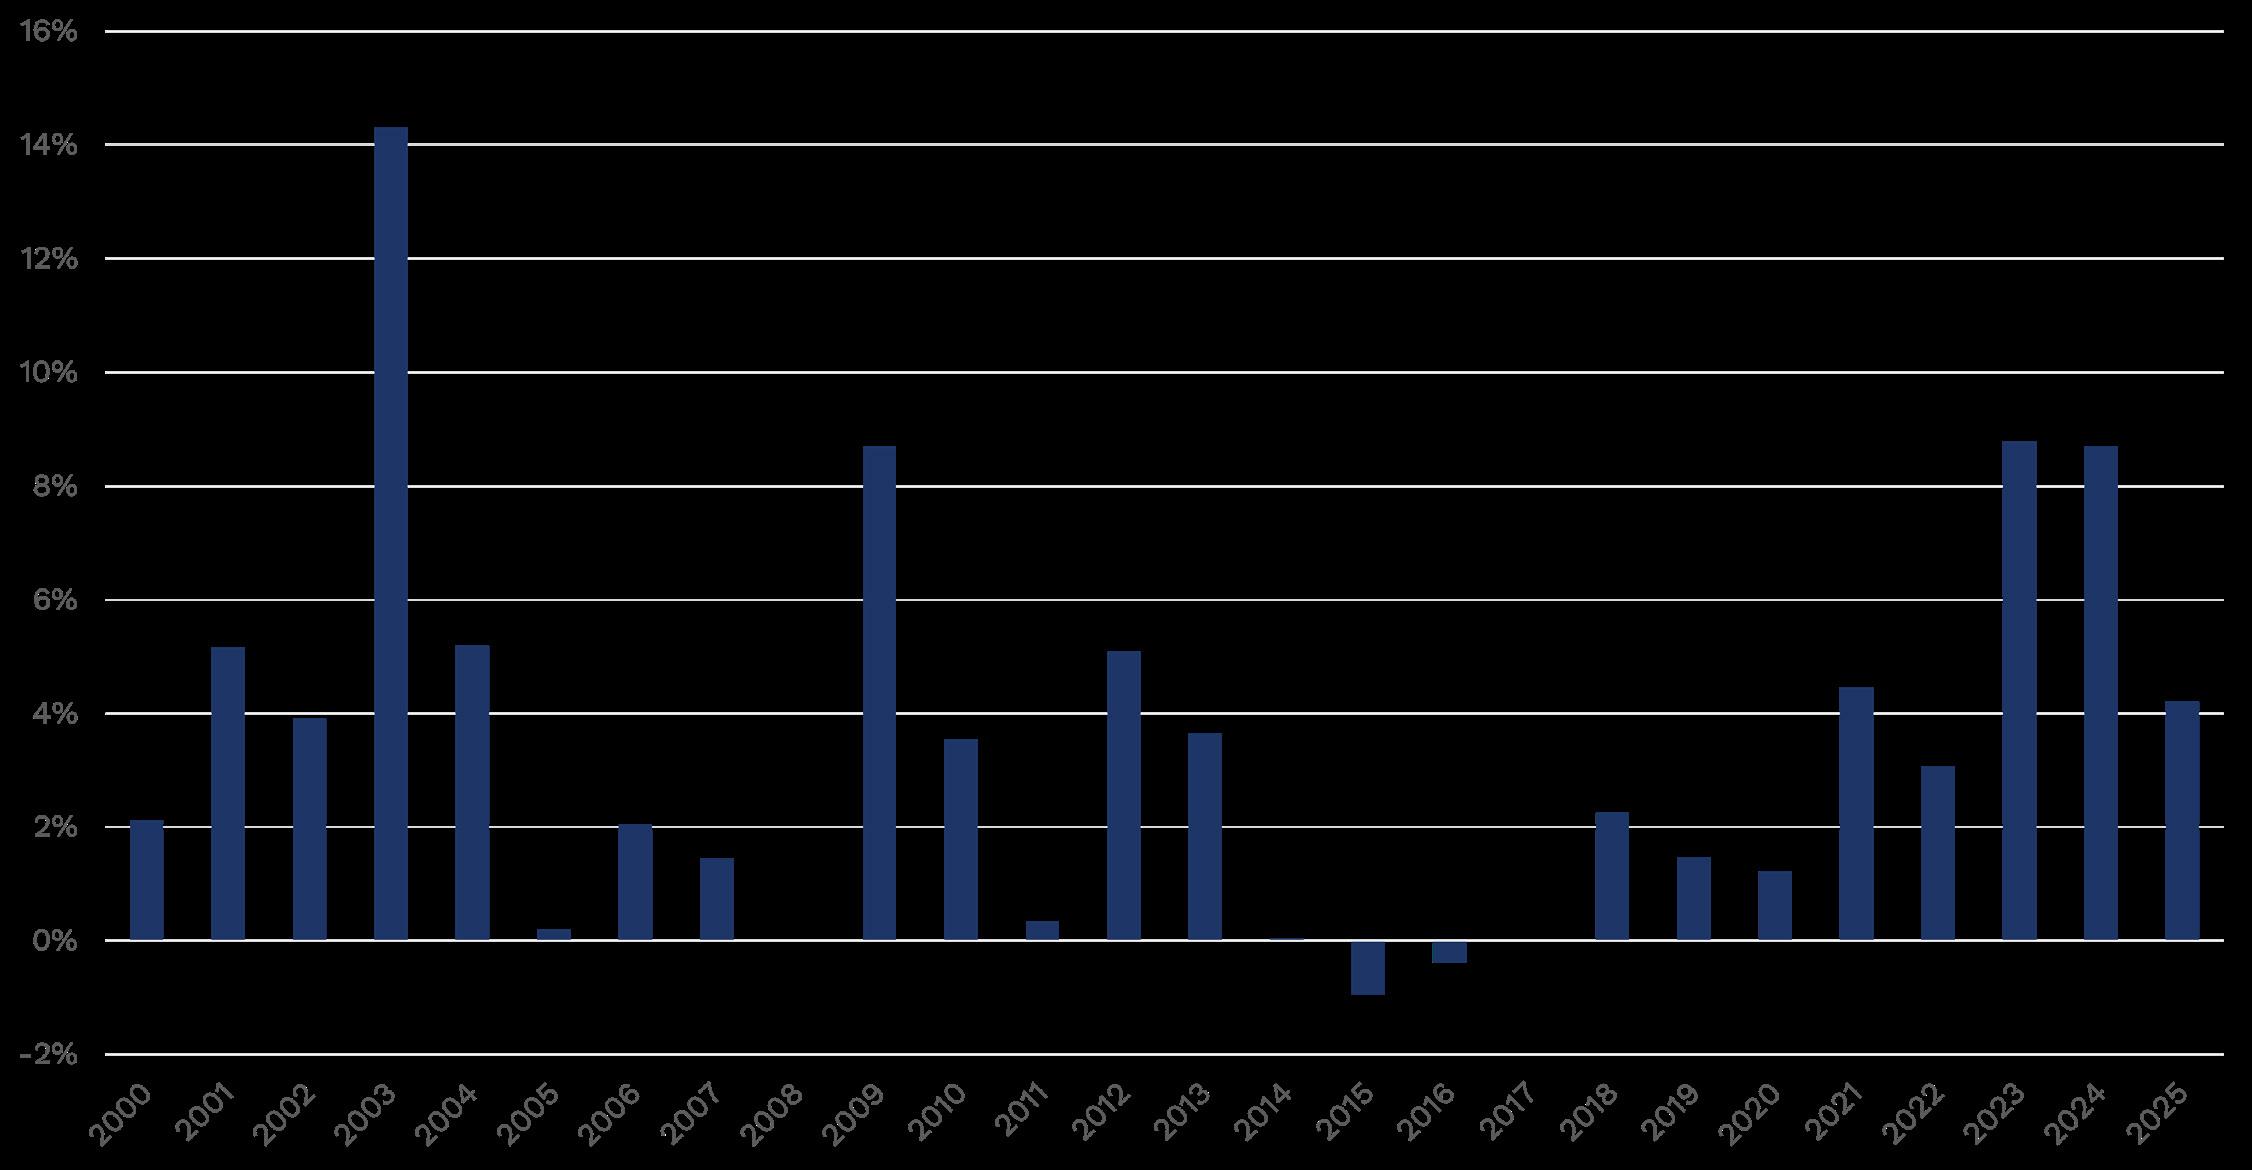
Growth in U.S. Milk Production
Sources: USDA/NASS; USDA/ERS; U.S. Census Bureau
U.S. Milk Cow Numbers, Dairy Farms and Herd Size
Sources: USDA / NASS: Cattle; Milk Production; Farms and Land in Farms.
*Licensed dairy herds beginning in 1995
Farm: Any establishment with at least $1,000 in annual sales of agricultural products.
Dairy: Any farm having one or more milk cows on hand during the year. Discontinued by NASS after 2012.
Licensed dairy: A farm with a public health license to sell milk.
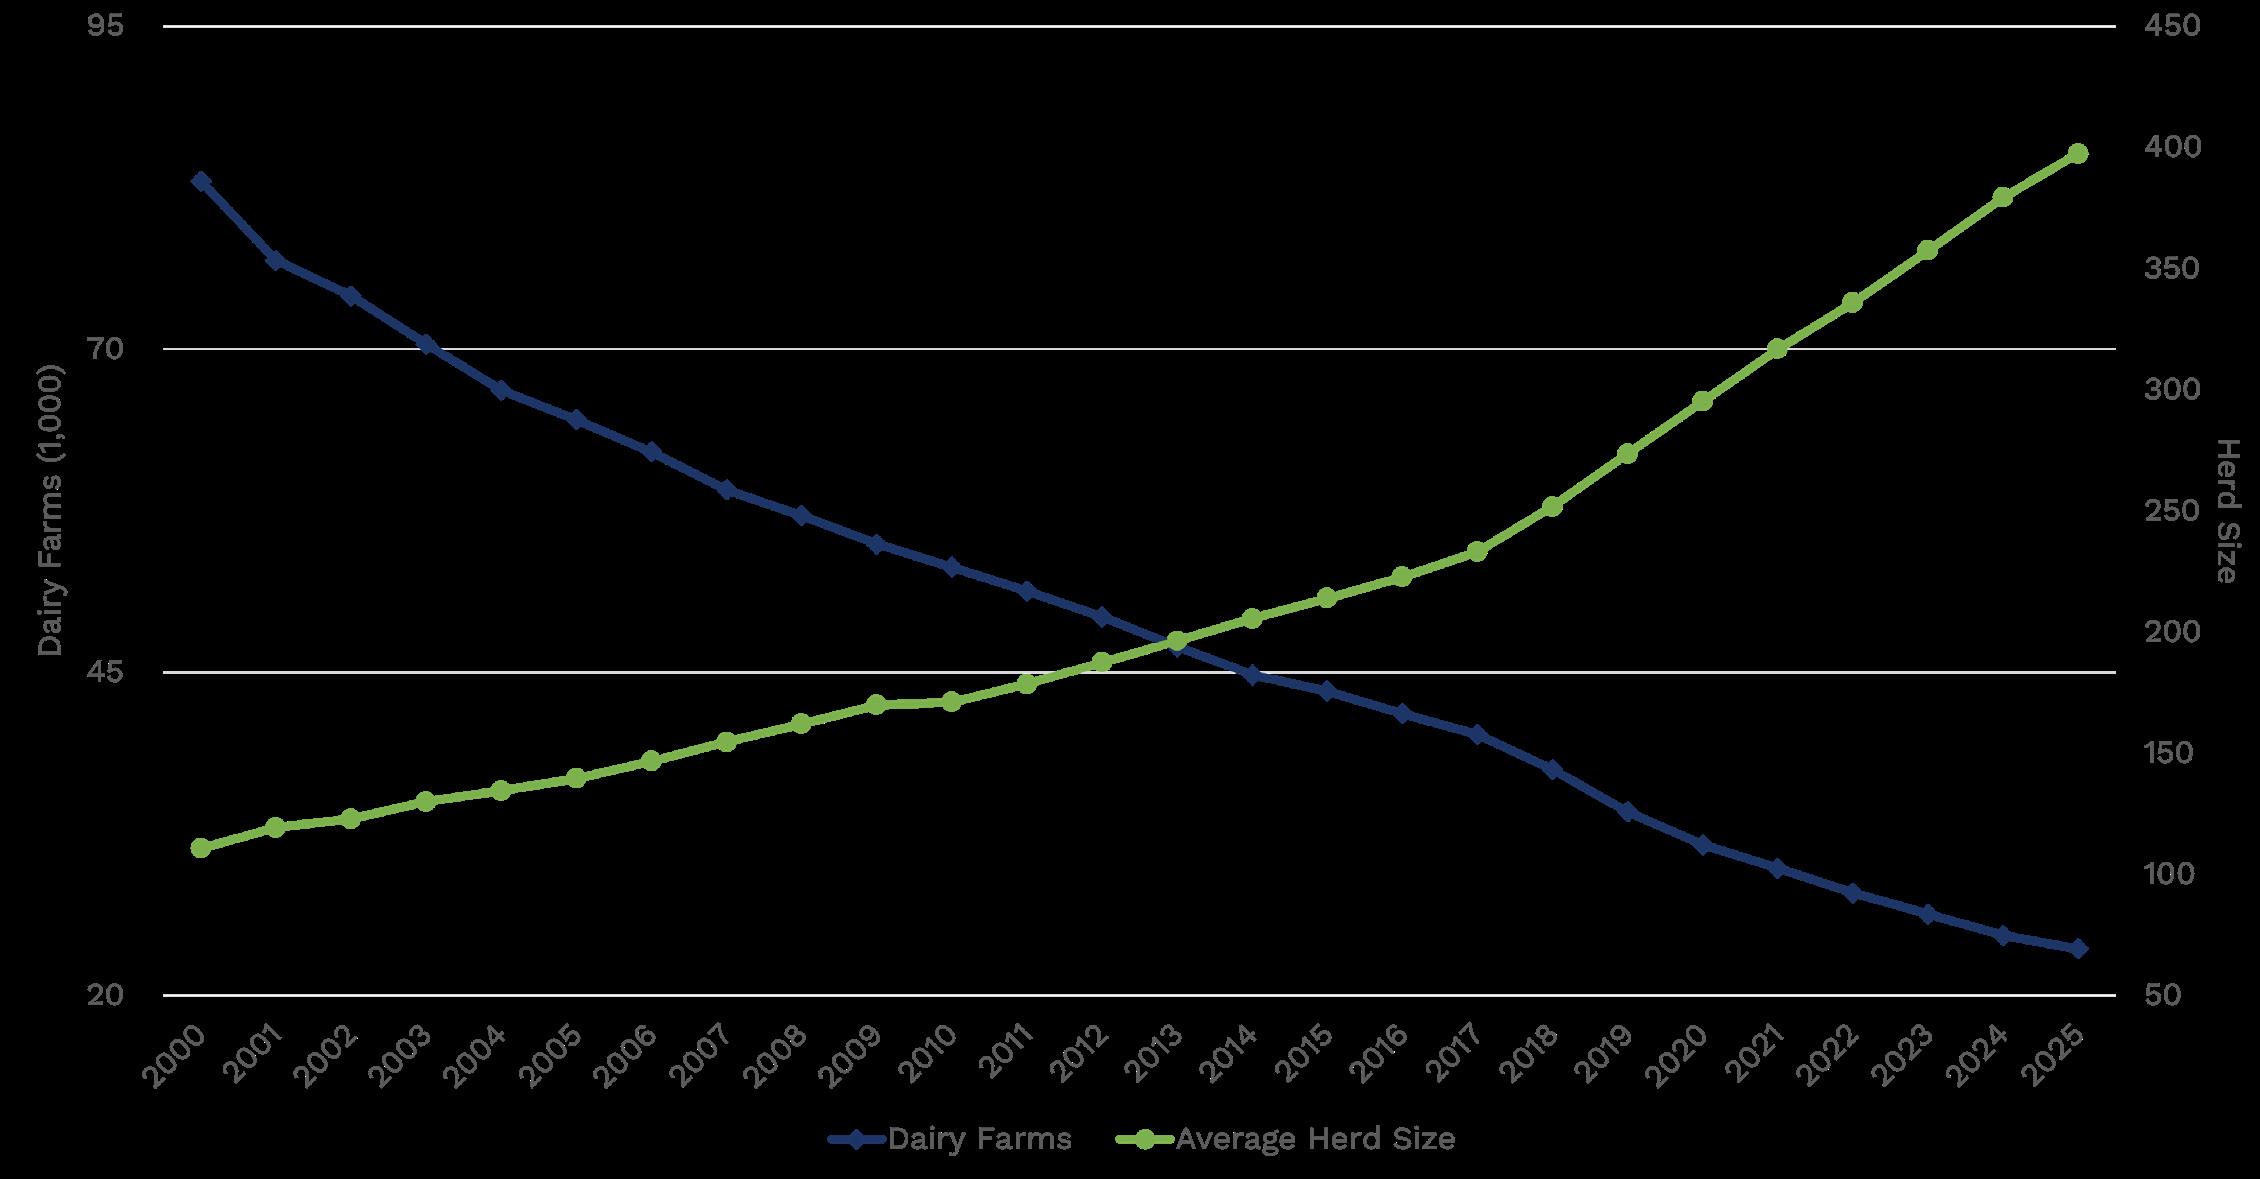
U.S. Dairy Farms and Average Herd Size
Sources: USDA / NASS: Cattle; Milk Production; Farms and Land in Farms.
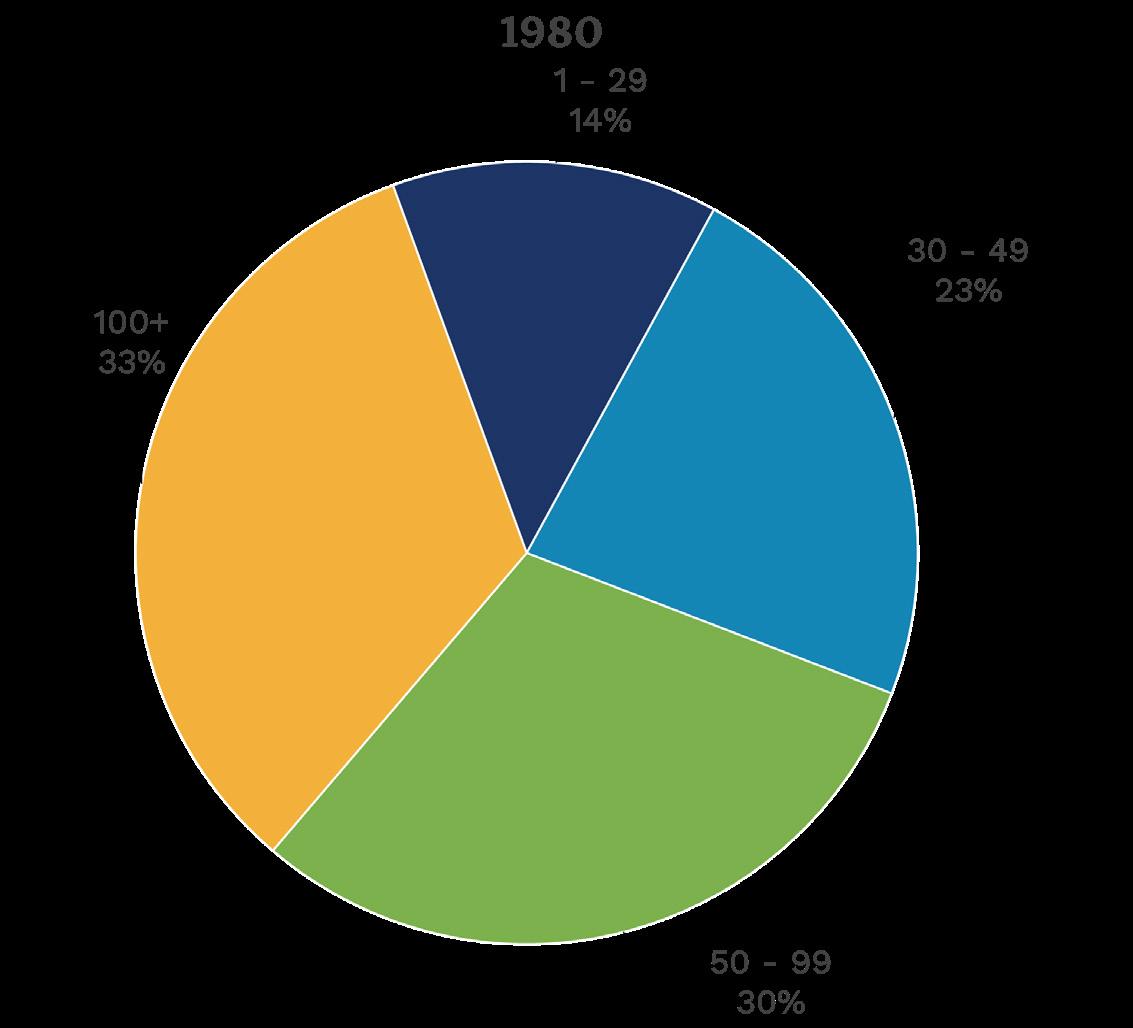
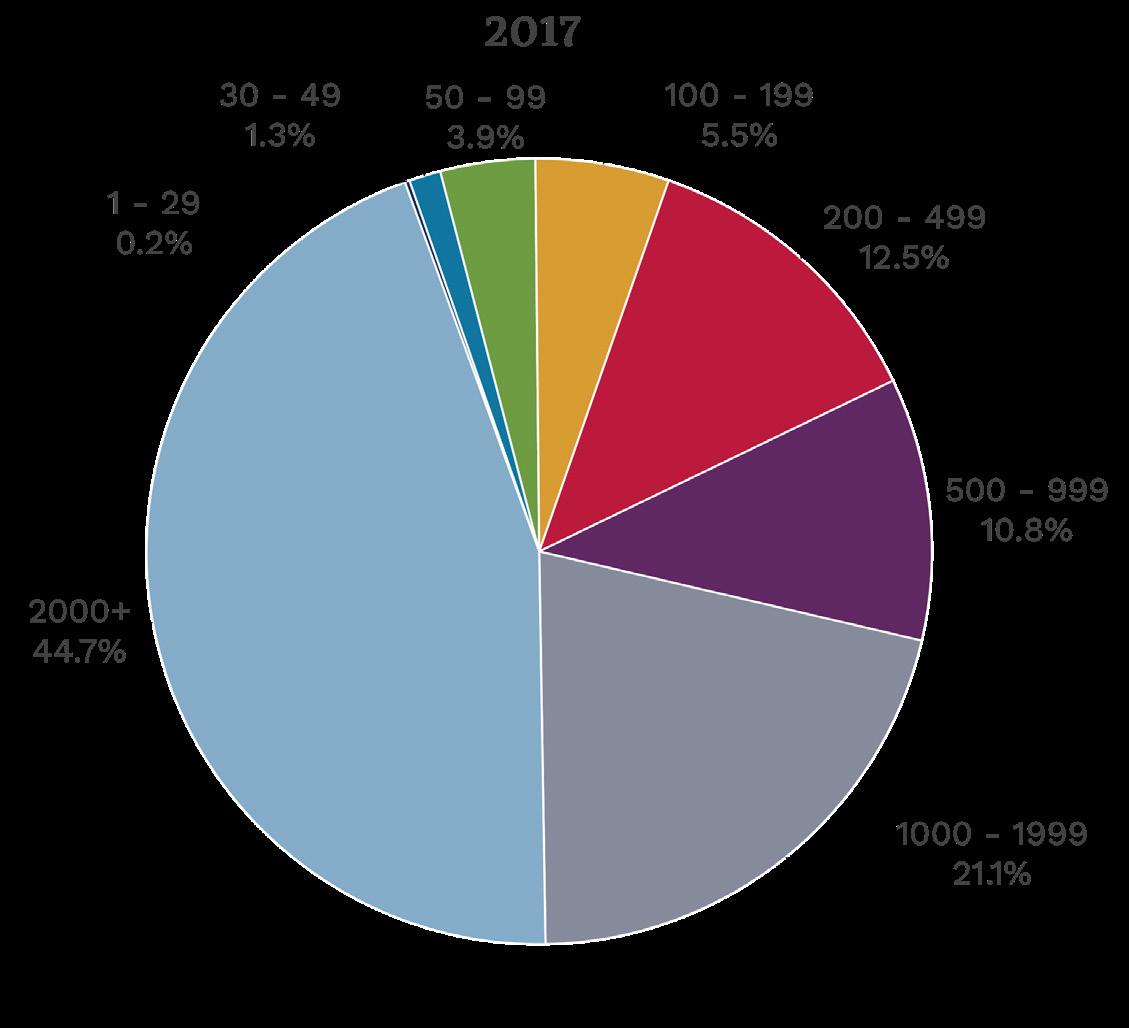
Dairy Farms and Milk Production by Herd Size
Source: USDA / NASS; Milk Production.
1 Farms are defined as operations with at least one milk cow through 2012, and as licensed dairy herds in 2017.
2 Included in 100-199; greater detail for herd sizes above 100 cows not available prior to 1993.
3 Included in 200-499; greater detail for herd sizes above 200 cows not available prior to 1998.
4 Discontinued by NASS between quinquennial census years after 2012. 2017 from Agricultural Census and NMPF.
FIGURE 3A
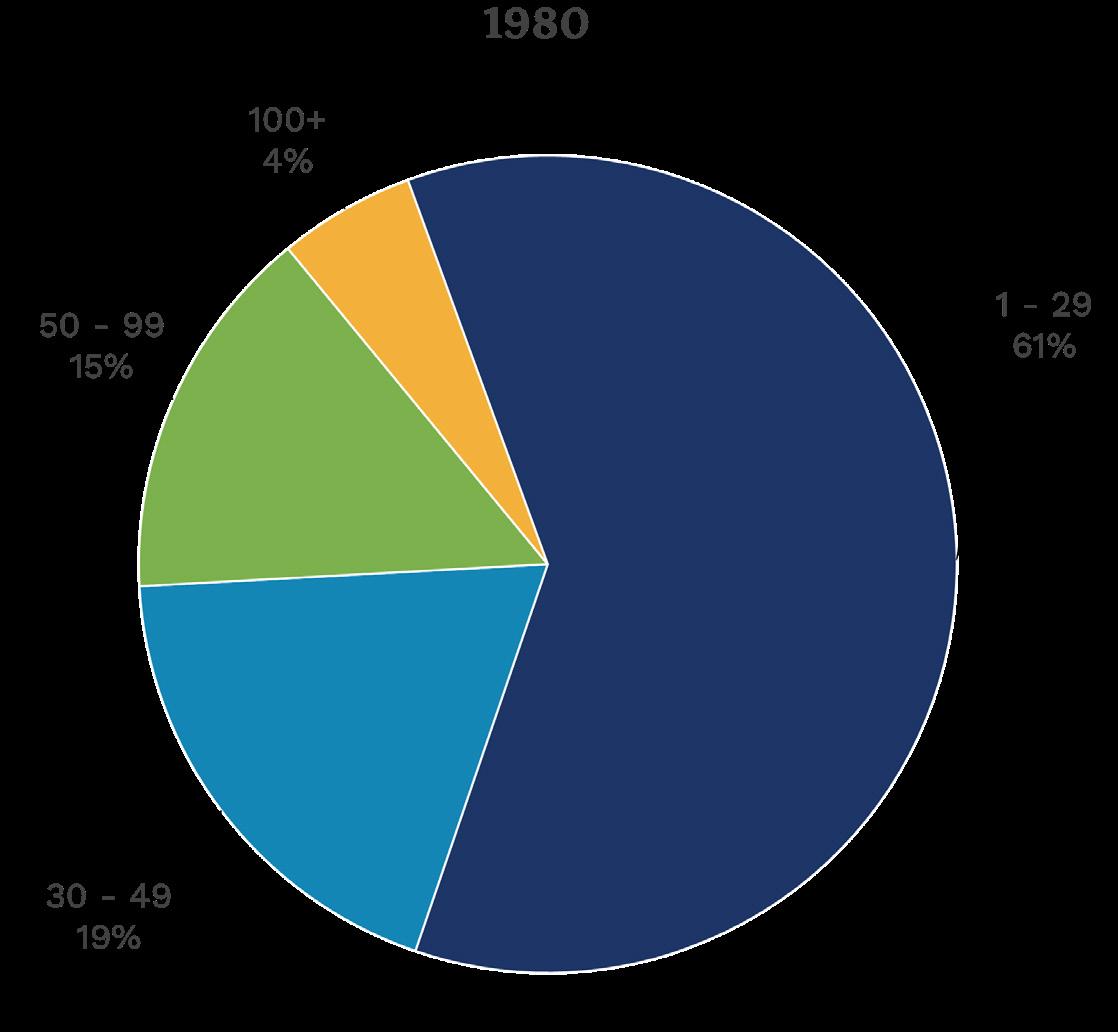
Percent of U.S. Dairy Farms by Herd Size
FIGURE 3B
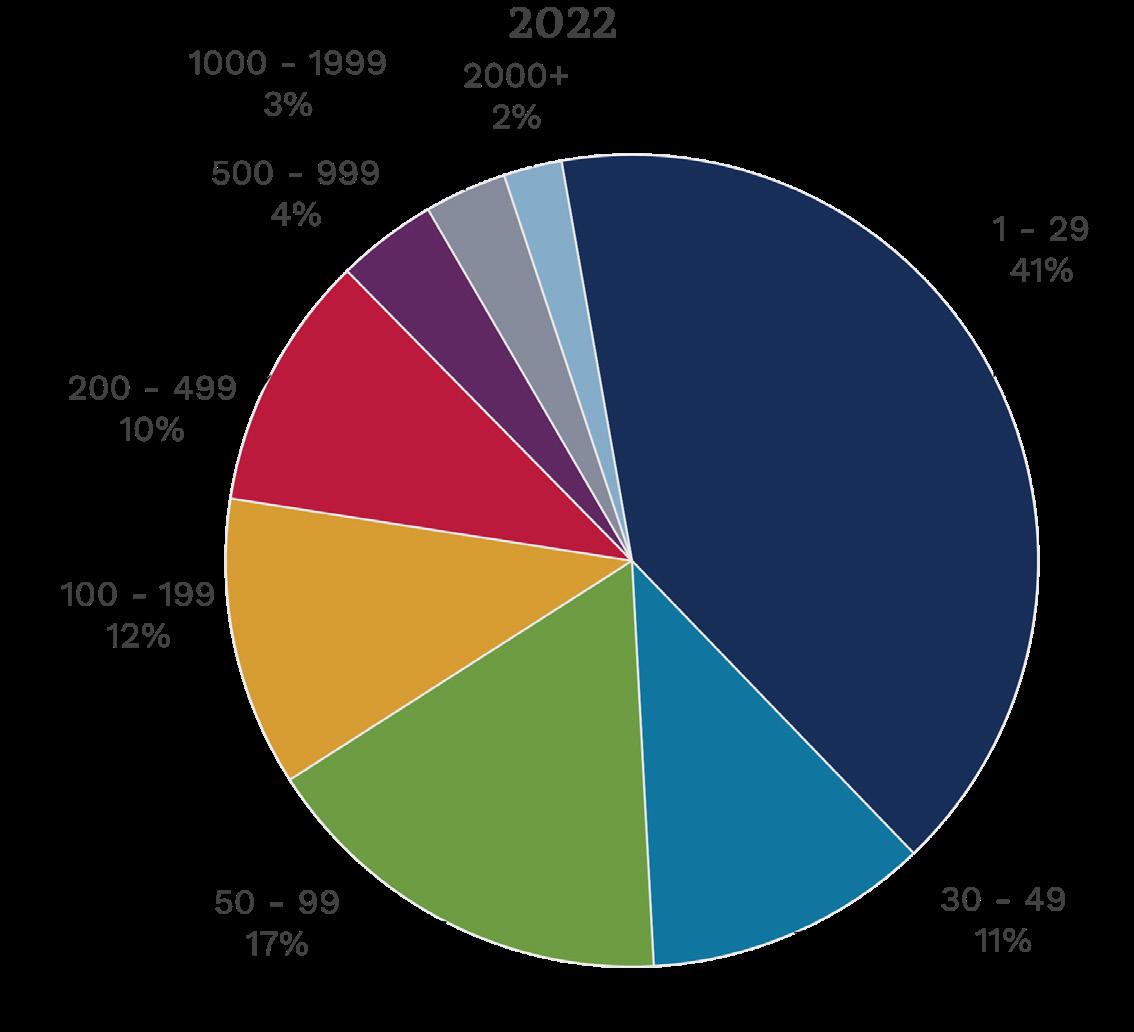
Percent of U.S. Milk Production by Herd Size
Source: USDA / NASS; Milk Production.
U.S. Production Per Cow of Milk, Milkfat
and Solids-Not-Fat
Sources: USDA/NASS; USDA/ERS.
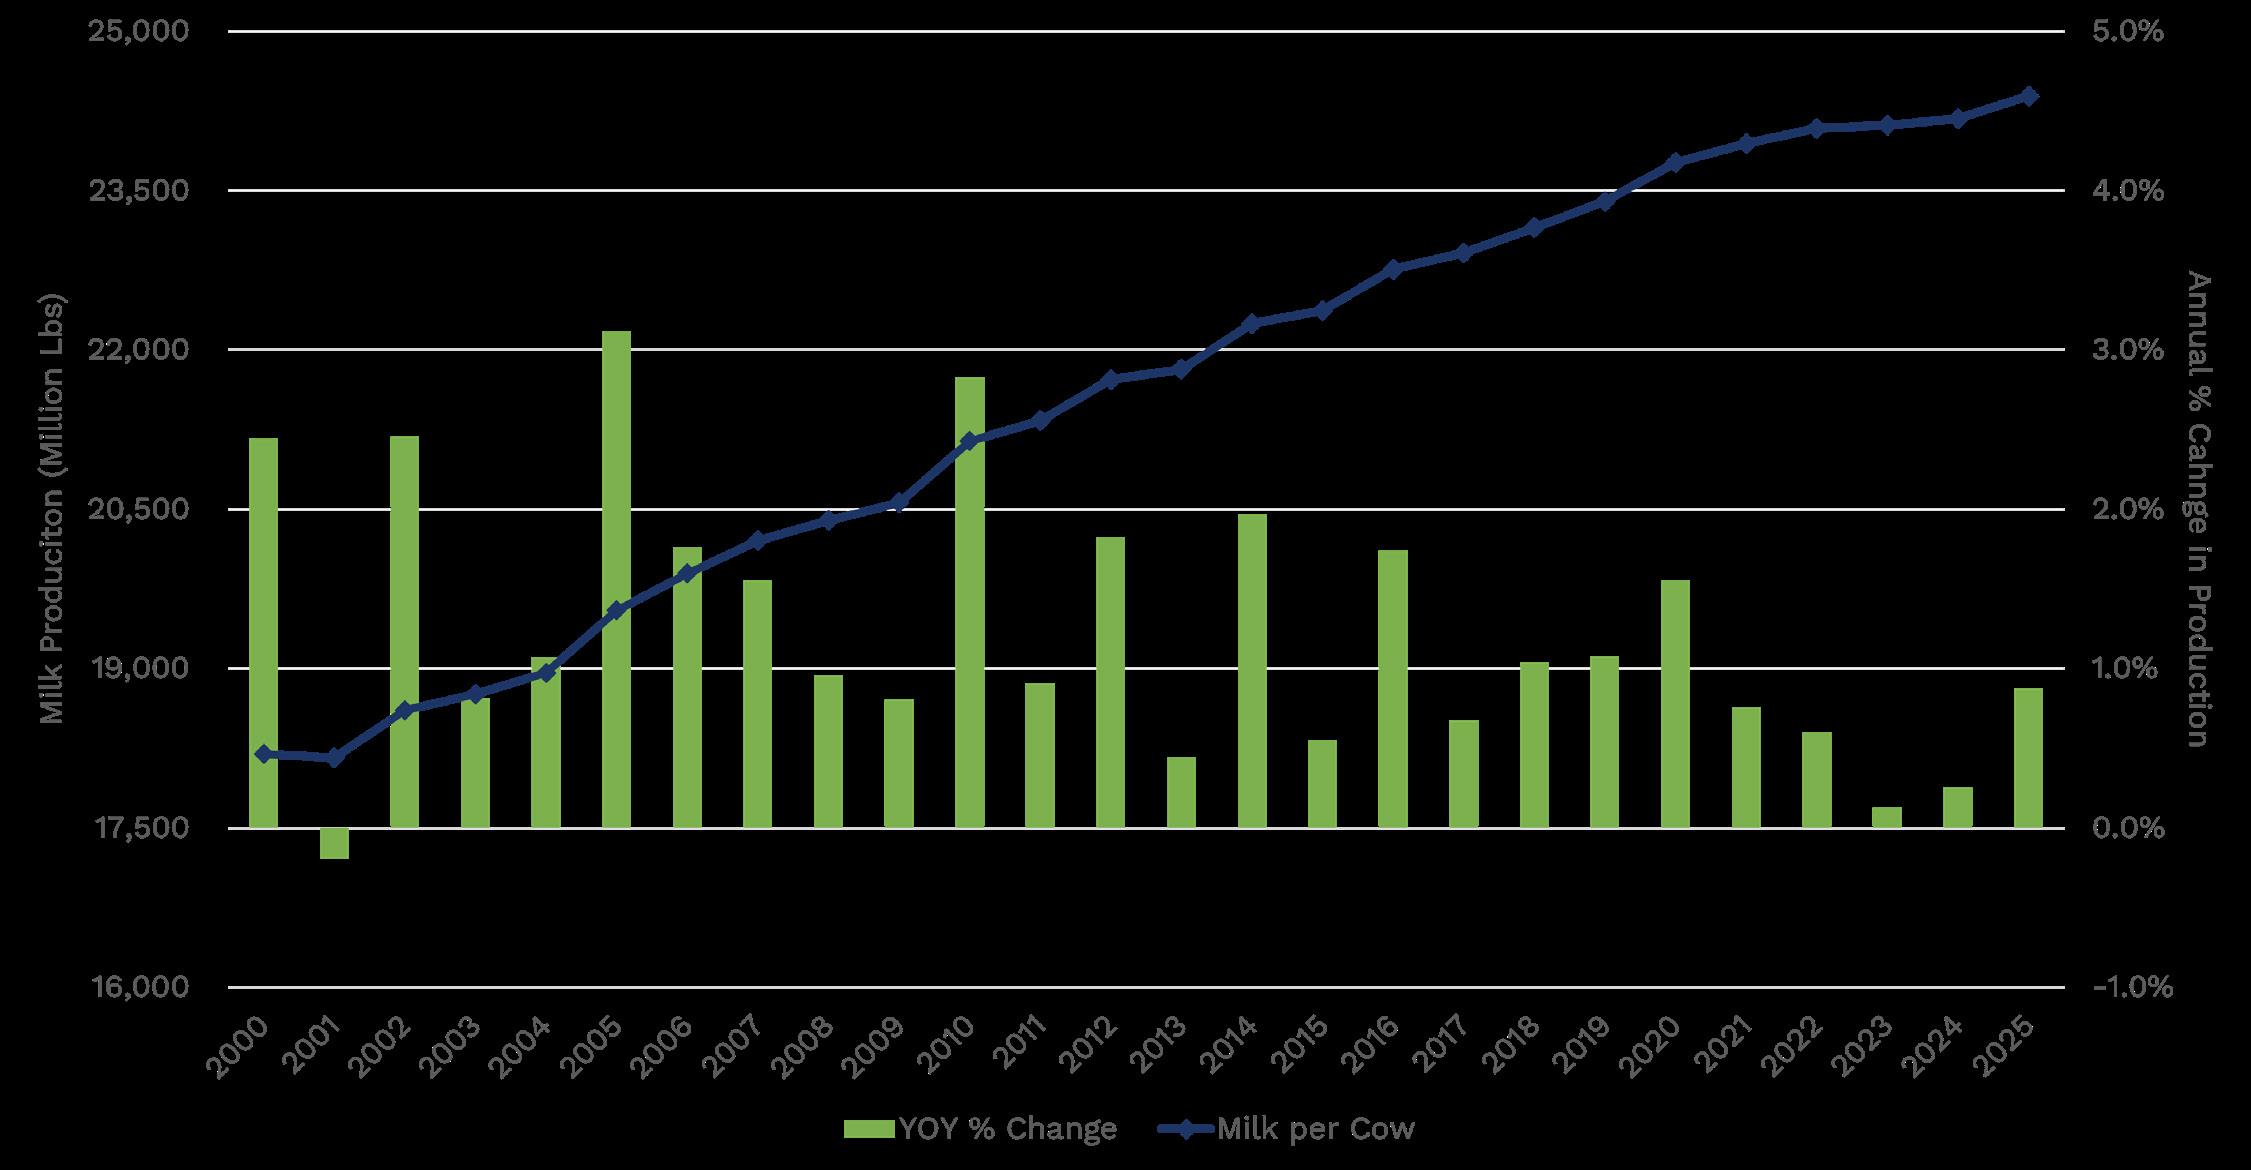
Growth In U.S. Milk Production Per Cow
Sources: USDA/NASS; USDA/ERS.
Structure of the Dairy Industry by State
Milk Production Per Cow by State
¹
Source: USDA/NASS: Milk Production, Disposition, and Income.
and
into ”Other
beginning in
“Other States” beginning in 2025.
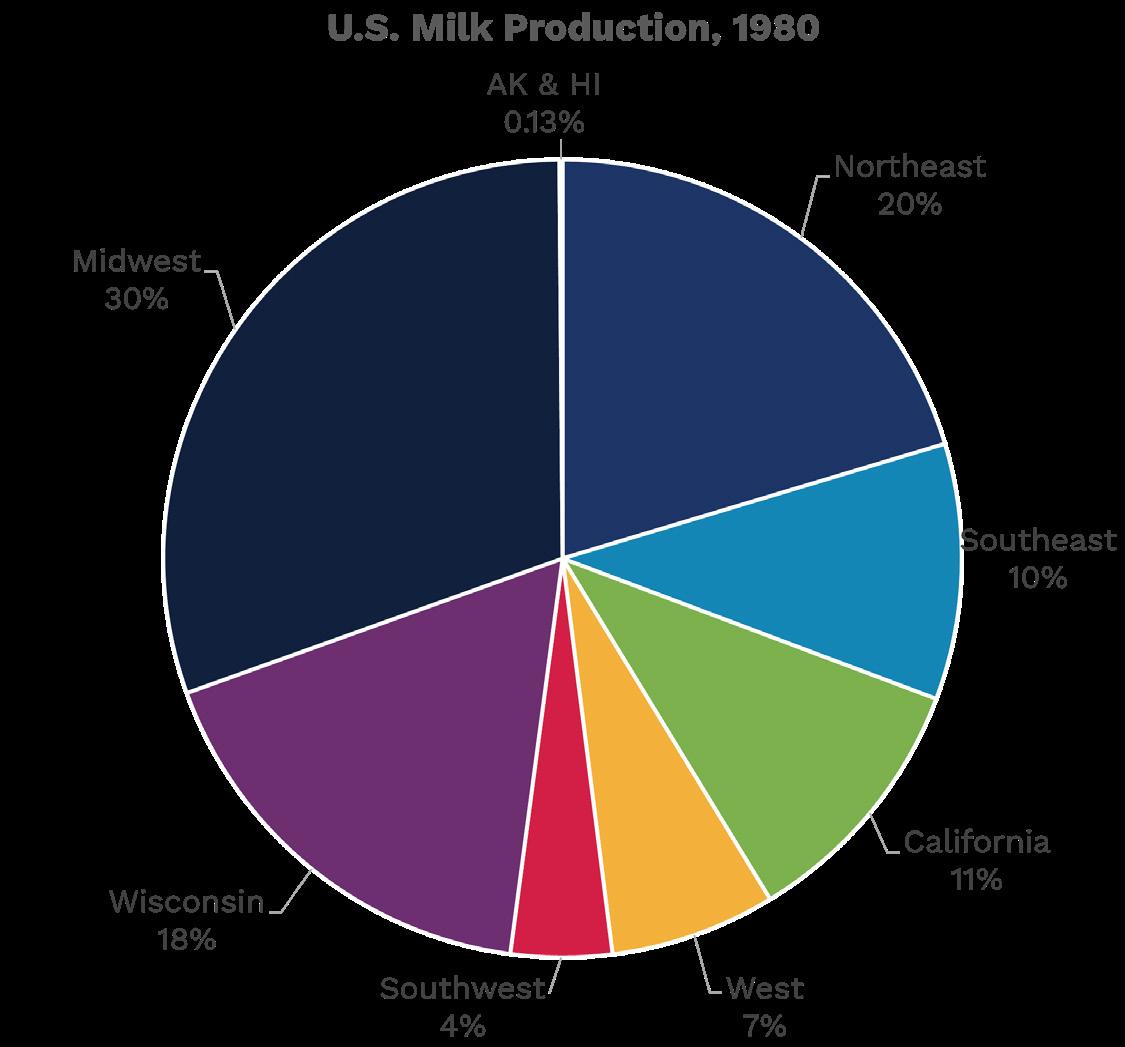
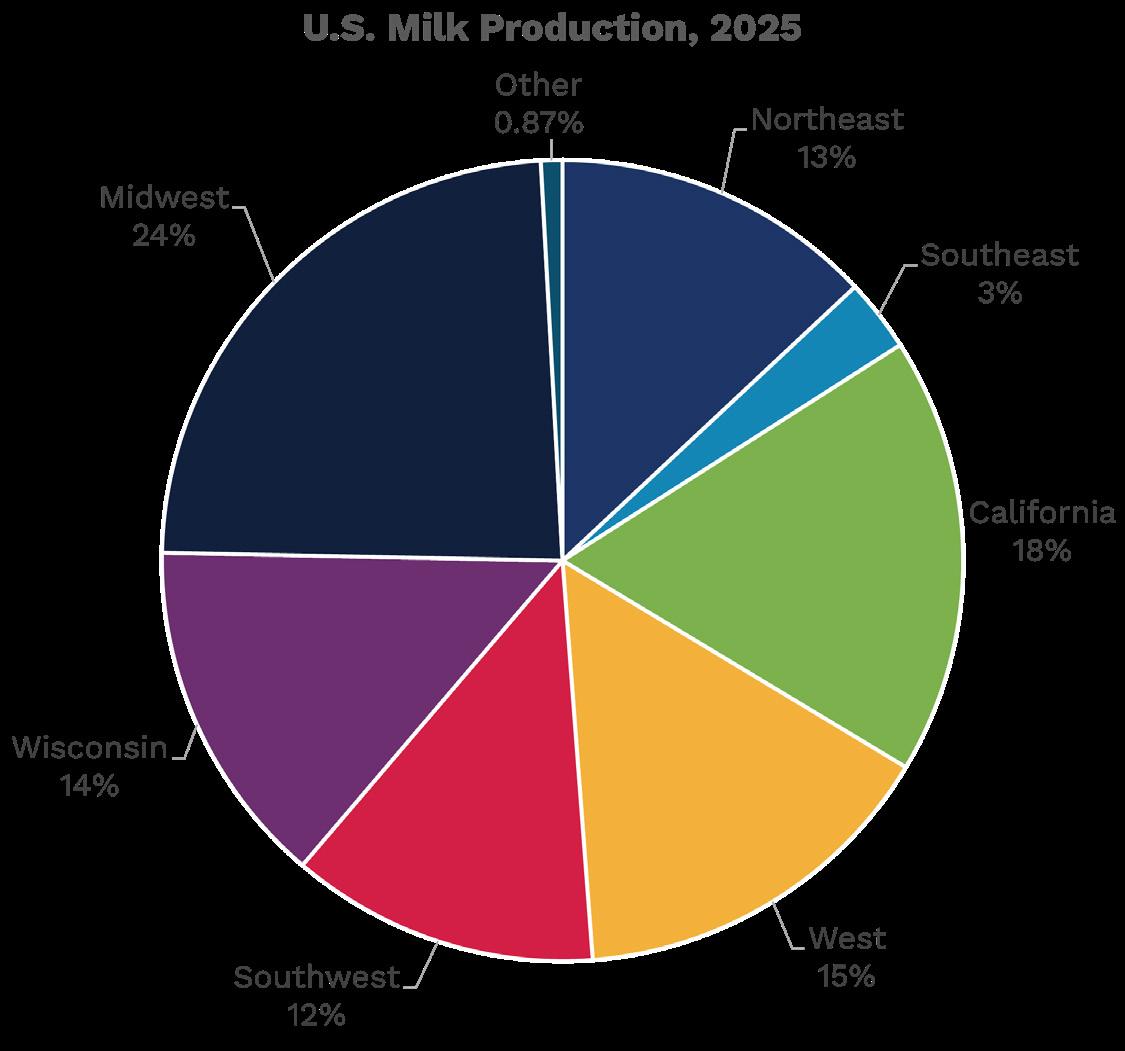
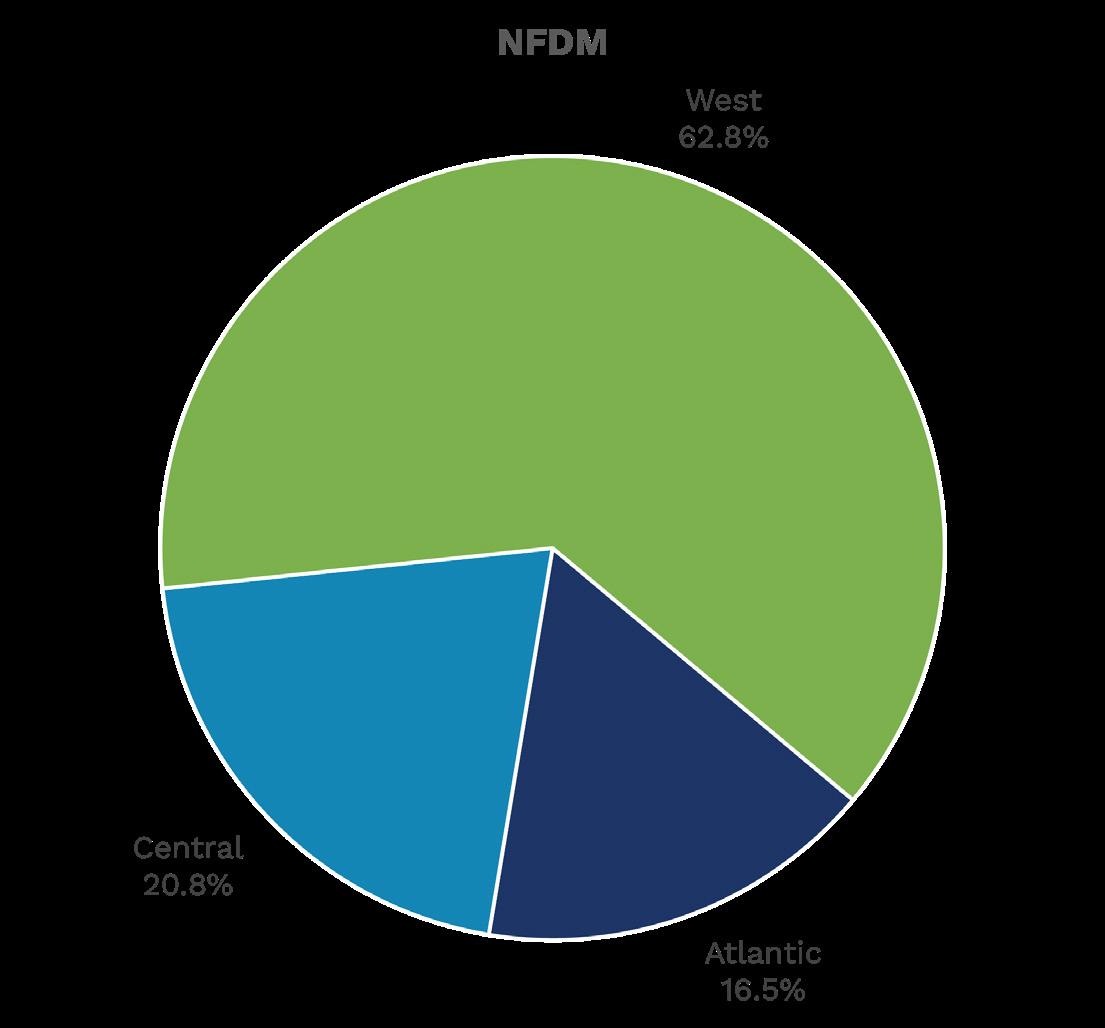
Regional Milk Production
Source: USDA/NASS: Milk Production, Disposition, and Income.
Other States (beginning in 2025): AL, AK, AR, CT, DE, HI, LA, MA, MS, MT, NH, NJ, ND, RI, SC, WV, and WY
Cow Numbers, Licensed Dairy Herds and Herd Size, by State
Source: USDA/NASS: Milk Production.
Milk Production by State
Source: USDA/NASS: Milk Production, Disposition, and Income.
¹ Alaska and Hawaii combined into ”Other States” beginning in 2019. 2 AL, AR,
NH, NJ, ND, RI, SC, WV, and WY combined into “Other States” beginning in
Importance of the Dairy Sector by State, 2024
Sources: USDA/ERS: Farm Income and Wealth Statistics
Producer, Wholesale and Retail Prices of
and Dairy Products
All-Milk Prices by State
Source: USDA/NASS: Milk Production, Disposition, and Income.
¹ Milk prices for Alaska and Hawaii combined into “Other States” beginning in 2019. 2 AL, AR, CT, DE, LA, MA,
and WY combined into “Other States” beginning in 2025.
Select Farm Level Annual Average Milk Prices
Sources: USDA/AMS; USDA/NASS: Milk Production, Disposition, and Income.
Note: Class III and Class IV price at 3.5% milkfat; all others at test. NASS discontinued reporting manufacturing grade and fluid grade milk prices in 2011.
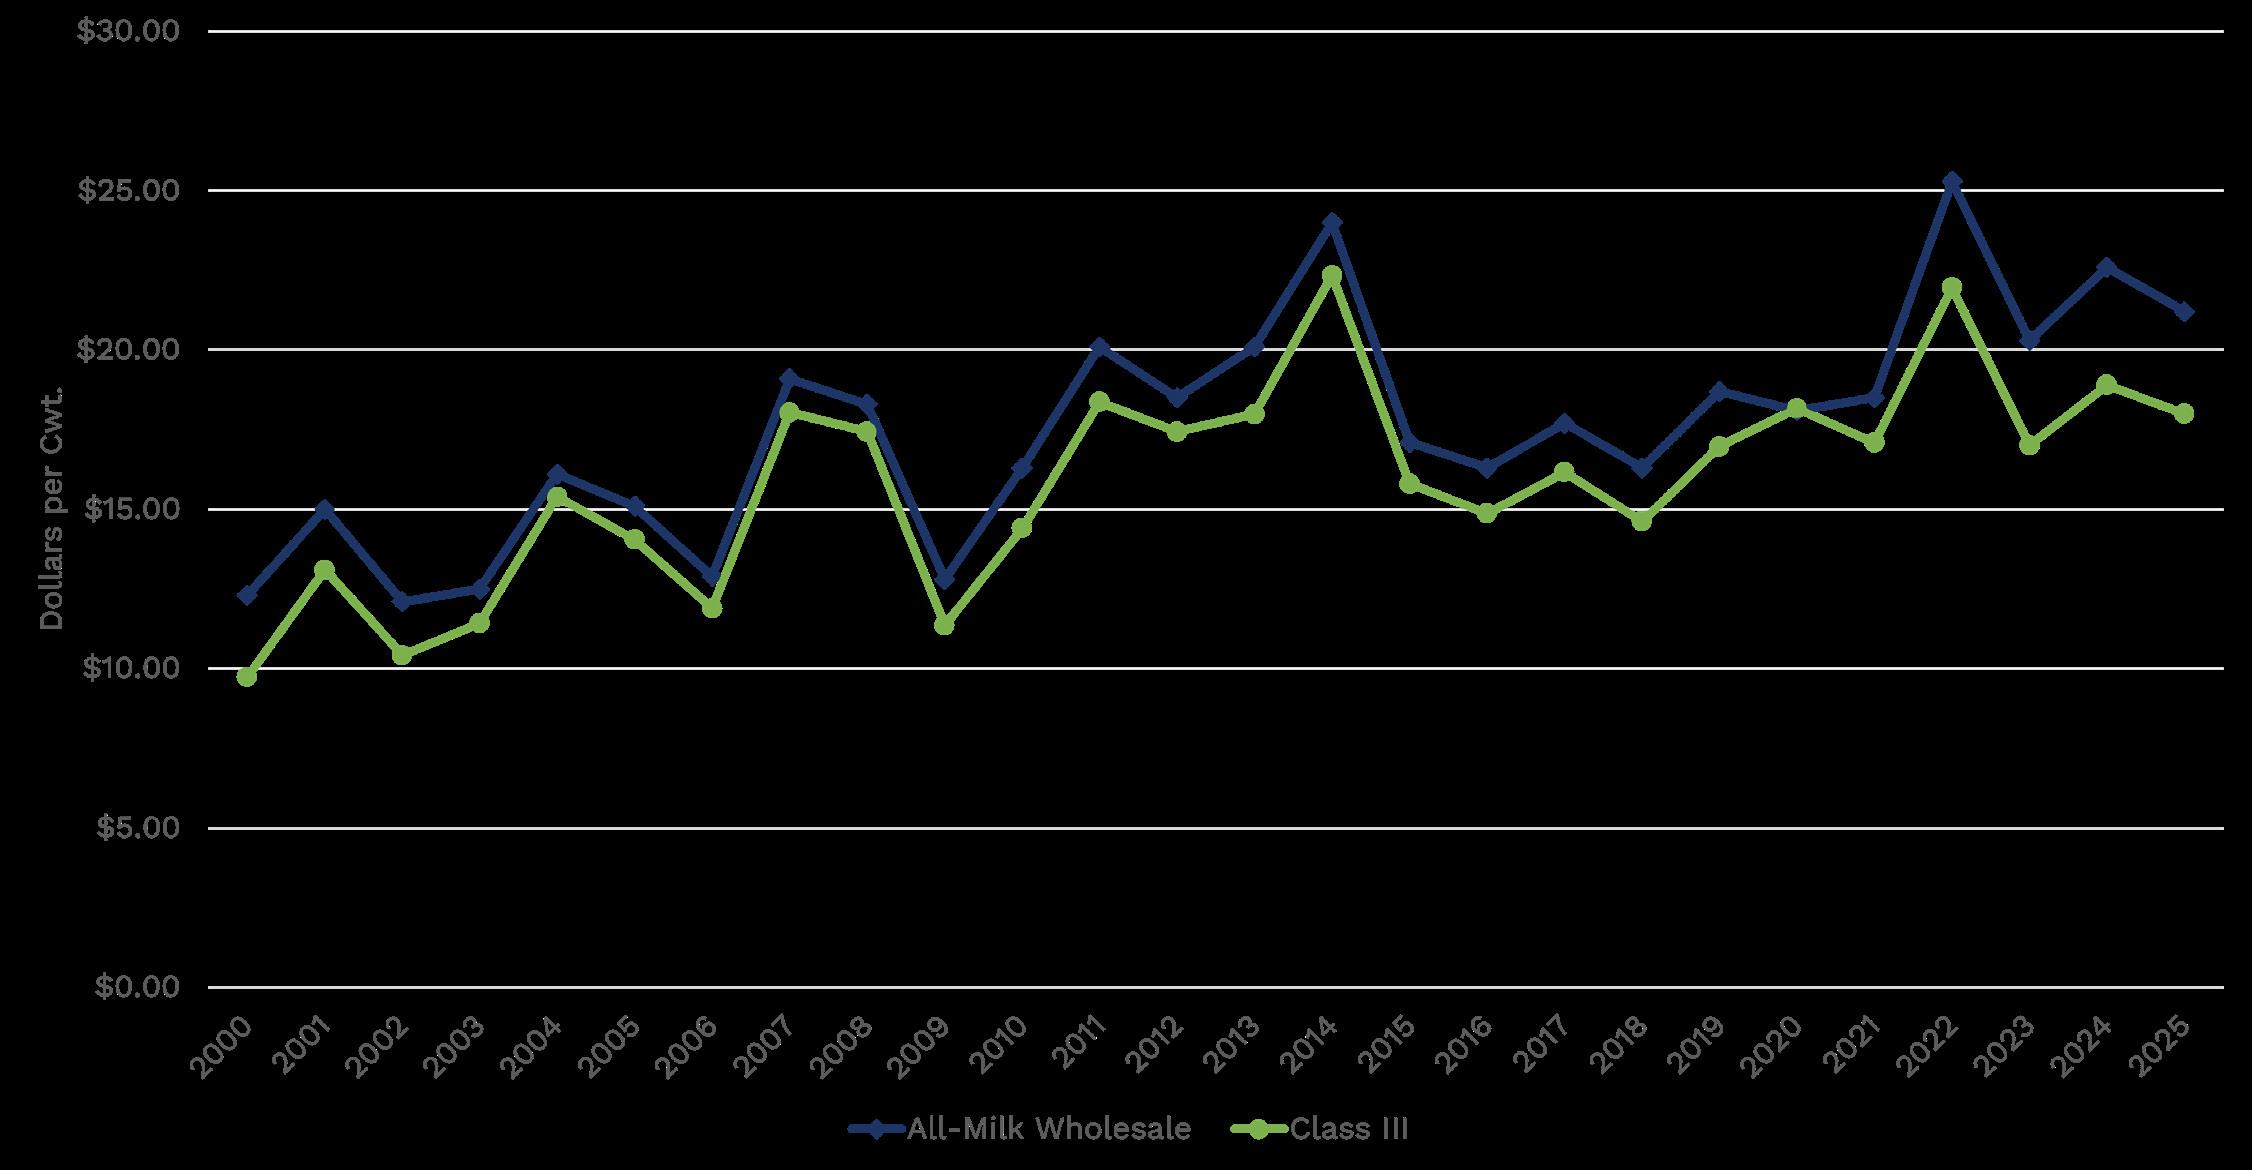
All-Milk Price and Class III Price
Sources: USDA/AMS; USDA/NASS: Milk Production, Disposition, and Income.
Monthly
Seasonality of U.S. All-Milk Price and Milk Production
Jun
Source: USDA/NASS: Prices Received and Milk Production.
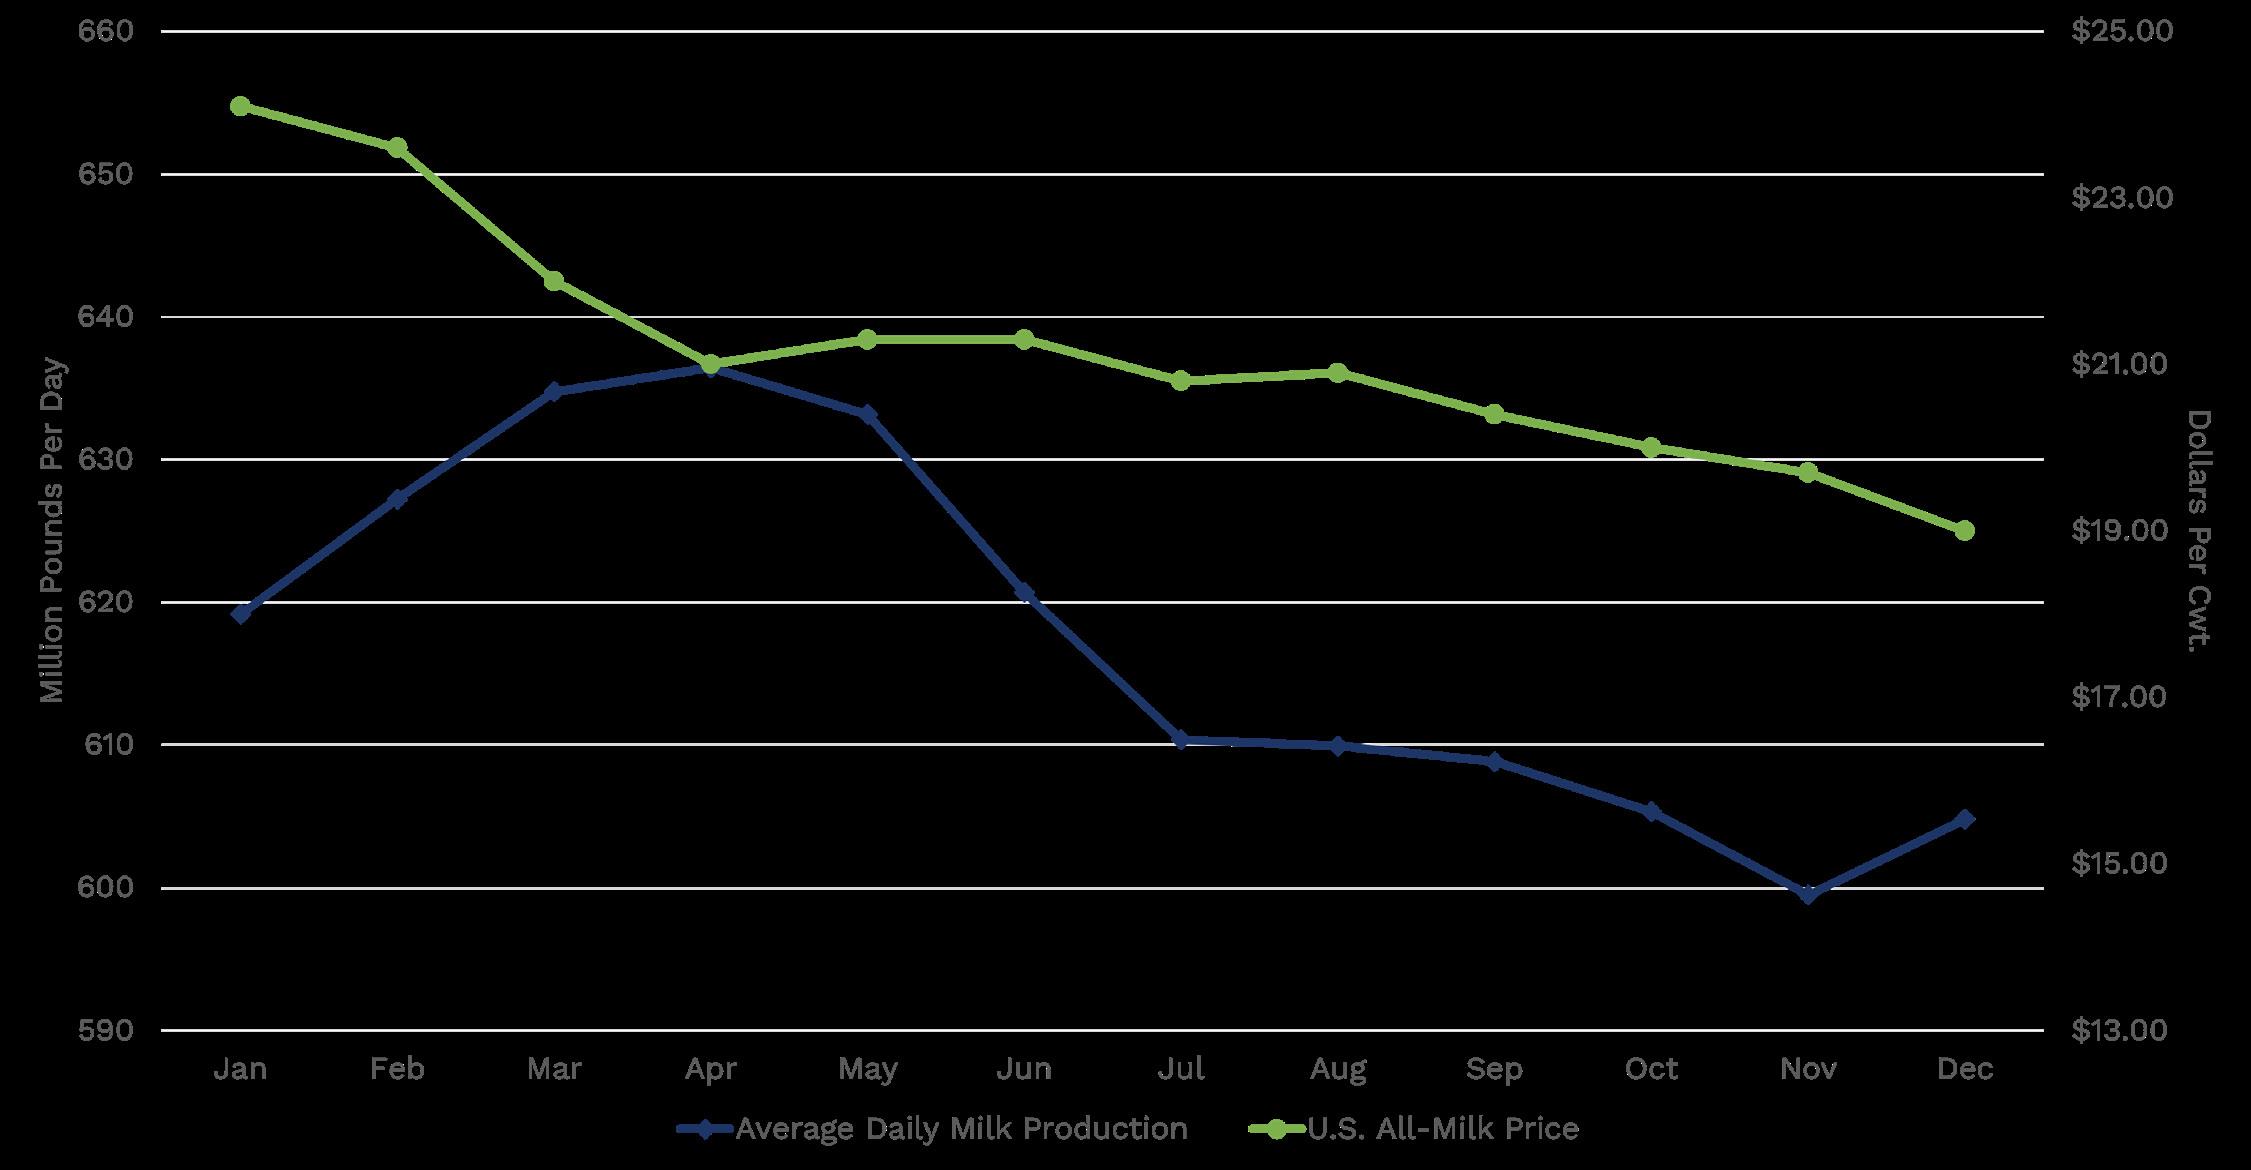
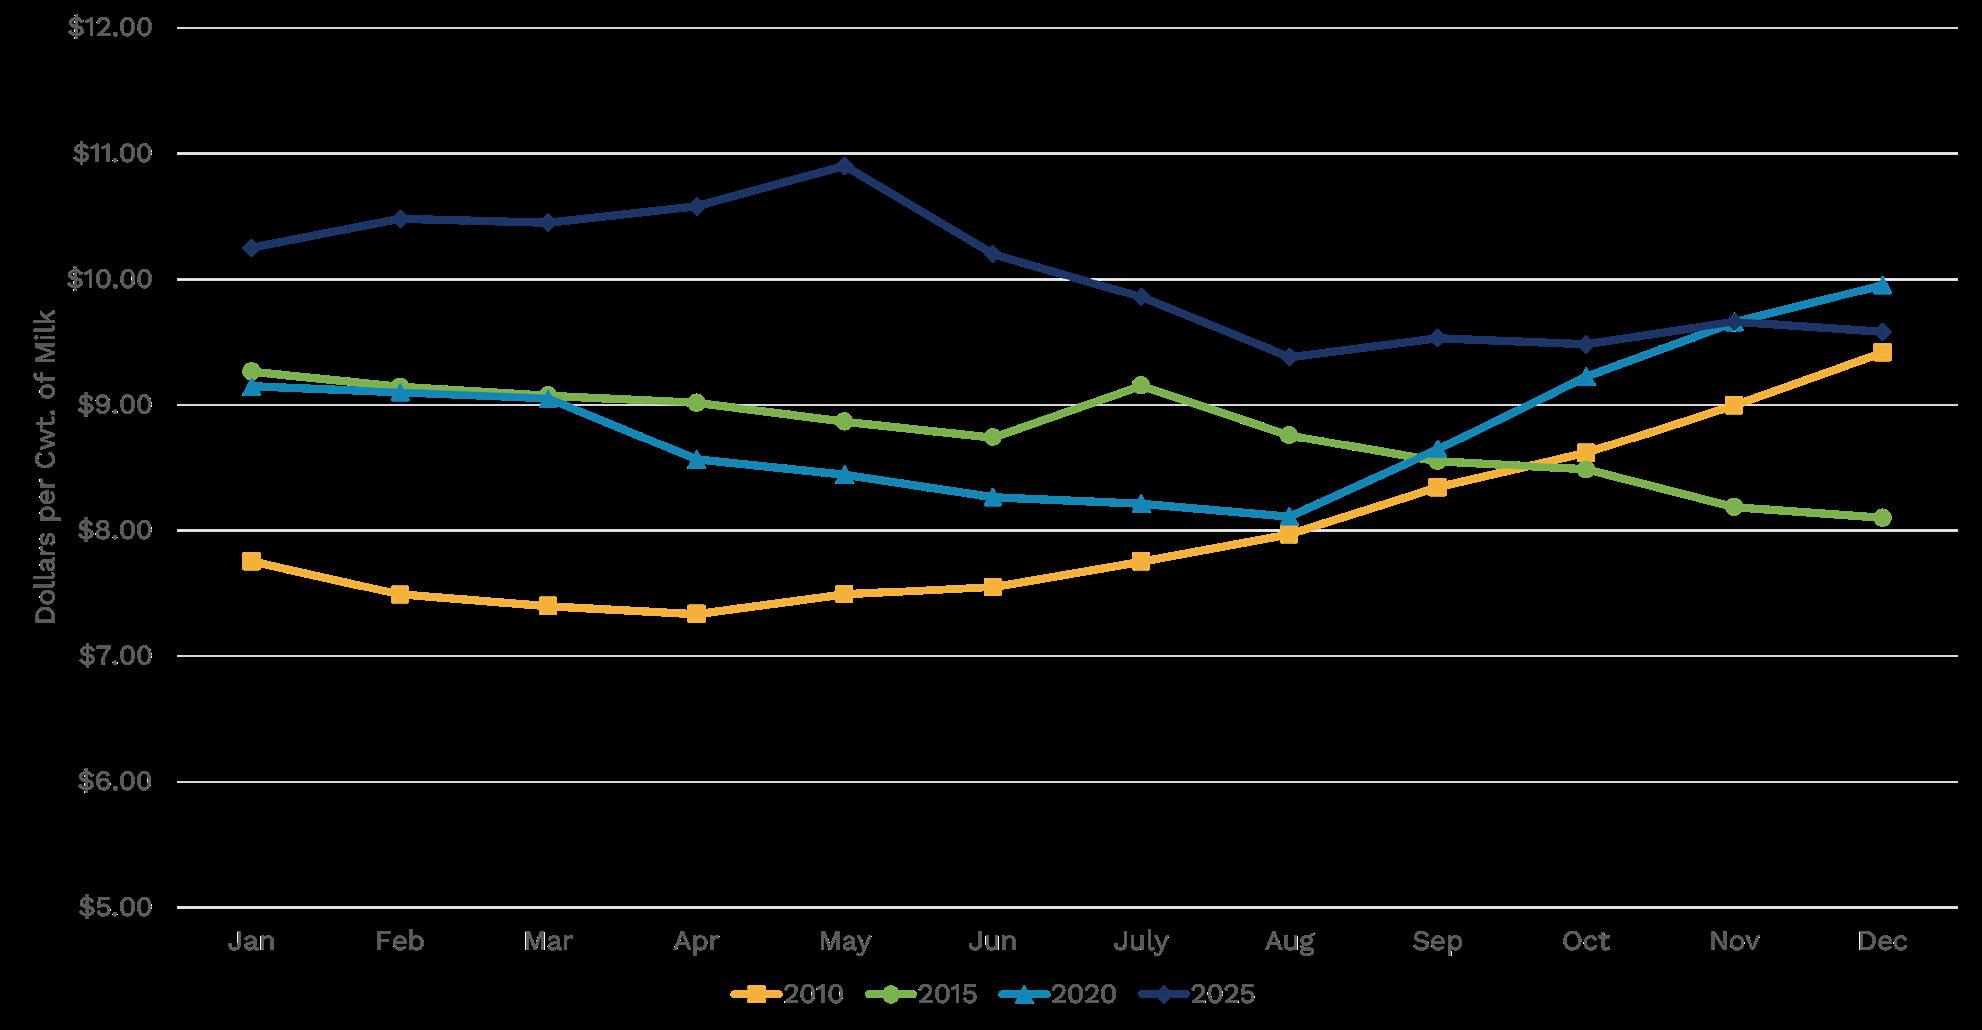
Seasonality of Milk Supply and Price, 2025
Source: USDA/NASS: Prices Received and Milk Production.
Average Annual Dairy Product Prices, National Dairy Product Sales Report
Source: USDA AMS National Dairy Products Sales Report
1 CME price through 1995
2 Cheese prices: National Cheese Exchange through 1995
3 USDA AMS Central (Low/Med) through 1995
Monthly Prices of Dairy Products on Chicago Mercantile Exchange
Source: Chicago Mercantile Exchange
Annual Retail Prices for Select Dairy Products
Sources: U.S. Bureau of Labor Statistics, U.S. Department of Labor.
¹ Source: USDA / ERS Agricultural Outlook; all dairy. Beginning 2011, NMPF estimate.
2 No government reporting for October
Farm
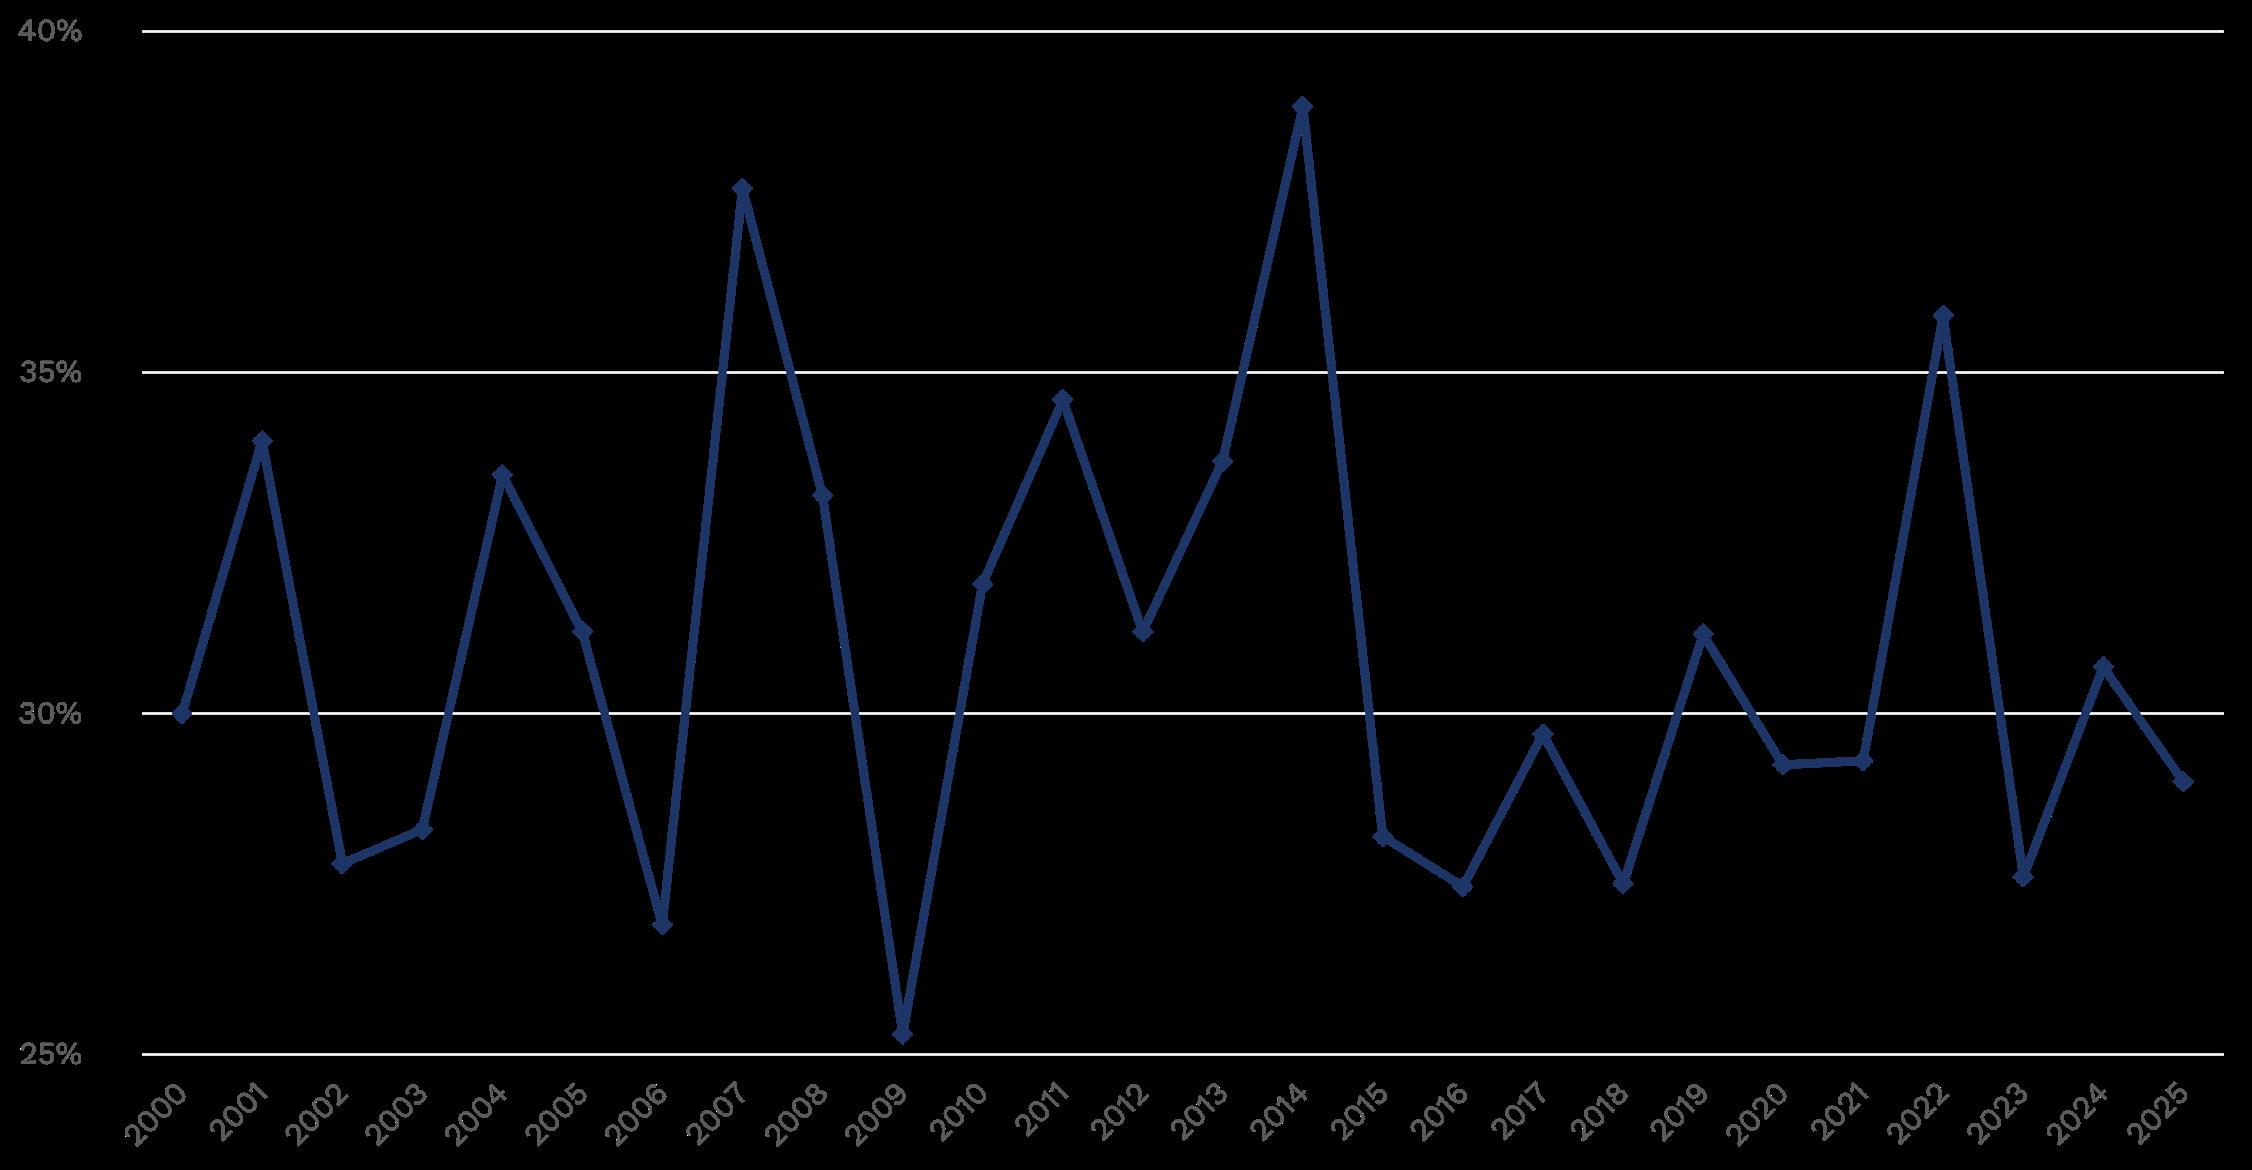
Value of Milk as Percent of Retail Value
Sources: Bureau of Labor Statistics, Department of Labor.
Cost of Milk Production Indicators
Milk
Production Costs and Returns by Herd Size, 20251
Source: USDA / ERS.
1 Milk cost of production estimates based on 2021 USDA ARMS data from milk producers, with subsequent updates based upon annual price changes.
2 Income from renting or leasing dairy stock to other operations; renting space to other dairy operations; co-op patronage dividends associated with the dairy; assessment rebates, refunds, and other dairy-related resources; and the fertilizer value of manure production.
3 Costs for third party organic certification
4 Machinery and equipment, housing, manure handling, feed storage structures, and the dairy breeding herd.
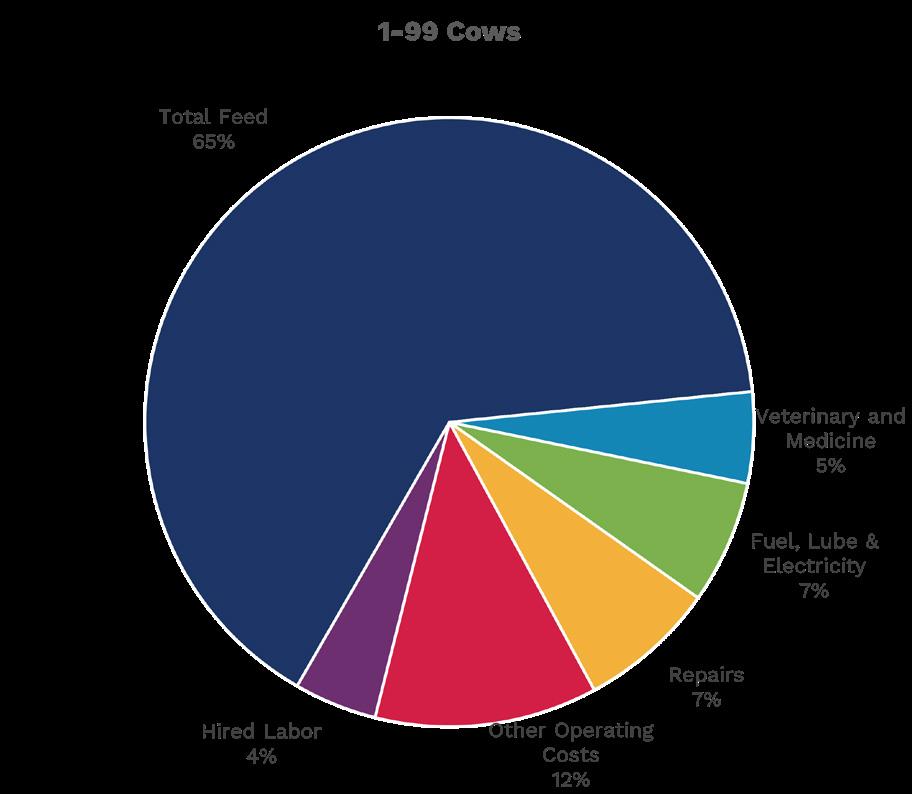
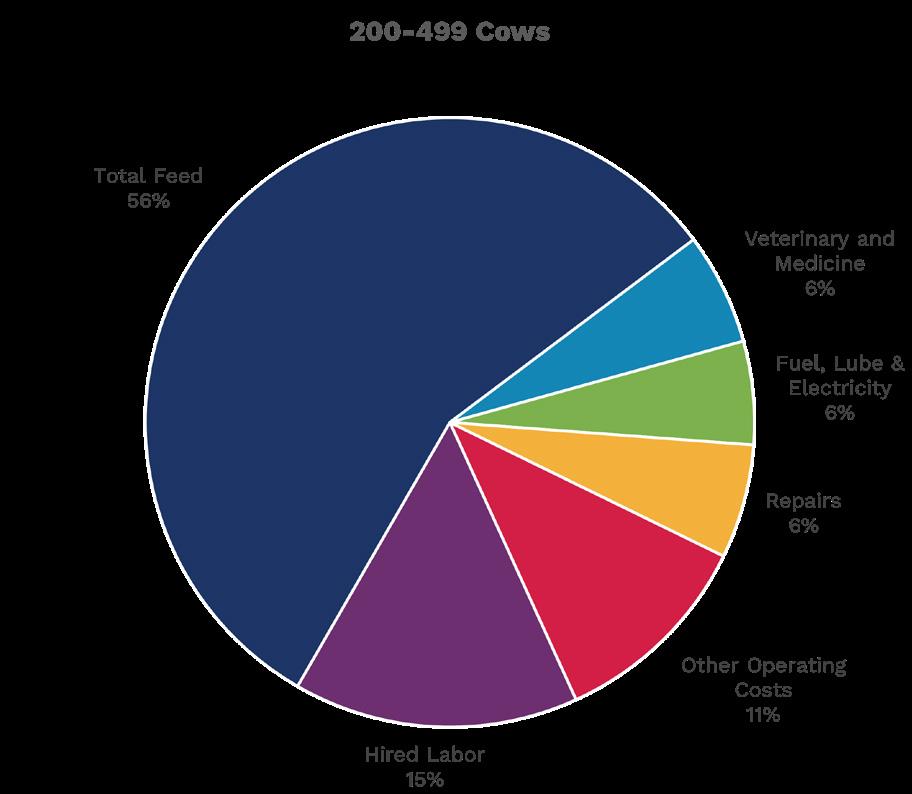
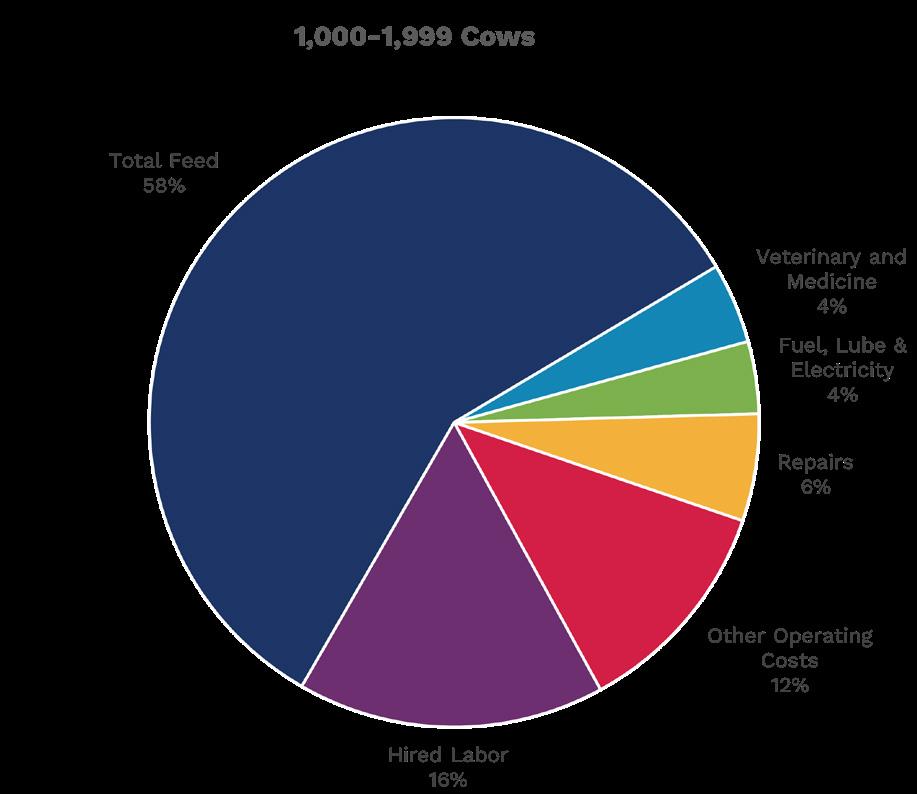
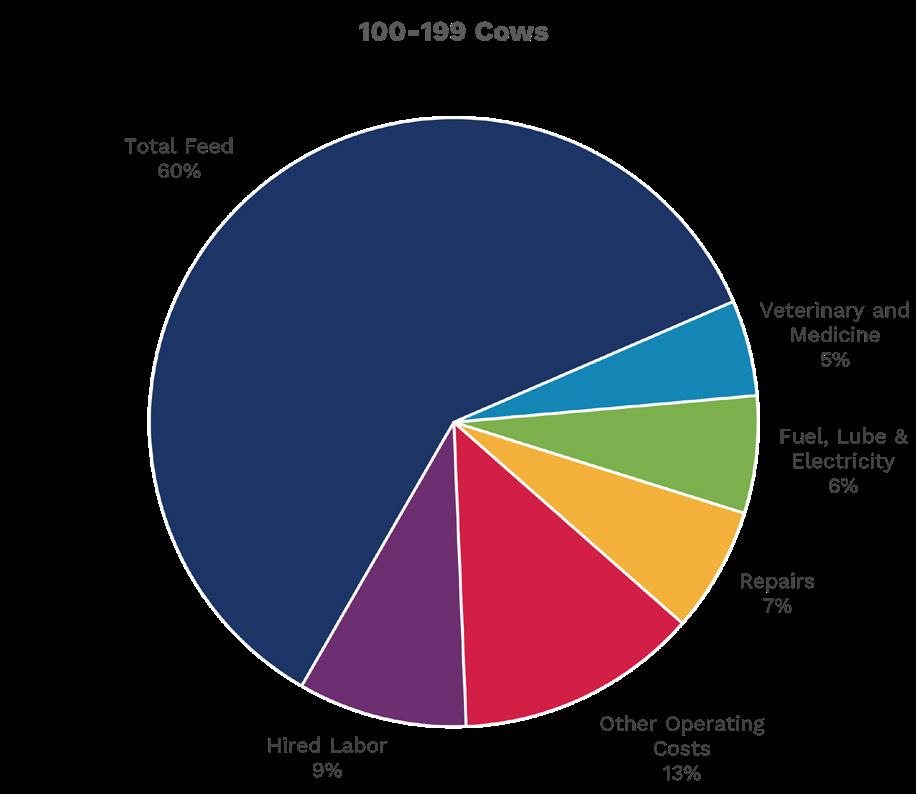
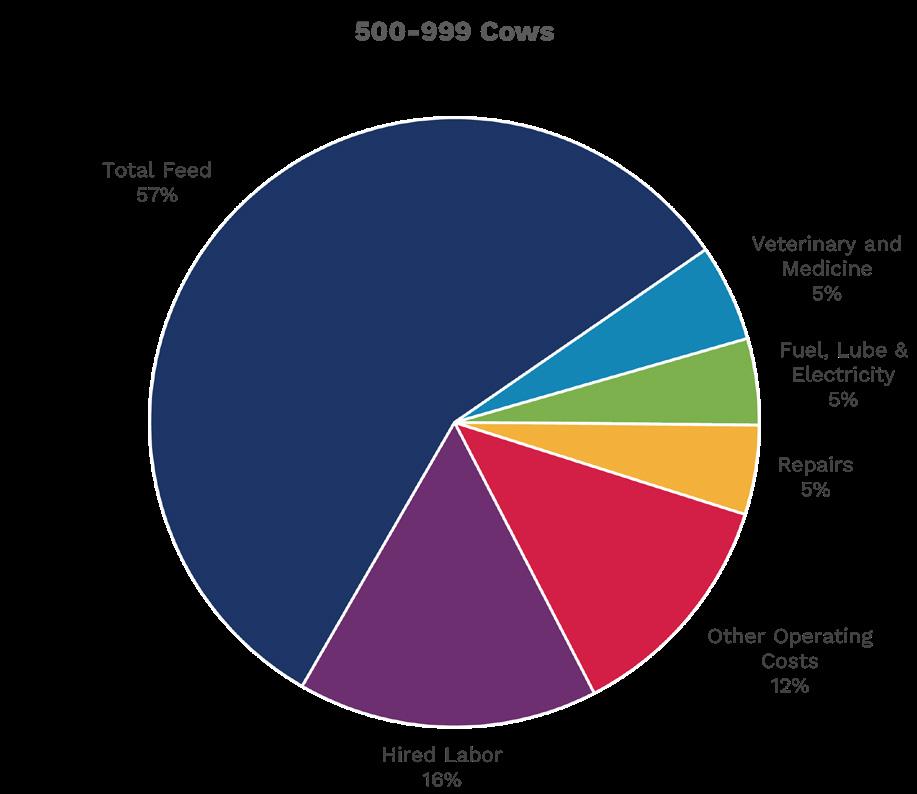
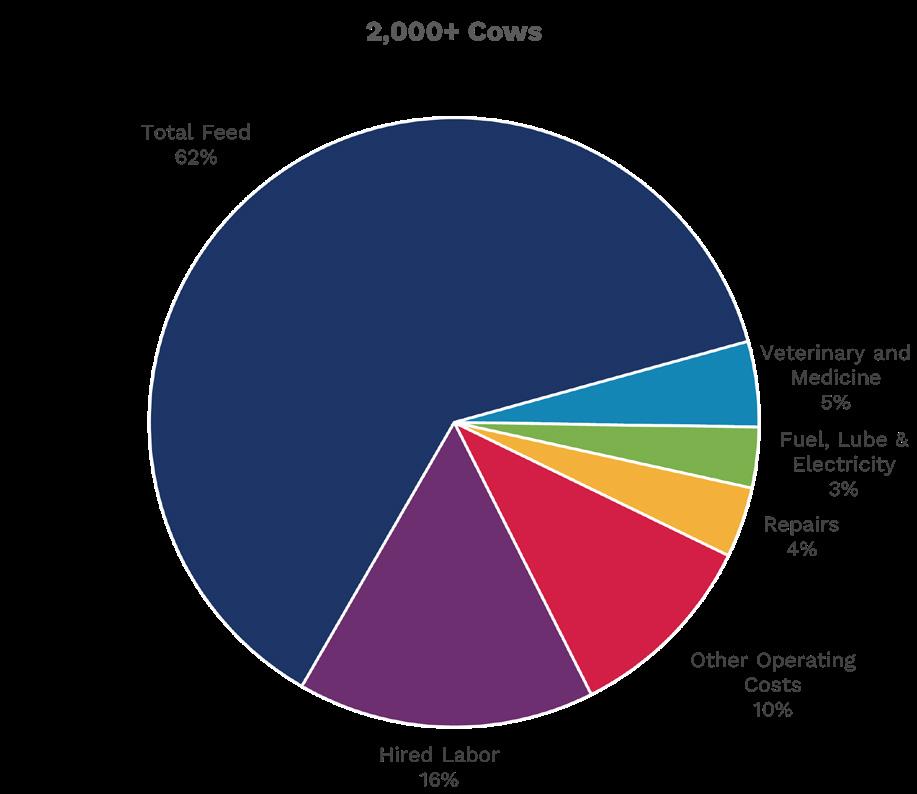
Share of Cash Expenses by Size of Operation
Source: USDA / ERS. Does not show allocated overhead costs, except hired labor.
U.S. Milk Production Costs and Returns
Source: USDA / ERS.
¹ Income from renting or leasing dairy stock to other operations; renting space to other dairy operations; co-op patronage dividends associated with the dairy; assessment rebates, refunds, and other dairy-related resources; and the fertilizer value of manure production.
² Costs for third party organic certification
³ Machinery and equipment, housing, manure handling, feed storage structures, and the dairy breeding herd.
Monthly Milk-to-Feed Price Ratio1
18
Monthly Dairy Margin Coverage/Margin Protection Program Calculated Feed Cost ($ per Cwt. of milk)2
10
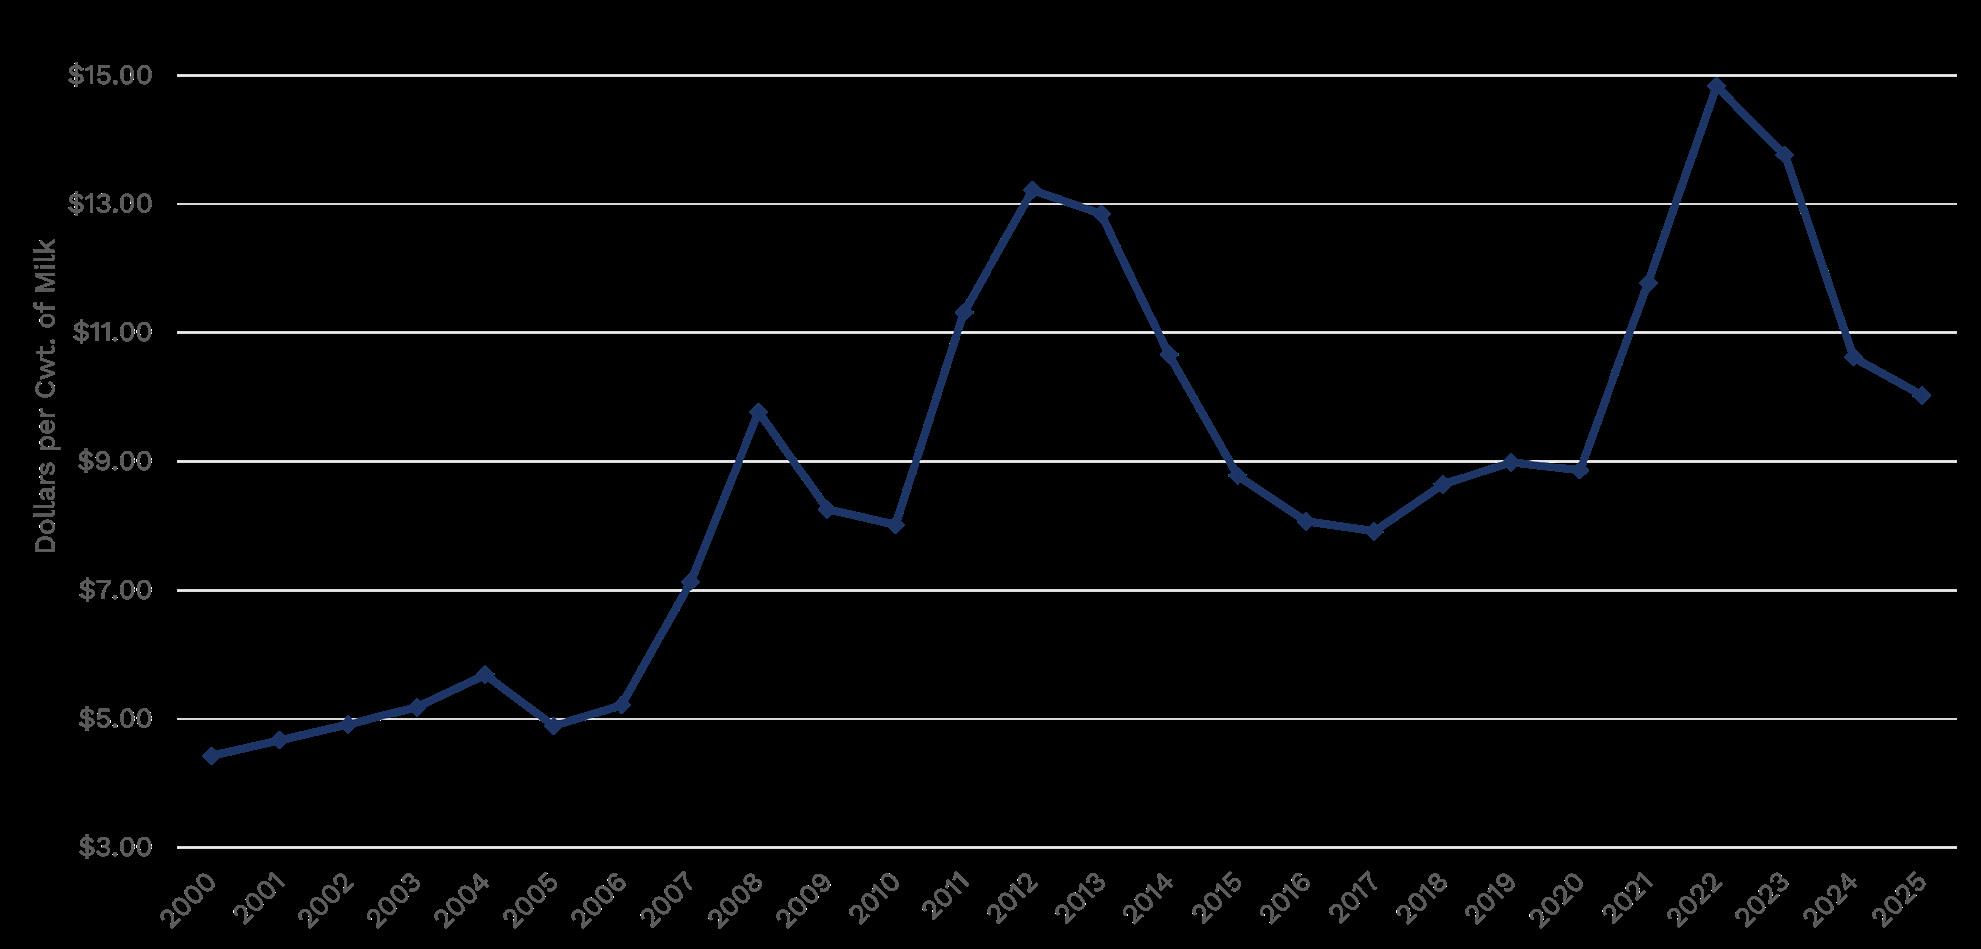
Average Annual Dairy Margin Coverage/Margin Protection Program Calculated Feed Cost
FIGURE 11
Monthly Dairy Margin Coverage/Margin Protection Program Calculated Feed Cost
Sources: USDA / NASS and USDA / AMS.
Monthly Dairy Margin Coverage/Margin Protection Program
Source: USDA / NASS and USDA / AMS.
¹ Margin as defined in the 2014 and 2018 farm bills.
FIGURE 12
Average Annual Dairy Margin Coverage/Margin Protection Program Margin
13
Dairy Margin Coverage Margin
Sources: USDA / NASS and USDA / AMS.
FIGURE
Average Prices Received for Livestock
Average
Price Received for Replacement Milk Cows
Sources: USDA / NASS and USDA / AMS.
Average Prices Received for Crops
Source: USDA / NASS: Agricultural Prices. Prices are season averages for crop years.
1 Marketing years beginning: June (barley and oats); September (soybeans, corn, and May (hay).
2 Prior to 1990, all hay. Soybean meal prices are calendar year averages of high protein soybean meal at Decatur-Central Illinois as reported by USDA/AMS.
Crop Production
Source: USDA / NASS: Crop Production Annual.
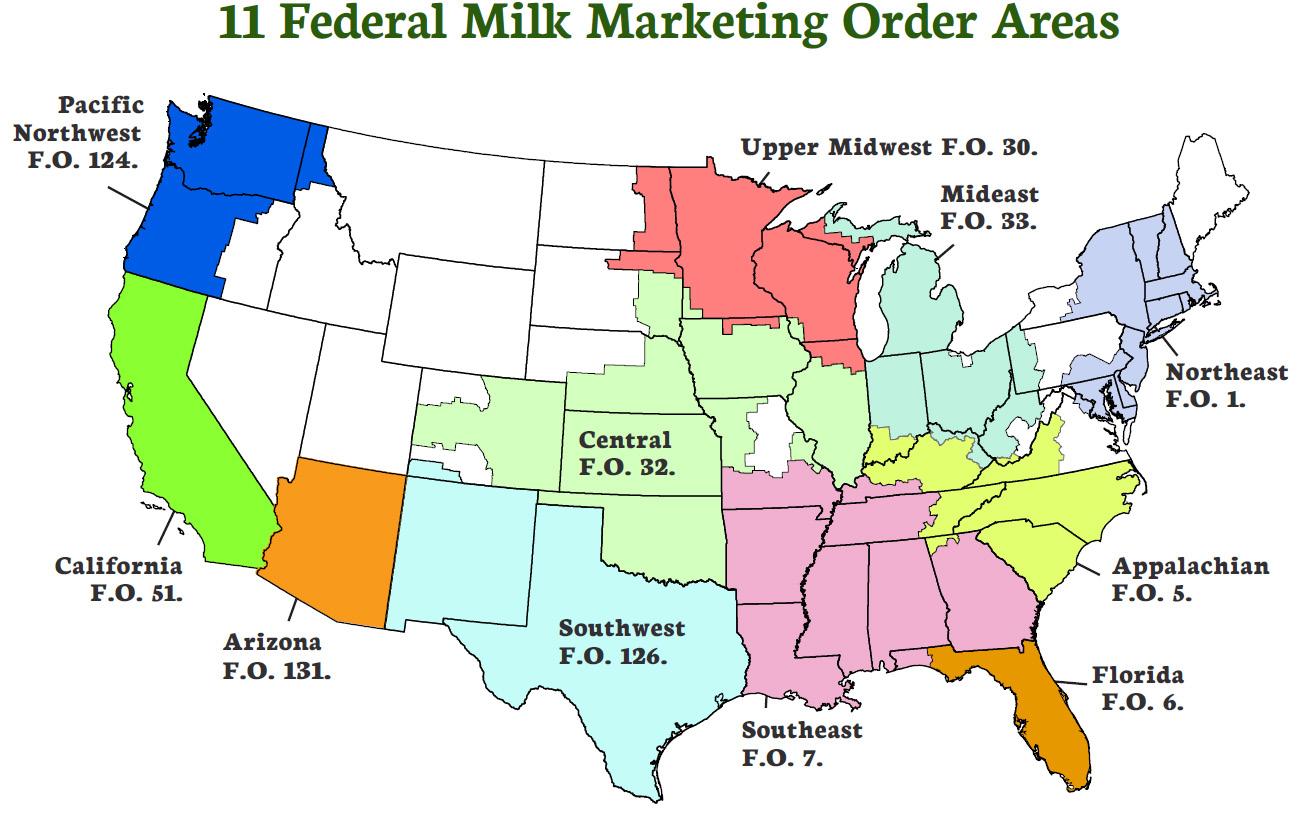
Scope of Federal Milk Marketing Orders
Federal
Milk Marketing Order Statistics by Market, 2025
Source: USDA / AMS
Measures of Growth in Federal Milk Marketing Orders
Source: USDA / AMS, Dairy Market Statistics.
¹ Includes California order, effective November 1, 2018
Sales and Butterfat Content of Fluid Milk Products in Federal Milk Marketing Orders1
Source: USDA/AMS, Federal Milk Order Market Statistics, NMPF Calculations
¹ Fluid milk products: plain and flavored whole, lowfat and skim milk, buttermilk and drinkable yogurt, including organic products. Beginning 2015, estimated U.S. sales.
Average Butterfat Content of Fluid Milk Products1
Source: USDA/AMS, Federal Milk Order Market Statistics, NMPF Calculations
¹ Fluid milk products: plain and flavored whole, lowfat and skim milk, buttermilk and drinkable yogurt, including organic products. Beginning 2015, estimated U.S. sales.
Dairy Product Consumption and Production
Annual Total Utilization of Dairy Products
Source: NMPF and USDA / ERS: Livestock, Dairy, and Poultry Situation and Outlook
Excludes exports beginning 1995
¹ Excludes whey values
²Includes skim milk powder
Per Capita Total Utilization of Dairy Products
Source: NMPF and USDA / ERS: Livestock, Dairy, and Poultry Situation and Outlook
Excludes exports beginning 1995.
¹ Excludes whey values
Share of Total Utilization by Product
Source: NMPF; Shares are based on a milk equivalent, total solids basis. Includes exports.
¹ Excludes whey values
² Includes skim milk powder
Share of Total Utilization by Product
Source: NMPF; Shares are based on a milk equivalent, total solids basis. Includes exports.
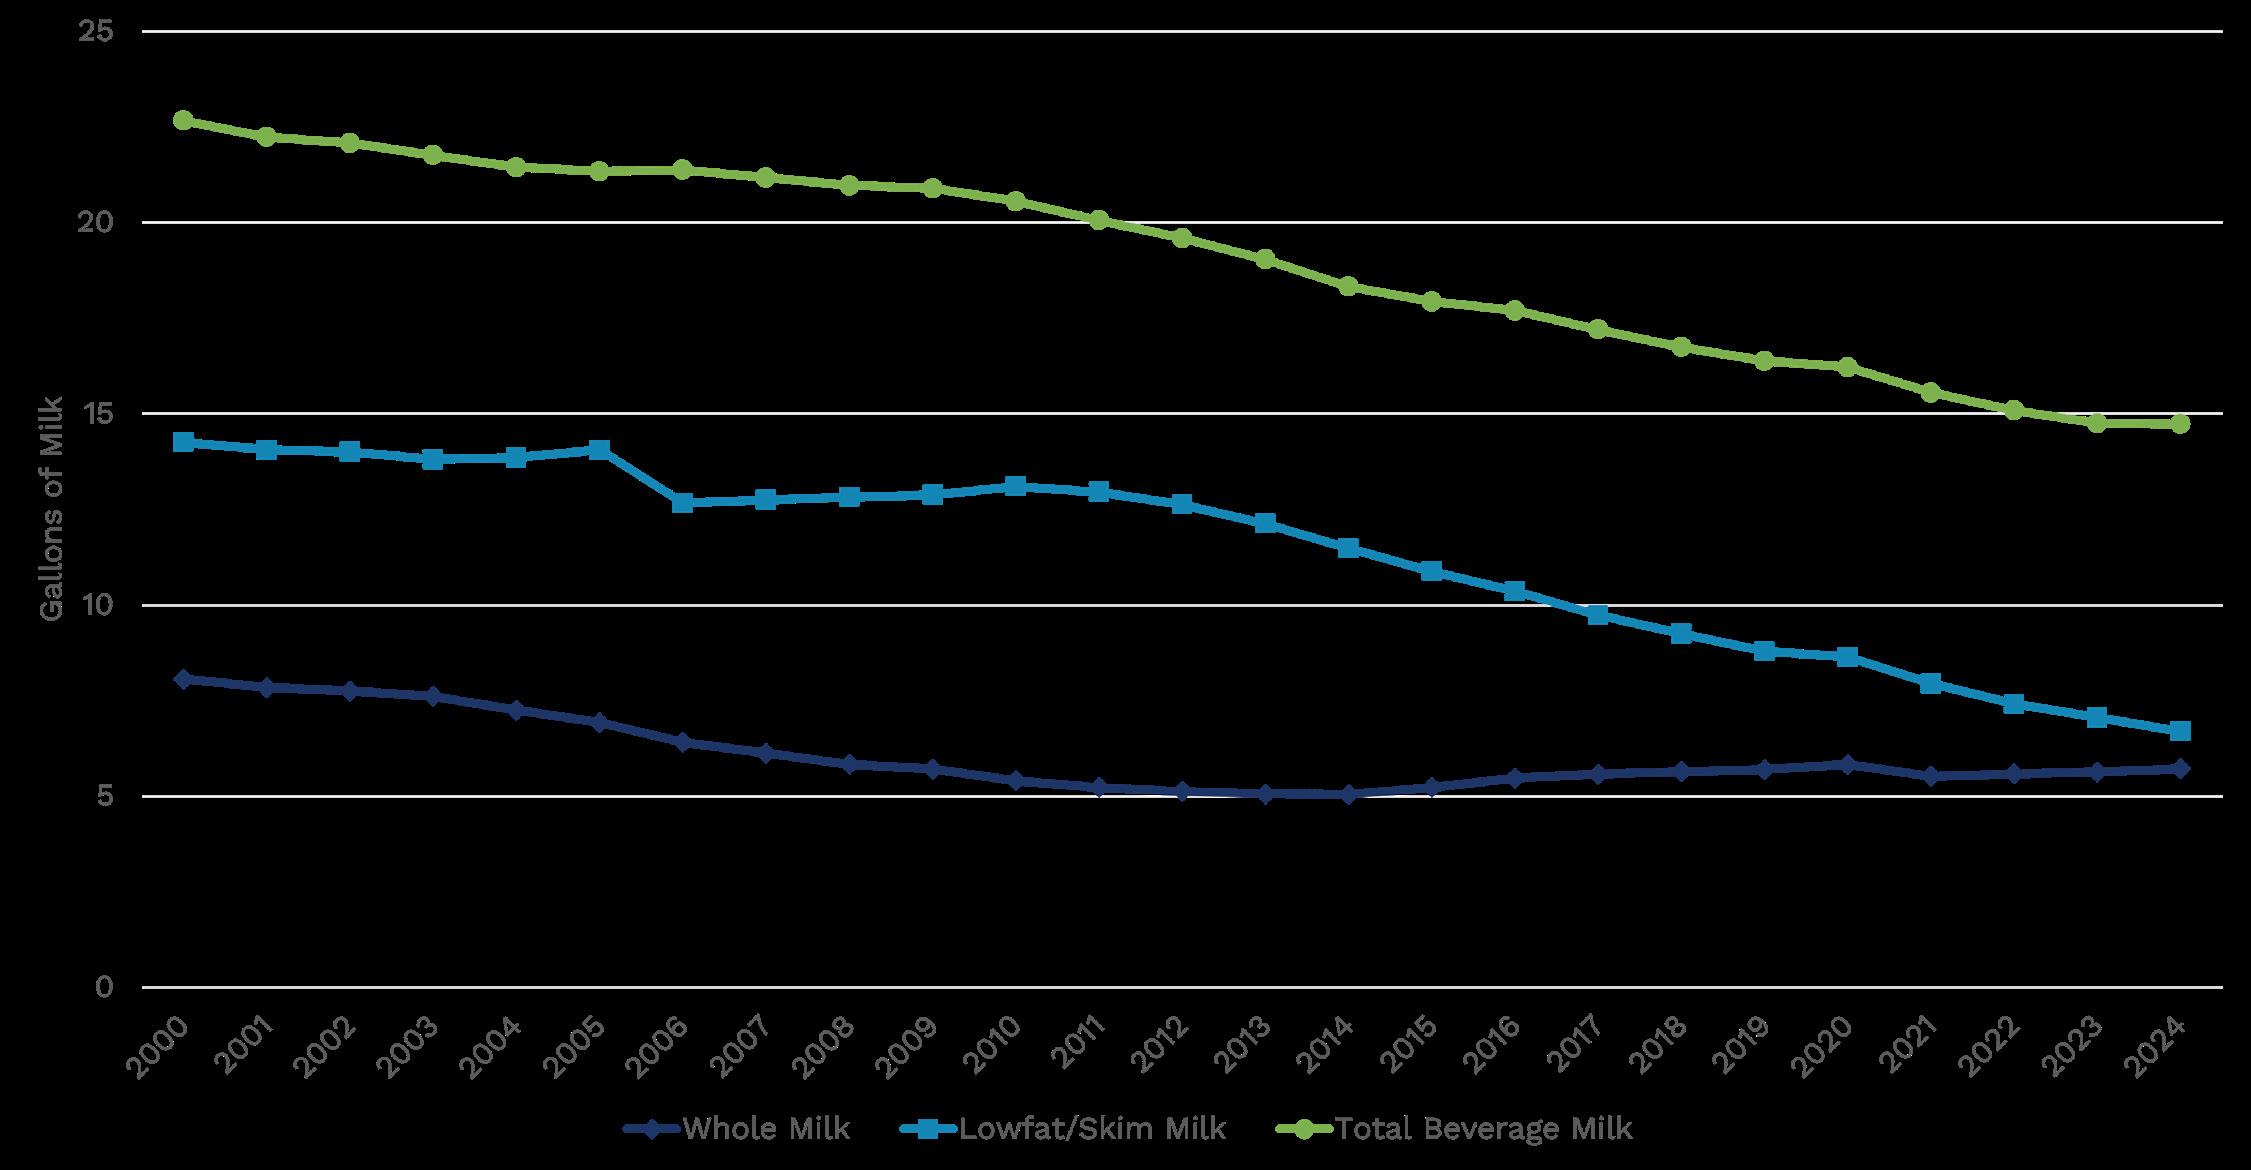
Fluid Milk Sales by Product
Source: USDA / ERS: Livestock, Dairy, and Poultry Situation and Outlook. Includes conventional and organic milk. Total includes miscellaneous fluid milk products, beginning 2003.
Per Capita Fluid Milk Sales, Select Products
Source: USDA / ERS: Livestock, Dairy, and Poultry Situation and Outlook. Includes conventional and organic milk. Total includes miscellaneous fluid milk products, beginning 2003.
Sales of Cream and Other Products
Source: USDA / ERS: Livestock, Dairy, and Poultry Situation and Outlook and NMPF.
Note: Light and heavy cream no longer separated, beginning 2000. Cream and half and half no longer separated, beginning 2002. Total includes miscellaneous fluid milk products, beginning 2003. Fluid cream no longer reported, beginning 2019.
Per Capita Sales of Fluid Milk
Source: USDA / ERS: Livestock, Dairy, and Poultry Situation and Outlook and NMPF.
Cheese Production, Select Varieties
Source: USDA / NASS: Dairy Products
Per Capita Cheese Consumption, Select Varieties
Source: USDA / ERS: Livestock, Dairy, and Poultry Situation and Outlook Tables and NMPF
¹² Whey protein concentrate for human consumption.
¹³ 90% or more protein by weight.
Commodity Credit Corporation Net Outlays by Commodity, Fiscal Year
Source: USDA/ERS, Agricultural Outlook Tables; USDA Budget Summary annual publications.
¹ Does not include $8.5 billion dollars in Coronavirus Food Assistance Program (CFAP) payments during Fiscal Year 2020. CFAP payments were not CCC outlays but supplemental funding under the Office of the Secretary of Agriculture. Dairy’s share of the $30.6 billion dollars of total CFAP payments during fiscal years 2020 and 2021 was $3.0 billion dollars, or 9.9% of the total.
2 USDA estimated budget outlays
Dairy Share Of Total Commodity Credit Corporation Outlays
Source: USDA/ERS, Agricultural Outlook Tables; USDA Budget Summary annual publications.
U.S. Dairy Trade
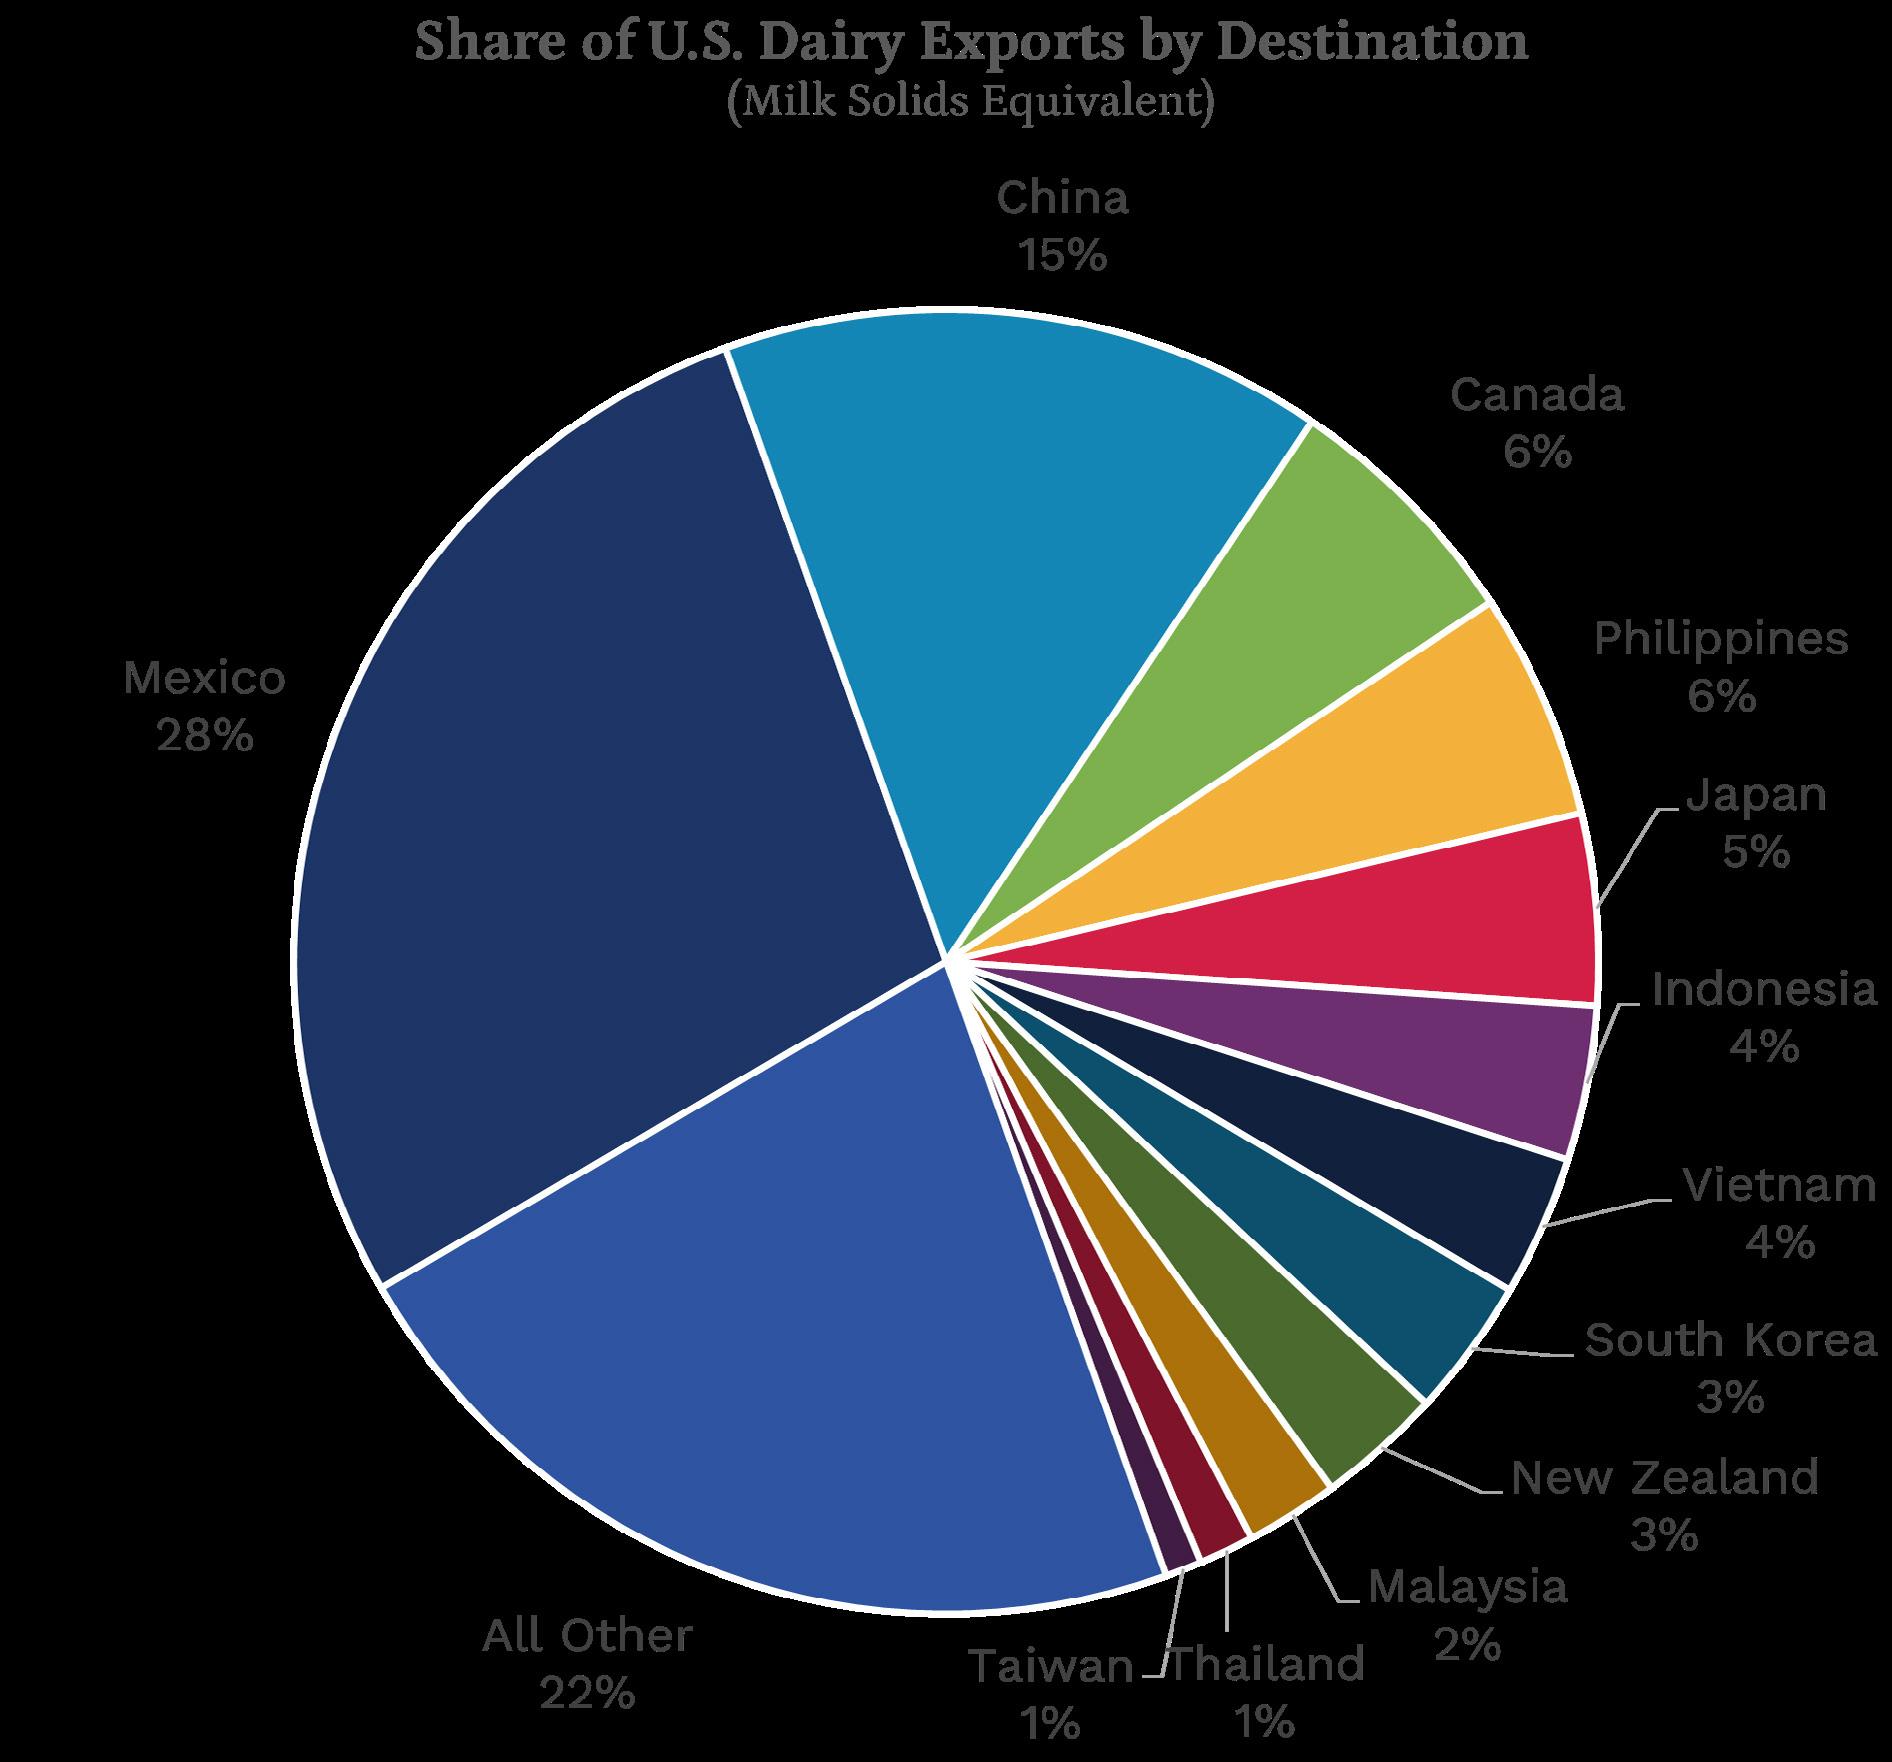
U.S. Dairy Exports by Destination
U.S. Milk and Cream Exports
Source: USDA/FAS
U.S. Butter Exports
Source: USDA/FAS
U.S. Cheese Exports
Source: USDA/FAS
U.S. Nonfat Dry Milk/Skim Milk Powder Exports
Source: USDA/FAS
U.S. Whole Milk Powder Exports
Source: USDA/FAS
U.S. Ice Cream Exports
Source: USDA/FAS
U.S. Yogurt Exports
U.S. Dry Whey Exports
Source: USDA/FAS
U.S. High Protein Whey Exports
Source: USDA/FAS
U.S. Lactose Exports
Source: USDA/FAS
Dairy Exports & Domestic Disappearance
Source: USDA/Economic Research Service, U.S. Census Bureau and NMPF.
¹ Total exports per U.S. resident.
² Per capita consumption by U.S. resident population.
³ Total utilization per U.S. resident.
Dairy Exports
Source: USDA/Economic Research Service, U.S. Census Bureau and NMPF.
Dairy Imports
Source: USDA/FAS; U.S. Bureau of the Census; NMPF.
¹ TRQ: Tariff Rate Quota. “Out of quota” includes all corresponding quota-type products entering the U.S. on an out-of-quota dutypaid basis.
² Includes non-cow’s milk cheeses.
³ All cheese, including TRQ and non-TRQ cheese. Totals will not add because in-quota TRQ cheese volumes are determined by Customs and Border Protection using different data.
⁴ Includes products whose composition consists only partly of dairy components.
U.S. Economic Indicators and Other Statistics
Price Indices: Annual Average, Not Seasonally Adjusted
Source: Bureau of Labor Statistics and USDA/NASS, Agricultural Prices
Minutes of Work Required to Purchase Select Dairy Products
Commodity Receipts from Marketings
Source: USDA / ERS: Agricultural Outlook Tables, Cash Receipts data.
Largest U.S. Dairy Cooperatives, 2024
Number and Net Volume of Products, Supplies and Services by
“Other” includes total cooperatives handling beans and peas, nuts, tobacco, wool and other misc.
Number of cooperatives may not add due to overlap. Most recent publication of these statistics is for 2023.
International Milk Production Statistics, 2025
Source: USDA / FAS and UN / FAO.
Glossary
American Cheese
Principally cheddar cheese but includes other varieties such as Colby or Jack. The term does not include Swiss, Muenster, Blue, Italian cheese varieties, and other distinctive types.
Total Utilization
Total utilization is calculated as total domestic disappearance plus exports. Domestic disappearance is calculated as production plus imports less the net change in stocks.
Milk Equivalent
The amount of farm milk represented by a quantity of dairy products. Most often used to aggregate stocks, trade, or removals of various dairy products on a common component basis, such as milkfat, skim solids, or total milk solids.
Milk Sold to Plants and Dealers
A term long used by USDA to mean milk production less that portion utilized on the farm or marketed directly by farmers to consumers.
Dairy Margin Coverage (DMC) Program Margin
As defined in the 2018 Farm Bill, the income over feed cost margin is equal to the national monthly all-milk price (reported monthly by USDA NASS) minus average feed costs, computed from a formula using national benchmark prices of corn, soybean meal, and alfalfa hay. Formerly the Margin Protection Program for Dairy (MPP) Margin.
DMC Feed Cost
As defined in the 2018 Farm Bill, the feed cost to be used in calculating premiums is the national average feed cost. It includes the U.S. average corn price/bushel, Central Illinois soybean meal price/ton, and price of alfalfa hay price/ton. Formerly the MPP (Margin Protection Program for Dairy) Feed Cost.
National Average Cost of Feed Calculation
=1.0729 X U.S. average corn price/bushel
+0.00735 X Central Illinois soybean meal price/ton
+0.0137 X Average of U.S. average alfalfa hay price/ton and 5-state average of premium and supreme alfalfa hay (scheduled for recalculation, from January 2020, as 100% of the 5-state dairy quality alfalfa hay price).