
2025 NACWA Cost of Clean Water Index

Page 1


2025 Cost of Clean Water Index

110

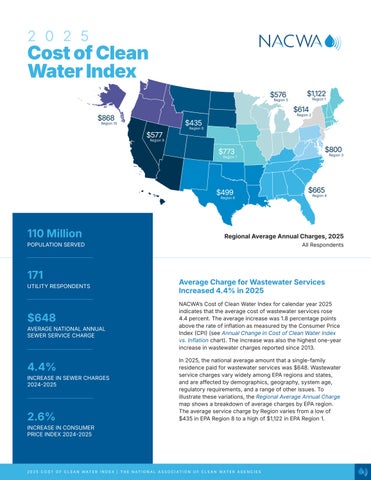
Regional Average Annual Charges, 2025 All Respondents

Average Charge for Wastewater Services

Increased

4.4% in 2025

NACWA’s Cost of Clean Water Index for calendar year 2025 indicates that the average cost of wastewater services rose 4.4 percent. The average increase was 1.8 percentage points above the rate of inflation as measured by the Consumer Price Index (CPI) (see Annual Change in Cost of Clean Water Index vs. Inflation chart). The increase was also the highest one-year increase in wastewater charges reported since 2013.

In 2025, the national average amount that a single-family residence paid for wastewater services was $648. Wastewater service charges vary widely among EPA regions and states, and are affected by demographics, geography, system age, regulatory requirements, and a range of other issues. To illustrate these variations, the Regional Average Annual Charge map shows a breakdown of average charges by EPA region. The average service charge by Region varies from a low of $435 in EPA Region 8 to a high of $1,122 in EPA Region 1.

Annual Change in the Cost of Clean Water Index vs. Inflation

The Annual Change in the Cost of Clean Water Index vs. Inflation chart presents a national snapshot of the increase in service charges, as compared to inflation, since 2005. Table A-1 provides additional detail, including a breakdown of NACWA Index values and service charges back to 1985, the base year for the Index. The values for 2025 are based on the responses from 171 NACWA members serving nearly 110 million people.

Customers pay for sewer services in a variety of ways. Charges may be based on property values, gallons of water used, on a flat rate, or include some combination of these values. Because of this variability, the NACWA Index uses what the average single-family residence pays annually because it is a more consistent measure to track the cost of services over time. In 2025, the majority of clean water utilities implemented rate structures that resulted in increases in the average annual household service charge. However, in some communities, volume-based rates increased, but average service charges dropped due to reductions in actual or estimated residential water use or decreased revenues. Additional national and regional data are included in Tables A-1 and A-3.

Average Annual Service Charge Exceeds 2.0% of Poverty Threshold

The Average Annual Service Charge chart presents a national snapshot of wastewater service charges since 2005 and provides a projection of average charges through 2030. In comparison to the Consumer Price Index (CPI), the annual sewer service charge has increased at nearly double the rate of the CPI since 2005 and has nearly doubled in value since 2008. The average annual sewer charge of $648 represents over 2.0 percent (2.02 percent) of the 2025 federal poverty income threshold ($32,150) for a family of four.

Average Annual Service Charge 2005 – 2025 & Projected

Average Sewer Rates Projected to Increase 34% from 2025 to 2030

Infrastructure needs, as well as inflationary and regulatory cost pressures, are leading to a higher prevalence of approved and planned rate increases nationwide. Eighty-eight percent (88%) of agencies reported approved or planned rate increases for 2026.

From 2025-2030, rates for wastewater services are expected to increase approximately 5 to 6 percent per year (see Table A.2) with an average cumulative fiveyear increase of 34 percent (see Average Cumulative Projected Increases in Sewer Charges chart which shows the average of projected increases in charges among agency respondents in one, two, three, four and five-year increments).

These rate increases are being driven by many factors, including regulatory compliance costs, especially consent decrees and stricter treatment requirements, as well as major expenses for capital improvement projects, aging infrastructure repair and replacement, and system expansion to meet growth and capacity needs. Respondents also cite inflation which has increased construction, labor, materials, energy, and operating costs, causing many utilities to project increases above historical levels.

Disclaimers: The NACWA Index strives to use the best available data each year when determining current and historical household charges and trends. These data are intended for comparison purposes only, and are subject to change from one year to the next. While this document presents the most up-to-date data available, if better data become available in the future, the data presented here may be modified. Additional data and information on the NACWA Index, past years’ surveys, and regional summaries are available on NACWA’s website.

Table A-1: NACWA Service Charge Index, 1985 to 2025

Table A-2: Projected Annual Service Charge Increases, 2026-2030

Table A-3: Regional Annual Average Sewer Service Charges, 2025 Summary

Note 3: The percent change values in Table A-3 are based on the responses of those agencies that responded in both the previous year and current year using the same calculation method.

Turn static files into dynamic content formats.

Create a flipbook
2025 NACWA Cost of Clean Water Index by NACWA - Issuu