Walkability matters: Pedestrian-friendly cities – like Minneapolis-St. Paul – attract more businesses, renters and new development
By Dan Rafter, Editor
Minneapolis continues to rank as one of the most walkable cities in the United States. And that status is good news for multifamily developers, retailers and business owners who want to bring their workers back into the office.
Why? A growing number of people want to live in walkable cities. Building a multifamily development in a neighborhood in which people can walk to stores, restaurants, theaters and public transportation will attract a steadier stream of tenants. These renters need restaurants to eat at and stores to shop at. Retailers
that open in walkable neighborhoods, then, boost their chances at earning bigger profits.
And companies that lease office space in walkable neighborhoods? They might find it easier to entice workers to return to the office on a more frequent basis if they can offer their employees quick access to coffee shops, restaurants, clothing stores and public transit stops.
Boasting walkable neighborhoods, then? It’s a positive for cities like Minneapolis, and can help these urban hubs attract new apartment developments and
retailers while seeing the vacancy rates in their office properties start to tick down.
Yardi Matrix in early October released a study on the best walk-and-ride cities, urban hubs in which people can ditch their cars and walk or ride their bikes to public transit stops, restaurants, parks, theaters, grocery stores and other retailers. Minneapolis topped the list of the nation’s best walk-and-ride city.
This is partly because city officials have taken steps to make city streets safer and more inviting for peWalkability to page 24
Sales activity remains muted, vacancies tick up slightly in Minneapolis-St. Paul industrial market
By Dan Rafter, Editor
While the Minneapolis-St. Paul industrial market remains a strong one, the sector does face challenges, according to a third-quarter report from Transwestern.
In its third quarter Minneapolis-St. Paul Industrial Market report, Transwestern said that the vacancy rate for the Twin Cities area in the third quarter of 2025 stood at 5.4%. That’s a slight jump of 0.4 percentage
points from the previous quarter while remaining unchanged on a year-over-year basis.
What’s behind the slight bump in vacancy? Transwestern said that it was primarily driven by a net increase of 678,000 square feet of vacant space in warehouse/office properties in the Twin Cities market during the quarter.
In another key stat, Transwestern reported that net absorption totaled negative 354,237 square feet in the Twin Cities industrial market in the third quarter. Three major tenant move-outs contributed to 965,000 square feet of vacated space, including Sportsman’s Guide leaving behind 422,727 square feet at 411 Farwell Ave. in Saint Paul, Lumbermen’s Inc. vacating
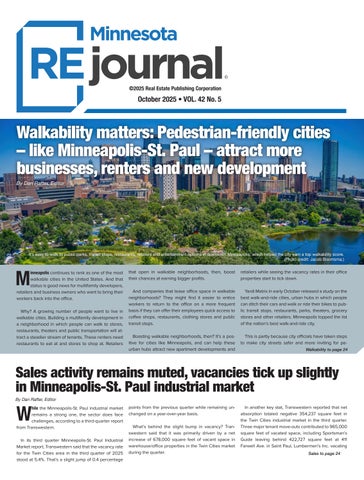
It’s easy to walk to public parks, transit stops, restaurants, retailers and entertainment options in downtown Minneapolis, which helped the city earn a top walkability score.
(Photo credit: Jacob Boomsma.)
The Vision To See Banking Differently
Discover Bridgewater Bank.
CONTENTS October 2025
1
1
4
Walkability matters: Pedestrian-friendly cities – like Minneapolis-St. Paul – attract more businesses, renters and new development:
Minneapolis continues to rank as one of the most walkable cities in the United States.
Sales activity remains muted, vacancies tick up slightly in Minneapolis-St. Paul industrial market:
While the Minneapolis-St. Paul industrial market remains a strong one, the sector does face challenges, according to a third-quarter report from Transwestern.
Consumers tightening shopping budgets but aren’t ready to give up on the holiday cheer:
Consumers across the United States are heading into the 2025 holiday season with a clear message: They’re still celebrating, but they’re spending smarter.
8
10
12
The key to bringing office workers back to Twin Cities’ businesses? Companies need the right hybrid model:
A new study says that employees have for the most part accepted back-to-the-office policies, especially hybrid schedules.
Solid growth still happening in luxury retail market:
Luxury retailers were riding high a year ago, having enjoyed several years of growth following the COVID-19 pandemic. Today?..
Sales volume, prices on the rise in single-tenant net-lease retail market:
The single-tenant net-lease retail market saw a busy first half of the year, with both sales volume and median sales prices on the rise, according to the latest research from Colliers.
6
No end to the high vacancy rates in Twin Cities office market:
The U.S. office sector remains in flux as companies continue to negotiate the work-from-home movement and implement
14
Practical tips for navigating 1031 exchanges:
Tax-deferred 1031 exchanges remain one of the most powerful strategies for real estate investors to preserve equity, reinvest gains, and build long-term wealth.
16
Turn land and buildings into “mailbox money”:
From an economic standpoint, agricultural or undeveloped land produces a small amount of cash flow, if any, as a percentage of the fair market value of the property.
President | Publisher Jeff Johnson jeff.johnson@rejournals.com
Managing Editor Dan Rafter drafter@rejournals.com
Senior Vice President Jay Kodytek jay.kodytek@rejournals.com
Art Director | Graphic Designer Alan Davis alan.davis@rejournals.com
Senior Graphic Designer Jordan Jensen jordan.jensen@rejournals.com
Managing Director National Events & Marketing
Kaitlyn LaCroix kaitlyn.lacroix@rejournals.com
7767 Elm Creek Boulevard, Suite 210 Maple Grove, MN 55369
Consumers tightening shopping budgets but
aren’t ready
to give up on the holiday cheer, JLL finds
By Dan Rafter, Editor
Consumers across the United States are heading into the 2025 holiday season with a clear message: They’re still celebrating, but they’re spending smarter.
According to JLL’s latest Holiday Shopping Survey Report, Americans are focusing on value, strategy, and purpose as they balance festive spirit with tighter financial realities.
JLL’s survey of 1,001 consumers found that shoppers are planning smaller budgets, shorter shopping trips, and more intentional purchases. The result? A holiday season that remains joyful, but also one where every dollar counts.
A 10% drop in holiday budgets
The research shows that the average American plans to spend $1,133 this holiday season, a 10.2% drop from last year’s $1,261, according to JLL. That decline signals a notable shift from holiday excess toward more deliberate spending.
But the national averages mask deep divisions. Shoppers earning more than $150,000 a year plan to spend 26% more—nearly $1,963—while lower-income households making under $50,000 are cutting back by 24%, to just $699. That widening gap paints a picture of a holiday season split between restraint and indulgence.
The power of time and experience
JLL’s data also highlight how longer store visits translate into higher spending. Shoppers who linger in stores for 90 minutes or more spend an average of $1,416, 79% more than those who stay under half an hour.
That finding underscores the importance of experience-driven retail. Retailers that create comfortable, engaging spaces will see the biggest rewards. The reason? When people spend more time in a store, they spend more money.
Prioritizing giving over self
Even as budgets tighten, the spirit of giving endures. About 25% of consumers say they’ll skip buying for themselves this year, up from 17% in 2024. Spending on gifts for others remains steady at about $580 per person, but self-gifting, especially on electronics, has dropped sharply, from 47.5% of consumers last year to just 32% this year.
Physical retail still matters
Despite the ongoing dominance of e-commerce, more than 83% of consumers will visit brick-and-mortar stores this holiday season. Only 16% plan to shop entirely online. Nearly three-quarters will mix physical and digital channels, reflecting a hybrid approach that blends convenience with in-person experiences.
Shoppers are especially drawn to value-oriented destinations. Mass merchandisers such as Walmart and Target are regaining their footing, attracting 62% of holiday shoppers, up from last year. Credit competitive prices and one-stop convenience. Department stores remain strong, appealing to about half of consumers, but they’re losing ground to the mass-market resurgence.
A culture of constant deals
The hunt for bargains is no longer a trend. It’s a mindset. About 71% of shoppers say low prices and sales are their top priorities, while 60% say they’ll chase more discounts than usual. Nearly half (46%) plan to take advantage of deal days like Black Friday and Cyber Monday, but an equal share of consumers say they’ll be searching for discounts all season long.
As JLL reports, the holiday shopping calendar has extended, with consumers looking for savings from November through to the New Year.
Food, social media and focused shopping
Shopping trips are increasingly doubling as dining experiences. More than 84% of consumers plan to eat or drink while shopping, whether grabbing coffee, a snack or a sitdown meal.
The connection between food and retail spending is clear: Shoppers who take breaks to dine or snack tend to stay longer in a store and spend more.
Social media also continue to shape how consumers discover and decide what to buy. About 79% of shoppers use platforms like TikTok, Instagram or Facebook for holiday inspiration. Gen Z leans heavily on TikTok, Millennials spread their attention across multiple platforms, and Baby Boomers stick mostly to Facebook and Instagram.
Meanwhile, efficiency is the new retail strategy. Nearly two-thirds of consumers plan to complete their holiday shopping in five stores or fewer, signaling a move toward concentrated, goal-oriented trips rather than the marathon shopping sprees of years past.
A season of selective celebration
JLL’s findings paint a portrait of a holiday season defined by both restraint and resilience. Shoppers are cutting back but not cutting out the holiday spirit. They’re combining digital inspiration with physical experiences, chasing deals while prioritizing meaning, and proving that celebration, even on a budget, remains a priority.
Photo credit: Drazen Zigic
No end to the high vacancy rates in Twin Cities office market
By Dan Rafter, Editor
The U.S. office sector remains in flux as companies continue to negotiate the work-from-home movement and implement hybrid schedules. And in the Twin Cities? The struggles continue for the Minneapolis-St. Paul office market, according to the latest research from Colliers.
In its third quarter 2025 report, Colliers said that the overall office vacancy rate in the Minneapolis-St. Paul market stood at 22.1% as of the end of the quarter of 2025. That’s nearly unchanged from the market’s vacancy rate of 22% in the third quarter of 2024.
What’s behind this high rate? The Twin Cities market is little different than markets in other cities across the country. With many employees still working remotely
at least two or three days a week, companies don’t need as much office space.
Many employers are choosing to rent more expensive office space but are renting less of it. The goal is to use this more attractive space to help convince their workers to return to the office more frequently.
This trend has led to higher office vacancy rates across the country. It’s also a trend that the Twin Cities region has not escaped.
And as in many cities, the Twin Cities’ urban cores are suffering the highest vacancy rates.
Colliers reported that the local office vacancy rate is highest in downtown Minneapolis and downtown St. Paul. Colliers said that the office vacancy rate stood
at 30.8% in downtown Minneapolis at the end of the third quarter of this year and at an even higher 39.5% in downtown St. Paul.
Not all office types are seeing the same struggles. With many employers embarking on the flight-to-quality – choosing higher-end office spaces to encourage employees to work onsite – Class-B and Class-C office properties are seeing lower occupancy levels.
According to Colliers’ report, Class-B office properties saw the highest vacancy rates among office classes in the Twin Cities market, with a vacancy rate of 25.9% market-wide and 37.5% in the downtown cores.
One number associated with the local office sector is rising, though. Colliers reported that the overall asking lease rate averaged $31.24 a square foot, with Class-A rates at $37.06 a square foot. The overall office asking lease rate in the Twin Cities market stood at a lower $29.42 a year ago.
In a hint of good news? The office vacancy rate might have stabilized for now, especially with not much new office construction taking place.
Colliers reported that 241,000 square feet of new office space was under construction as of the end of the third quarter in the Minneapolis-St. Paul market. That is up, though, from the end of the third quarter last year when only 35,700 square feet of new office construction was taking place.
An example of a big project rising in the Twin Cities market? Crews building The Arcadia project at Highway 100 and 50th Street recently broke ground on the site of a now demolished office building. This project will serve in part as the new headquarters for Opus.
BUILDINGS ARE COOL .
Image by Markus Spiske, Pixabay.
Survey: Most employees tend to approve of hybrid work. But it must be done right for true compliance
by Dan Rafter, Editor
Anew study says that employees have for the most part accepted back-to-the-office policies, especially hybrid schedules. That doesn’t mean, though, that all employees are complying when their companies mandate that they return to the office, whether that mandate is one to two days a week or four to five.
That’s one of the main takeaways from JLL’s Workforce Preference Barometer 2025, a report studying the state of the global workforce.
Another key finding? Most employees told JLL that they are more interested in maintaining a solid work-life balance than they are in a higher salary. This means flexibility: Workers want the flexibility to work remotely when it makes sense and to work non-traditional hours if it results in benefits such as a shorter commute to work.
Others who are caring for children or elderly parents want a schedule that allows them to tackle these caregiving duties even if they arise during normal working hours, as long as they can complete their duties during non-traditional working hours.
Researchers compiling this year’s JLL’s Workforce Preference Barometer surveyed 8,700 office workers in 31 countries. These respondents worked at companies that each employed more than 1,000 staffers in sectors including finance, technology, manufacturing and public services.
JLL’s survey found that 65% of respondents listed work-life balance as their top priority, ahead of salary. This is evidence of how important it is for companies to provide their workers with a work schedule that does give them the chance to spend time with their families or enjoy downtime away from the office.
“We have been publishing this barometer for several years, and the statistic that stood out to me this time was the importance that employees place on flexibility and work-life balance,” said Peter Miscovich, executive managing director, global future of work director for JLL. “What we are seeing is that with the accelerated pace of change, accelerated rate of tech adoption, the post-pandemic stressors in the marketplace and uncertainty about the economy, is that people are
really looking for greater time flexibility and work-life integration if not full balance.”
Miscovich said that survey respondents said that they want a greater level of autonomy when it comes to their work schedule. They want time to disconnect from their work.
“There is still that always-on workplace mentality that is prevalent today,” Miscovich said. “The high levels of stress and the burnout of multiple cohorts is pervasive. That finding in the barometer supports what we are seeing in the marketplace today. People are feeling stress. We will see if this changes, but it does seem to be part of our new normal.”
Some employers, though, are taking steps to improve the work-life balance of their workers.
Miscovich said that it is important for companies to consider the needs of different workers and to ask them what they need from their work schedules. As Miscovich says, the most successful hybrid work schedules consider input from employees on when they need and don’t need to be in the office.
A manager, for instance, might need to be in the office four days a week while a programmer might only need to be on-site one day a week. Maybe both types of employees need to be in the office when on-site meetings or brainstorming sessions are scheduled.
Other employees might be taking care of both young children and elderly parents. These workers might need to take time off during the day, something that employers can allow if these workers can complete their tasks during non-traditional hours.
Other employees might face long commute times if they must work a traditional 9-to-5 schedule. Companies might allow these workers to come into the office earlier and level earlier or get to their desks later in the day and work past 5 p.m.
“Employers should look at the individual cohorts within an organization and ask them what they need in terms of autonomy,” Miscovich said. “If the output is there and the company’s objectives are being met, providing this flexibility can be a win-win for everyone. We companies can execute this, that is where we see the greatest success.”
Accepting the hybrid model
The study reported that 66% of global office workers say that their company sets clear expectations for the number of days that they are expected to work onsite. The survey found, too, that 72% of respondents viewed these back-to-office policies positively.
Of those employees with this positive view, 50% said that being in the office at least on a hybrid basis supports better teamwork. A total of 43% of these respondents said that they prefer working in the office to working remotely and 35% said they view hybrid policies as being fairer to all employees.
Miscovich said that those in favor of hybrid policies said that they appreciate the chance to be both visible in an organization and the opportunity to work off-site.
“People are looking for workplace variety and balance,” Miscovich said. “Working seven days a week nonstop is not healthy. If you create the conditions that allow enough flexibility for workers, those are the work arrangements that earn the most positive acceptance.”
As Miscovich says, workers want a positive experience when they go to the office. They want to be able to use a conference room if they need one. They want the technology that makes it easier for them to complete their work. They want the opportunity to grab a quick cup of coffee if they need a break from work.
“They are looking for a higher-quality experience in the office,” Miscovich said. “If companies can provide that, it’s a nice win-win-win opportunity.”
The challenges
But what about those workers who don’t view their companies’ back-to-office policies favorably? JLL said that 40% of them said that they believe they will be less productive on the job if they are not able to choose their preferred work setting.
Those employees who don’t have a positive view of their companies’ hybrid policies told JLL that they are less concerned about having to return to the office than they are about a lack of company support that would otherwise make in-office work a comfortable and worthwhile experience.
Photo by fauxels.
Luxury retailers still seeing significant growth
By Dan Rafter, Editor
Luxury retailers were riding high a year ago, having enjoyed several years of growth following the COVID-19 pandemic. Today? New headwinds have hit this slice of the retail sector, most notably economic uncertainty and concerns over tariffs.
What do these challenges mean? That’s not yet determined. JLL in its U.S. luxury retail report, released earlier this week, said that while some luxury brands have reported falling revenues, economic concerns have not yet led to a significant decline in luxury store openings.
According to JLL’s report, luxury retailers are opening new locations at a faster pace than they did in the first half of 2024. In the first six months of this year, newly opened luxury square footage jumped by 65.1% when compared to the same period a year ago.
However, the last quarter of 2024 was even more active. JLL said that luxury openings in the fourth quarter of last year totaled 195,563 square feet, the highest quarterly total that JLL has ever recorded in the luxury retail market.
And so far this year? In the first quarter of 2025, retailers opened 146,888 square feet of new luxury retail space across the United States, JLL said. In the second quarter of this year, they opened 79,625 square feet of new luxury space. That’s a total of 226,513 square feet of new luxury openings in the first half of this year.
Challenges do loom, though. JLL reported that Capri Holdings anticipates an $85 million increase in cost of goods sold for fiscal year 2026 because of tariffs, while Tapestry’s Kate Space brand is impacted by the 20% Southeast Asian import tariffs, something that is prompting the retailer to reduce its handbag styles by 30%. The company is projecting a total $160 million tariff-related cost for fiscal year 2026.
At the same time, LVMH says that it is increasing local production in the United States by opening a second Louis Vuitton facility in Texas to reduce import costs.
Much of the strength of the luxury retail market today is fueled by the shopping habits of Gen Z and Millennials, according to JLL.
JLL reported that Tapestry’s Coach brand notched a 14% increase in sales during the fiscal fourth quarter of 2025 and a jump of 10% for the full year. Gen Z and Millennials make up 60% to 70% of the brand’s new North American customers, JLL says.
Prada Group’s Miu Miu saw its retail sales surge by 49% in the first half of 2025, with a sizable portion of
BUILDING A BETTER FUTURE, TOGETHER
As builders we are driven by a desire to make a positive difference in the communities where we work, live and play. We do this by investing in our employees’ development and growth, and by nurturing solid relationships with our clients, partners and each other.
Image by Pexels from Pixabay.
NORTH LOOP GREEN
Sales volume, prices on the rise in single-tenant netlease retail market
By Dan Rafter, Editor
The single-tenant net-lease retail market saw a busy first half of the year, with both sales volume and median sales prices on the rise, according to the latest research from Colliers.
In its 2025 first-half report, Colliers said that the U.S. single-tenant net-lease retail sector racked up $5.7 billion in sales volume in the first six months of the year. That is up 9.6% from the second half of 2024.
The median price per square foot of sold properties rose to $309, a jump of 8% from the end of 2024. Colliers said that the net-lease retail sector is seeing a shift toward smaller, more liquid formats, something that reflects changing consumer behavior and a more disciplined approach from investors.
The median cap rate for transactions in the first half of the year dropped to 6.8%, down 10 basis points from the second half of 2024.
Not all net-lease retail sectors are performing as strongly as others. But convenience stores remain an attractive asset type, recording sales volume of $796 million in the first half of 2025, up by nearly 16% from the second half of last year. The median sales price
rose to $925.
This doesn’t mean that the convenience store sector doesn’t face challenges. Colliers reported that economic uncertainty and rising prices have forced consumers to cut back on non-essential spending, causing a decline of 4.7% in average visits to U.S. convenience stores in the first half of 2025. Part of this is because U.S. consumers when traveling are opting for shorter, regional “microcations” over long-distance trips, according to Colliers.
Drug stores face challenges, too, with Colliers reporting that the average number of consumer visits to drug stores and pharmacies declined by 3.6% during the first half of 2025. Sales volume in this sector dropped, too, falling to $444 million in the first six months of this year, while the median sales price for drug stores and pharmacies dropped to $257 a square foot.
And what about dollar stores and discount retailers? This sector notched a sales volume of $527 million in the first half of the year and a median sales price of $166 a square foot.
Colliers said that discount and dollar stores saw an increase of 2.9% in foot traffic during the first half of 2025. However, the future is uncertain as these retailers brace for the impact of tariffs as they rely so heavily on low-cost imported goods.
Full-service restaurants racked up $1.07 billion in sales volume during the first half of 2025, with these properties selling for an average of $469 a square foot during this time.
Colliers, though, reported that full-service restaurant visits declined by 1.6% in the first six months of the year. Colliers pointed to economic uncertainty and several years of menu price increases as the reason for this dip.
Colliers reported that quick-service restaurants saw $1.01 billion in sales volume in the first half of 2025, with properties selling for an average of $751 a square foot. However, visits to quick-service restaurants dropped slightly, by 0.6%, in the first half of 2025. Colliers cited a reduction in commuters and fewer long-distance trips leading to a decrease in on-the-go food purchases.
per square foot for convenience store transactions
Image by Igor Ovsyannykov from Pixabay.
One Partner. Every Stage.
In both established HOAs and new developments under construction, Sharper delivers experience, technology and people-first service that keeps communities running strong now and into the future.
Serving Established Communities
With more than 20-years of industry experience, we serve HOAs of every size, type and scope to help the Board and residents enjoy a well-run community
Transparent, Timely & Accurate Financial Management
Proactive Community Communication
Maintenance Coordination & Project Oversight
Technology (resident webportal) That is Secure & Robust
Reliable Response Available 24/7
Your community deserves a partner who understands the importance of structure, transparency, and long-term success
Partnering with Developers & Builders
From the blueprint to the Declarant turnover, Sharper is the trusted partner along the way to establish thriving CICs throughout the Twin Cities We work side-by-side with Developers and Builders to help realize the dream from dirt to established HOA
Budget creation and reserve planning tailored for new HOAs
Governance setup and legal documentation assistance
Homeowner transition planning and welcome materials
Professional guidance from project start to community turnover
A smooth, stress-free handover from builder to board
Sharper takes care of the details so you can focus on building
Practical tips for navigating 1031 exchanges
By Jeff Peterson, Commercial Partners Exchange Company, LLC
Tax-deferred 1031 exchanges remain one of the most powerful strategies for real estate investors to preserve equity, reinvest gains, and build longterm wealth. Given both federal and state tax rates, the incentive to defer capital gains through a properly structured exchange has never been stronger.
Since the Tax Cuts and Jobs Act of 2017, 1031 exchanges are limited to real property held for investment or use in a trade or business. That means the strategy no longer applies to personal property such as equipment, aircraft, or livestock but remains highly effective for real estate investors seeking to expand their portfolios while managing tax exposure.
Here are a few practical tips to help your clients maximize the benefits of a 1031 exchange.
Don’t Touch the Money
One of the most important principles of a valid exchange is that the seller must not take possession or control of the proceeds from the sale of the relinquished property. If your client, even momentarily receives the funds, the transaction becomes a taxable sale.
To stay compliant, a Qualified Intermediary (QI) should be engaged prior to closing. The QI holds the proceeds and facilitates the exchange under strict IRS rules (specifically, the G(6) limitations), which prevent the taxpayer from accessing, pledging, or otherwise benefiting from the funds during the exchange period.
Put simply: once the sale closes, the proceeds must go straight into the QI’s hands, never the taxpayer’s hands.
Use a Qualified Intermediary (QI)
A QI is a neutral third party responsible for safeguarding the sales proceeds and using them to acquire the replacement property. The taxpayer conducting the 1031 exchange must:
• Identify potential replacement properties within 45 days of the sale, and make sure they have this in writing.
• Acquire one or several of the properties they identified within 180 days.
Both timelines (45-day and 180-day) will begin the day after the closing of the relinquished property. Missing either deadline may disqualify the exchange and may result in a taxable event.
Understand the Replacement Property Rules
When identifying replacement property, taxpayers can choose from several options:
• Three Property Rule: Identify up to three potential properties, regardless of the value of each property.
• 200% Rule: Identify more than three properties as long as their total fair market value (FMV) does not exceed 200% of the value of the relinquished property.
• 95% Exception: Identify any number of replacement properties if the FMV of the properties received by the end of the exchange period is at least 95% of the aggregate FMV of all the potential replacement properties that were identified. This means that when using this rule, 95% (or all) of the identified properties
must be purchased, or the entire exchange becomes invalid.
Careful documentation and timely identification are essential. There’s no grace period for errors or omissions.
Be Cautious with Seller Financing
A core requirement of a 1031 exchange is that the seller reinvest both the net proceeds and equity from the sale into like-kind property. Offering seller financing, such as accepting a promissory note in lieu of cash, can reduce the amount of money available to reinvest, creating taxable “boot.”
If seller financing is necessary, one workaround is for your client to provide a separate, personal loan to the buyer, rather than using exchange proceeds. This can preserve the full amount of proceeds for reinvestment and may avoid unintended tax consequences.
Defer . . . Defer . . . Defer . . . then Die
Many investors build their real estate portfolios using a “laddered” 1031 strategy: start with a small rental property, exchange into a duplex, then a fourplex, and eventually into commercial or multifamily properties, deferring gains each time.
So, what happens to all that deferred gain when the investor dies?
Thanks to IRC §1014, heirs receive a step-up in basis to the FMV at the date of death. This means the accumulated deferred gains may be permanently eliminated when the property is inherited and no capital gains tax owed. It’s a compelling strategy for wealth preservation.
Image by Alexander Stein from Pixabay.
The Club at Golden Valley
7:30am Breakfast & Networking
8:00am - 12:00pm
Speakers:
Andrew Twito
Ryan Companies
Blake Nelson
Hellmuth & Johnson
Dan Weery
Legacy Private Wealth
Dennis Monroe
Monroe Moxness Berg
Erik Johnson
Venture Commercial
Harrison Wagenseil
CBRE
Jeffrey Peterson
CPEC1031 LLC
Josh Wilcox
Enclave Companies
Kyle Willems
Bassford Remele
Lee Anderson
UMB Bank
Marcus Urlaub
Monroe Moxness Berg
Monte Hilleman
Sustainable Inventment Group
Patrica Weller
Monroe Moxness Berg
Peter Mork
Capital Partners
Rafi Golberstein
PACE Loan Group
Sam Eaton
Timberland Partners
Sara Ausman
UMB Bank
Steve Ruda
Mariner
Thomas Rishovd
Morgan Stanley
Todd Phillips
Legacy Property Trust
Tyler Kollodge
Schafer Richardson
Wilson Molitor
Walker & Dunlop
Turn land and buildings into “mailbox money”
by Greg Lehrmann, Excel 1031 Exchange
From an economic standpoint, agricultural or undeveloped land produces a small amount of cash flow, if any, as a percentage of the fair market value of the property.
Rental property produces more income, but along with this cash comes toilets, trash, tax, tenants and trouble.
In a 1031 exchange under the Internal Revenue Code, a taxpayer who has held real property for productive use in a trade or business or for investment can exchange that real property for any other “likekind” real property. Exchanges have been a part of the tax code since 1921 and represent one or the most effective strategies available to landowners to defer capital gain taxes.
A misconception concerns the types of property that qualify as “like-kind.” Some mistakenly believe they must exchange apartments for apartments. Not true. The definition of like-kind property is very broad; qualifying replacement real property can be virtually any real property that will be held by the taxpayer for investment purposes or used in a trade or business. Office buildings, retail centers, apartment buildings and other rentals can be exchanged for less management-intensive properties.
Choosing the Right Investment
1. NNN Properties: A triple-net-lease property is real estate that is leased to a tenant who is responsible for the ongoing expenses of the property, including real estate taxes, building insurance and maintenance, in addition to paying the rent and utilities.
2. Delaware Statutory Trusts: An ownership interest in a Delaware Statutory Trust (DSD is an indirect way of owning investment real estate. This can be appealing to taxpayers who are interested in acquiring a managed real estate investment. The trustee of the DST initially purchases the property and holds title to the property. A sponsor structures the investment and arranges for the issuance of beneficial interests in the DST. Although interests in the DST are treated as securities under federal securities laws, they are treated as ownership of real estate and thus like-kind pursuant to §1031.
3. Royalties: Mineral rights and royalties have been handed down through generations. Families have been receiving royalties from oil and gas for over 100 years. Until recently, they were only resold to institutions, large endowment funds, and ultra-high net families. Increasingly, ranch sellers are able to purchase producing royalties with investments of as little as $100,000 (just as DSTs) and then experience the cash flow generated by such royalties.
Takeaway
Many property owners are extremely surprised and happy to learn about the opportunity to move from low-performing land or high-maintenance buildings to passive, income-producing properties in a tax-deferred manner. We invite you to contact us at 9407345-3145 for more information.
About Us
Greg Lehrmann is the founding member of Excel 1031 Exchange with 42 years of experience in commercial and residential real estate law. For the past three decades he has dedicated his career to 1031 exchange work and has handled tens of thousands of exchanges throughout the country.
Lehrmann is a distinguished attorney double board certified in commercial and residential real estate law by the Texas Board of Legal Specialization. Only 2% of attorneys in Texas meet this exacting standard. He has a B.BA with honors in accounting from The University of Texas and a J.D. from The University of Texas School of Law.
Lehrmann and his wife, Texas Supreme Court Senior Justice Debra Lehrmann, have two sons, Gregory and Jonathan, practicing attorneys, and three beautiful grandchildren.
Photo courtesy of iStock.
Speakers:
Bill Katter
Hempal Companies
Billy Mork
CBRE
Chris Eng
Washington County CDA
Deanna Kuennen
City of Farmington
Eric Van Oss
City of Rosemount
Greg Kruschke
City of Owatonna
Gregory Frahm-Gilles
Anoka County Regional
Economic Development
Jake Kelly
Cushman & Wakefield
Jason Folger
Gardner Builders
Jeff Salzbrun
Commercial Equities Group
Jeremy Thomas
RJ Ryan
Jim Vos
Savills
Joe Mahoney
Opus Development Company
Judd Weliver CBRE
Kristine Williams
Saint Paul Port Authority
Leslie McGillivray-Rivas
City of Faribault
Mark Anderson
Sambatek
Mark Kolsrud Colliers
Mark Nordland
Likewise Partners
Matt Newell Colliers
Nancy Hoffman
Chisago County HRA-EDA
Peter Mork
Capital Partners
Ross Briggs
Bridgewater Bank
Tim Elam
Scannell Properties
Tina Goodroad
City of Lakeville
Tom Bennett CBRE
The JLL survey found that 55% of respondents who had have negative views on hybrid policies are concerned about their quality of life. A total of 42% said they had feelings of being stuck in their job and 41% said that they felt let down by their companies’ return-to-office plans.
Not all workers follow their companies’ hybrid plans, of course. JLL found that compliance ranges from 74% in the United States to 85% in Europe, with compliance rates above 90% in Italy and France.
Consider companies that mandate that employees work one to two days in the office every week. JLL found that 68% of respondents at such companies did work the required one to two days. A total of 19% routinely worked three to four days in the office and 7% regularly worked all five weekdays in the office. However, 5% of respondents continued to work fully remote despite their companies’ back-to-office mandates.
For companies that mandated employees to work three to four days a week in the office, JLL found that 70% of survey respondents did follow that mandate. A total of 12% worked full-time in the office. But JLL found that 17% routinely worked only one to two days in the office while 1% remained fully remote.
And for respondents whose employers have mandated that they work full-time in the office? According to the study, 82% of these respondents said that they followed this mandate. A total of 10% of respondents said that they routinely worked three to four days in the office, 5% said that they routinely worked one to
two days in the office and 2% said that they remained fully remote.
In its study, JLL said that companies can take steps to increase in-office compliance from workers. Companies should personalize the work experience, recognizing that older employees with more experience might not need to come into the office as frequently as their younger peers. Some employees, depending on the work that they do, can perform more of their tasks remotely.
JLL said that companies should reserve much of employees’ in-office time for tasks such as meetings, brainstorming sessions and other work that can only be done on-site.
Also important? Taking a more holistic approach to creating an inviting workspace. This means not only providing an office space with amenities such as onsite fitness centers, healthy food options and quiet spaces for creative work, but also providing employees with the option to work non-traditional hours, take time off to care for children or elderly parents or even take a mental break if they face possible burnout.
Employees with a positive view of their work schedules tend to work in environments in which the business’ needs are balanced with employee wellbeing.
A total of 50% of employees who are in favor of their companies’ hybrid policies say that being in the office at least part time supports better teamwork. A total of 71% of survey respondents who viewed their companies’ hybrid policies favorably said that their companies are a great place to work.
Miscovich said that companies that want to persuade their employees to come into the office a greater number of days need to provide an office space that is enticing.
“If employers want to be competitive in attracting great talent, and they want that talent to come into the office three days a week, they need a great workplace environment,” Miscovich said. “Employees are looking for that high-quality building, that high-quality workplace design. They want a building with sustainable practices and energy management. This trend will continue.”
Peter Miscovich (Photo courtesy of JLL.)
The Club at Golden Valley
7:30am Breakfast & Networking
8:00am - 12:00pm Program
Speakers:
Alex Jadin
Smith Jaden Johnson PLLC
Allison Larson
Guild Home Mortgage
Brenda Sauro
Hellmuth & Johnson
Chad Kestner
Apple Roofing
David Arbit
Minnesota Realtors
Derek Muelken
PCS Residential
Eric Skarnes
Insurance Warehouse
Finn Jacobson SJJ Law
Grant Herschberger
Marsh McLennan Agency
Jake Christenson RowCal
Jim Pierce Gavnat
Joe Grunnet DRG
Josh Reams
Sharper Management
Lynn Boergerhoff
HOA Leadership Network
Mark Foster
HOA Leadership Network, LLC
Matt McNeill
Cities Management
Phaedra Howard Hellmuth & Johnson
Shaun Zavadky
FirstServe Residential
Tim Broms
Community Associate Institute
Zach Olson
Zach Olson Group DRG
Sponsors:
However, while capital gains may be avoided, estate taxes still apply for high-net-worth individuals. Life insurance is often a smart planning tool to provide estate liquidity and avoid forced sales of real estate during periods of market downturn. Life insurance death benefits are generally income tax–free under IRC §101, making them another efficient complement to 1031 strategies.
Planning Ahead with Partnerships: “Drop ‘n Swap” Strategies
IRC §1031 generally excludes partnership interests from eligibility for exchange. Many investors hold real estate in LLCs or partnerships, which can complicate matters, especially if different partners have different tax goals.
Early planning can help avoid conflict and maximize tax efficiency.
Option 1: Full Drop to Tenancy-In-Common (TIC)
Before a sale, deed the property from the partnership to individual partners as TIC owners. This gives each partner direct ownership and the ability to pursue their own exchange. It may be important to allow enough time between the “drop” and the sale to establish valid investment intent and meet holding requirements, depending on the state in which your
relinquished property is located. For example, a recent decision from the New York Division of Tax Appeals offered a favorable opinion for 1031 exchange with a no holding period NY Drop and Swap. (DETERMINATION DTA NOS. 850122 AND 850123) This means no holding period was necessary to comply with the investment intent requirement under 1031.
Check with lenders beforehand to avoid violating due-on-sale clauses. And you may need to update your insurance certificate to ensure all TIC owners are listed as additional insured parties.
Option 2: Partial Drop for Diverging Goals
If only some partners wish to cash out while others want to exchange, redeem the non-exchanging partners’ interests. They become TIC co-owners with the remaining partnership, receiving their share of proceeds (and recognizing gain), while the partnership continues with a 1031 exchange. Each TIC owner should get a separate 1099-S upon the sale closing for their proportionate share of the proceeds. The optics look best when the sale contract is entered into by all TIC owners as co-sellers.
Final Thoughts
The benefits of a 1031 exchange are significant, but the rules are strict. The key to success is advance
U G 2 W E L C O M E S
J A S O N B E R G D A H L
Senior Vice President, Midwest Operations
planning. Identify potential exchange opportunities early, structure ownership accordingly, and educate clients about timelines and requirements.
1031 exchanges aren’t one-size-fits-all. With the right guidance, they become a powerful tool for wealth preservation and tax efficiency.
Jeff Peterson is a Minnesota attorney and former adjunct professor of tax law. He serves as President of Commercial Partners Exchange Company, LLC, where he facilitates forward, reverse, and build-to-suit 1031 exchanges nationwide. Jeff regularly collaborates with attorneys, accountants, and real estate professionals on exchange strategies. Reach him at 612-643-1031 or JeffP@CPEC1031.com or on the web at www.cpec1031. com.
Jason is a seasoned facility services executive with deep industry expertise in client engagement and operational excellence. “We could not be more excited to have Jason on board,” said UG2 COO John Correia “He knows the industry, he knows the region, and he is the ideal leader for this moment, as UG2 expands our footprint and deepens our relationships across the Midwest ”
Based in the company’s new regional office in Minneapolis, Jason will oversee operations within UG2’s Midwest Region. He will support business development activities and expand UG2’s impact through vital, lasting customer partnerships
December 5, 2025
The Club at Golden Valley
7:30am Breakfast & Networking
8:00am - 12:00pm Program
Speakers:
Alysen Nesse
Momentum Advocacy
Andrea Inouye
Family Housing Fund
Andrew Babula
University of St. Thomas
Anne Star Mavity MHP
Bernadette Hornig
Hornig Companies
Cecil Smith
Minnesota Multi Housing Association
Dan Kitzberger
Minnesota Housing
Emily Chad
Husch Blackwell
Jeff Budish
Northmarq
Jim Schloemer
Kaas Wilson Architects
John Errigo
Greater Minnesota Housing Fund
Jonathan Sage-Martinson Local Initiatives Support Corporation Twin Cities
Juan Torres Aeon
Kelly Lae MCCD
Louise Zwojski
Landon Group
Marsha Goff
Merchants Capital
Melissa Taphorn
Washington County CDA
Monte Hilleman
Sustainable Investment Group
Paul Connolly
R4 Capital LLC
Peter Mathison
National Equity Fund
Steve Minn
Lupe Development Partners
Thomas Furman
City of Faribault
Tyler Manning
Bridgewater Bank
Sponsors:
jay.kodytek@rejournals.com 612-940-3713
Walkability
from page 1
destrians and cyclists, including lower the speed limits on most residential roads to 20 miles an hour. Yardi Matrix points to this a change that not only boosts safety but also discourages unnecessary car trips.
Minneapolis is especially strong for cyclists, achieving the highest bike score among large U.S. cities from Yardi Matrix. Minneapolis notched an impressive score of 83 out of 100, thanks to its nearly 100 miles of dedicated bike and another 100 miles of off-street bikeways and trails.
Yardi Matrix points, too, to Minneapolis’ open-streets experiment that the city launched during the COVID pandemic, when it closed more than 18 miles of roads to car traffic. That ranked as the second-largest such initiative across the globe.
Yardi Matrix says that this effort has inspired longterm planning aimed at cutting car dependency even further.
Doug Ressler, manager of business intelligence for Yardi Matrix, said that Minneapolis’ focus on walkability is a smart move. Walkable cities are in demand from potential residents and businesses. The more walkable a city is? The more likely it is that its apartment buildings and storefronts are filled.
“People are increasingly seeking out walkable communities when choosing where to live, and this trend spans across generations and demographics,” Ressler said.
He cited statistics from the National Association of REALTORS(R) showing that 85% of Americans say sidewalks and places to walk are “very/somewhat” important when choosing a community. The association says, too, that 79% of Americans say that living within an easy walk of shops and parks is important.
Another interesting stat? A total 78% of Americans told the REALTORS(R) association that they are willing to pay more to live in a walkable community. And 53% say that they would prefer an attached dwelling -- such as a condo or townhouse -- over a detached home if it meant walkability and a short commute.
Other positives that boost Minneapolis’ walkability?
More than 92% of city streets have sidewalks on both sides, totaling nearly 1,800 miles of pedestrian pathways. Neighborhoods such as Whittier, Loring Park, North Loop, Uptown and Northeast Minneapolis are highly walkable. Residents and visitors here can easily walk to parks, cafes, transit stops and cultural venues.
“Walkable communities are now a major focus in urban development and real estate marketing,” Ressler said. “Cities are shifting toward mixed-use developments that prioritize pedestrian access to amenities like parks, shops and transit.”\
Ressler said that it’s easier for owners to fill their multifamily buildings if these properties sit in walk-
able neighborhoods. Renters living in walkable and bikeable communities also tend to report higher satisfaction with their living arrangements, something that boosts retention and reduces apartment vacancy rates.
Proof of this? CBRE in a summer 2024 report found that inner-ring walkable submarkets led apartment rent growth nationally.
Minneapolis has focused its efforts on pedestrian-friendly projects, too, including the reopening of the Plymouth Avenue Bridge with a new trail underpass
connecting Boom Island and Graco Park. Construction crews are installing ADA-compliant curb ramps and accessible pedestrian signals citywide, while Safe Routes to School projects are currently ongoing.
St. Paul is no slouch, either, when it comes to walkability and bicycling infrastructure. Yardi Matrix ranked St. Paul fifth nationally when it comes to walk-and-ride strength. St. Paul’s focus on pedestrian and cycling safety helped propel it up the rankings. Yardi Matrix says that there are only 0.66 fatalities of pedestrians
Walkability to page 24
2025 Minnesota 21st Annual Summit OFFICE
December 12, 2025
The Club at Golden Valley
7:30am Breakfast & Networking
8:00am - 12:00pm Program
Speakers:
Avery Ticer
Cushman & Wakefield
Brian Wessels
Intent Built
Chad Tepley
CDT Realty
Christoper Stockness
Shenehon
David Anderson
Frauenshuh
Emily Marden BDH
Jim Montez
Transwestern
Joe Conzemius CBRE
Jordan Einck
Gardner Builder
Marc Nanne JLL
Matthew Angleson
Suntide Commercial Realty, Inc.
Mel Schultz
NAI Legacy
Mike Doyle
Kenwood Commercial
Rich Reynolds
Area Commercial
Russ Nelson NTH
Scott Hierlinger Nelson
Steven Herron Zeller
Tracy Jordre
612-819-0385
Sponsors:
JLG Architects Jay Kodytek jay.kodytek@rejournals.com 612-940-3713
Walkability
from page 24
and cyclists per 100,000 residents compared to 2.12 in Minneapolis.
St. Paul is now working closely with Minneapolis and other regional partners on the Rethinking I-94 project, which could replace an aging highway that divides the Twin Cities with a boulevard and new land bridges, reconnecting neighborhoods with walkable spaces, something that would only enhance walking and cycling opportunities in the Twin Cities.
Of course, the Twin Cities do face some challenges when it comes to walkability and cycling. Most notably? The harsh winters. It can be difficult for pedestrians
Sales
from page 1
and cyclists during the sometimes brutal Minneapolis-St. Paul winters.
Yardi Matrix also says that some pedestrian projects have been criticized or opposed by Minneapolis’ Pedestrian Advisory Committee for not going far enough to improve safety. The decline of downtown Minneapolis following COVID has been a concern, too. The increased vacancies and safety concerns downtown discourages people from walking its streets.
Then there are the effects of past planning efforts. As Ressler says, planners in the Twin Cities area didn’t always focus on walkability.
“The Twin Cities have historically developed around car-centric planning, leading to sprawling suburbs and
disconnected residential areas,” Ressler said. “This makes it difficult for residents, especially those without cars, to access daily needs like groceries, schools and transit.”
Ressler said that Twin Cities officials can take several steps to boost the area’s walkability even further. This includes adding or repairing sidewalks in underserved neighborhoods, including buffer zones like trees or grass strips between sidewalks and traffic and updating zoning laws to allow for mixed-use buildings that combine housing, retail and services.
Ressler also says that Twin Cities officials should promote 15-minute neighborhoods in which daily needs are within walking distance and incentive developers to build near transit and existing walkable corridors.
177,935 square feet at Cottage Grove Logistics Park and Hunt Electric leaving behind 160,710 square feet at 7900 Chicago Ave. S in Bloomington.
Transwestern reported, too, that asking rents rose 0.7% during the third quarter, reaching $9.96 a square foot. On a year-over-year basis, local industrial rents remained mostly unchanged, increasing by a small 0.1%, according to Transwestern.
Will the region see much new construction? It looks like it. Transwestern reported that the Twin Cities’ in-
dustrial development pipeline reached 7 million square feet under construction in the third quarter, more than doubling the volume from the previous quarter.
A key contributor was Amazon, which began construction on a 3.6-million-square-foot distribution center on a portion of the former Thomson Reuters campus at 701 Opperman Drive in Eagan, Minnesota.
What hasn’t changed is that sales activity remains muted. Transwestern reported that industrial sales volume in the Minneapolis-St. Paul market in the third
quarter totaled $272.6 million, down 44% from $487.6 million in the same quarter last year.
This doesn’t mean that there weren’t big industrial deals here. That includes Hyde Development’s $57 million acquisition of the Minneapolis Southeast Core Logistics portfolio, a portfolio made up of 8210–2360 Courthouse Blvd. in Inver Grove Heights and 2999 Ames Crossing Road in Eagan. Hyde purchased the portfolio from United Properties.
Photo by ELEVATE.
APARTMENT
January 8, 2026
DoubleTree by Hilton, Bloomington
7:30am Breakfast & Networking
8:00am - 1:00pm Program
Speakers:
Abe Roberts
Marcus & Millichap
Angie French
Mid Continent Management Corporation
Brady Olson
Roers Companies
Clint Blaiser
Halverson and Blaiser Group Ltd.
Erin Young
Kaas Wilson Architects
Evan Doran
The Doran Group
Heidi Addo
Michel Commercial Real Estate
Jeff Anneke
DBS Group
Jessica Huebner
Kleinman Realty Co.
John Rent
Associated Bank
Joyce Stupnik
BDH
Keith Collins
CBRE
Matt Fransen
Timberland Partners
Matt Hozza
Kleinman Realty Co.
Ted Bickel
Northmarq
Todd Dexheimer
Sponsors:
Endurus Capital Jay
612-819-0385
1 Hour North of Minneapolis/St. Paul
Top Mississippi River Corridor Metro - site selection magazine
Named one of the “Fastest Growing US Cities” - nerdwallet
Best Place for Business and Careers #24 - forbes . com
Most Livable City 2007 & 2019 - livcomawards . org
Most
Access
Best City for Young Entrepreneurs #28 - nerdwallet