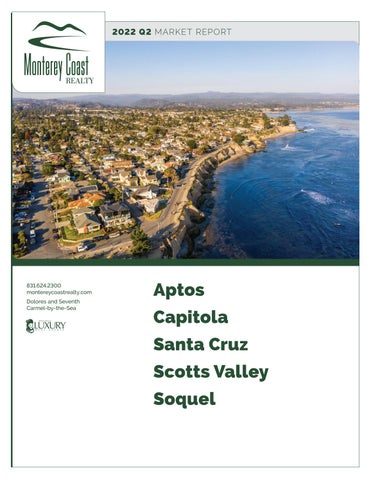
2022 Q2 MARKET REPORT
831.624.2300 montereycoastrealty.com Dolores and Seventh Carmel-by-the-Sea
Aptos Capitola Santa Cruz Scotts Valley Soquel
831.624.2300 montereycoastrealty.com Dolores and Seventh Carmel-by-the-Sea
A P T O S M A R K E T U P D AT E
YTD SALES BY SEGMENT
A
ptos was a standout market for this quarter as it continued to show substantial average price increases of 10% from Q1 2022 and 33% from Q2 2021. These numbers were bolstered by a higher concentration of sales in the $3+ million range and a single $10 million sale. Despite not reaching the heights of last summer in unit sales, 81 is still a respectable number for the market, and paired with the increased sales price we see an increase in sales volume by 18% when compared to last year. While days on market remain low at just 16 days, we are starting to see inventory build to a still limited 2.1 months of inventory.
$2,051,794
60% 13%
3.1%
21% <$1M | 17 $1M-2M | 76 $2M-3M | 27 $3M-5M | 3 $5M+ | 4
AV E R AG E S E L L I N G P R I C E
10% vs Q1 2022 33% vs Q2 2021
$166.2M
81
16
SALES VOLUME
UNITS SOLD
D AY S O N M A R K E T
97% vs Q1 2022 18% vs Q2 2021 2
2%
80% vs Q1 2022 11% vs Q2 2021
11% vs Q1 2022 23% vs Q2 2021
2022 Q2 MARKET REPORT
Aptos Average vs Median Sales
Days on Market 30
$2.1M
22.5
$1.82M
15
$1.53M 7.5
Q2 2021
Q3 2021
Q4 2021
Q1 2022
Q2 2022
Q2 2021
Q3 2021
Q4 2021
Q1 2022
Average
Months of Available Inventory 3
Closed Sales by Quarter
Q2 2022
Median
Closed Sales Volume by Quarter $170M
100
80 2.25
$128M
60 1.5
$85M 40
0.75
$43M 20
Q1
Q2
2021
Q3
Q4
2022
Q1
Q2
2021
Q3
Q4
2022
Q1
Q2
2021
Q3
2022
Q4
3
831.624.2300 montereycoastrealty.com Dolores and Seventh Carmel-by-the-Sea
C A P I T O L A M A R K E T U P D AT E
YTD SALES BY SEGMENT
T
he Capitola market has remained stable through the last year and is one of the few where we saw the average price dip, down just 2% from Q2 2021. Unit sales have also fallen off quite substantially, down 18% from last quarter and 53% from Q2 2022. Despite being one of the smaller markets normally, these limited sales show just how restricted this market has become in terms of turnover. The substantial increases in days on market versus previous quarters comes down to one outstanding property which was active for 89 days. Months of inventory has increased above levels seen in the previous 3 quarters to 1.8.
$1,885,556
5% 5%
20% <$1M | 1 $1M-2M | 14 $2M-3M | 4 $3M-5M | 1 $5M+ | 0
AV E R AG E S E L L I N G P R I C E
.5% vs Q1 2022 2% vs Q2 2021
$16.97M
9
39
SALES VOLUME
UNITS SOLD
D AY S O N M A R K E T
18% vs Q1 2022 54% vs Q2 2021 4
70%
18% vs Q1 2022 53% vs Q2 2021
333% vs Q1 2022 255% vs Q2 2021
2022 Q2 MARKET REPORT
Capitola Days on Market
Average vs Median Sales
40
$2M
30 $1.75M
20
$1.5M
10
Q2 2021
Q3 2021
Q4 2021
Q1 2022
Q2 2021
Q2 2022
Q3 2021
Q4 2021
Average
Months of Available Inventory 2.8
Closed Sales by Quarter 30
Q1 2022
Q2 2022
Median
Closed Sales Volume by Quarter $40M
2.1
$30M 20
1.4
$20M
10 0.7
$10M
Q1
Q2
2021
Q3
Q4
2022
Q1
Q2
2021
Q3
Q4
2022
Q1
Q2
2021
Q3
2022
Q4
5
831.624.2300 montereycoastrealty.com Dolores and Seventh Carmel-by-the-Sea
S A N TA C R U Z M A R K E T U P D AT E
YTD SALES BY SEGMENT
A
fter reaching a peak in average sale price over the last year in Q1 we saw a slight drop of 7% for Q2, though this number is still up 8% from Q2 2021. As expected, the unit sales increased from a normally slower Q1, but were 23% lower than Q2 2021. When these limited sales numbers are compared to an increasingly shorter days on market of 13 days you see that this market continues to be limited by low inventory. The good news here is that months of inventory has increased to 2.2 months at the end of the quarter, a number significantly higher than anything seen since the beginning of 2021, though this number is still a few months short of achieving a “normal” market.
$1,775,959
0.8%
AV E R AG E S E L L I N G P R I C E
7% vs Q1 2022 8% vs Q2 2021
13% 8%
12% <$1M | 30 $1M-2M | 161 $2M-3M | 28 $3M-5M | 18 $5M+ | 2
$248.6M
140
13
SALES VOLUME
UNITS SOLD
D AY S O N M A R K E T
33% vs Q1 2022 17% vs Q2 2021 6
67%
43% vs Q1 2022 23% vs Q2 2021
41% vs Q1 2022 7% vs Q2 2021
2022 Q2 MARKET REPORT
Santa Cruz Average vs Median Sales
Days on Market
$2M
26
20.8
$1.57M 15.6
10.4
$1.13M 5.2
Q2 2021
Q3 2021
Q4 2021
Q1 2022
Q2 2022
Q2 2022
Q3 2022
Q4 2022
Q1 2022
Average
Months of Available Inventory 2.2
Closed Sales by Quarter 190
Q2 2022
Median
Closed Sales Volume by Quarter $320M
1.65
$240M 127
1.1
$160M
63 0.55
$80M
Q1
Q2
2021
Q3
Q4
2022
Q1
Q2
2021
Q3
Q4
2022
Q1
Q2
2021
Q3
2022
Q4
7
831.624.2300 montereycoastrealty.com Dolores and Seventh Carmel-by-the-Sea
S C O T T S VA L L E Y M A R K E T U P D AT E
YTD SALES BY SEGMENT
I
n Scotts Valley we saw the average sale price drop off 4% from Q1, which was a skewed quarter due to very few unit sales, though we still see an increase of 10% from Q2 2021. Units sold increased dramatically from the unusually low Q1, but could not reach the heights of Q2 2021 as we saw a reduction of 19%. Days on market remain low at just 14 days, which is right in the middle of the variations we have seen over the last year. Months of inventory sustained Q1 levels at 1.9 months showing that buyer demand is no longer diminishing the inventory as soon as it becomes available as we have seen for the last few years.
$1,645,941 AV E R AG E S E L L I N G P R I C E
10% 10% <$1M | 6 $1M-2M | 47 $2M-3M | 6 $3M-5M | 0 $5M+ | 0
4% vs Q1 2022 10% vs Q2 2021
$69.1M
42
14
SALES VOLUME
UNITS SOLD
D AY S O N M A R K E T
152% vs Q1 2022 11% vs Q2 2021 8
80%
163% vs Q1 2022 19% vs Q2 2021
27% vs Q1 2022 18% vs Q2 2021
2022 Q2 MARKET REPORT
Scotts Valley Days on Market
Average vs Median Sales
19
$1.8M
15.2
$1.43M 11.4
7.6
$1.07M 3.8
Q2 2021
Q3 2021
Q4 2021
Q1 2022
Q2 2022
Q2 2021
Q3 2021
Q4 2021
Average
Months of Available Inventory 2
Closed Sales by Quarter 60
Q1 2022
Q2 2022
Median
Closed Sales Volume by Quarter $80M
1.5
$60M 40
1
$40M
20 0.5
$20M
Q1
Q2
2021
Q3
Q4
2022
Q1
Q2
2021
Q3
Q4
2022
Q1
Q2
2021
Q3
2022
Q4
9
831.624.2300 montereycoastrealty.com Dolores and Seventh Carmel-by-the-Sea
S O Q U E L M A R K E T U P D AT E
SALES BY SEGMENT
S
oquel saw the average and median price fall for the quarter, with average sale price down 9% from last quarter, while increasing just 3% from Q2 2021. Q2 saw limited sales for what is normally one of the better sales quarters, down 42% from Q2 2021 to just 11 sales. Despite these numbers we saw days on market drop again to just 9 days. This competition was likely caused by the limited inventory entering the quarter. After entering Q2 with just .9 months of inventory, we exited the quarter with a substantial increase in this number to 3 months of available inventory.
$1,592,636
4%
13% <$1M | 1 $1M-2M | 20 $2M-3M | 3 $3M-5M | 0 $5M+ | 0
AV E R AG E S E L L I N G P R I C E
9% vs Q1 2022 3% vs Q2 2021
$17.5M
11
9
SALES VOLUME
UNITS SOLD
D AY S O N M A R K E T
23% vs Q1 2022 40% vs Q2 2021 10
83%
15% vs Q1 2022 42% vs Q2 2021
73% vs Q1 2022 47% vs Q2 2021
2022 Q2 MARKET REPORT
Soquel Days on Market
Average vs Median Sales
40
$2M
32 $1.57M
24
16 $1.13M
8
Q2 2021
Q3 2021
Q4 2021
Q1 2022
Q2 2021
Q2 2022
Q3 2021
Q4 2021
Average
Months of Available Inventory 3.00
Q1 2022
Q2 2022
Median
Closed Sales Volume by Quarter
Closed Sales by Quarter $60M
30
2.25
$45M
20
1.50
$30M
10 0.75
$15M
Q1
Q2
2021
Q3
Q4
2022
Q1
Q2
2021
Q3
Q4
2022
Q1
Q2
2021
Q3
2022
Q4
11
2022 Q2 MARKET REPORT
Brian Pybas REALTOR®
831.594.9402
Brian@MontereyCoastRealty.com DRE#02003077