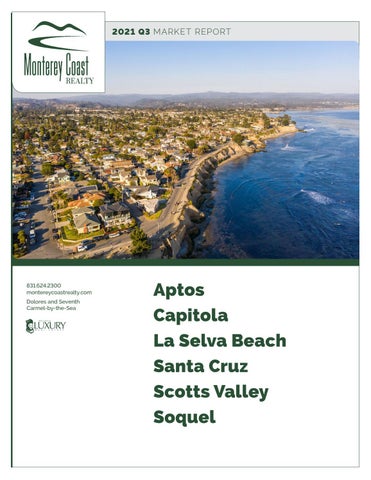
2021 Q3 MARKET REPORT
831.624.2300 montereycoastrealty.com Dolores and Seventh Carmel-by-the-Sea
Aptos Capitola La Selva Beach Santa Cruz Scotts Valley Soquel
831.624.2300 montereycoastrealty.com Dolores and Seventh Carmel-by-the-Sea
A P T O S M A R K E T U P D AT E
SALES BY SEGMENT
W
hile we have seen some leveling out of the average purchase price over the last few quarters following the rapid rise through the end of 2020, we have seen a slight decrease in the median sale price quarter over quarter. Both the number of units sold, and sales volume have remained quite strong in the face of prices remaining high. These figures were only outdone by Q3 of 2020, which were the highest ever seen in this market due to the build-up of inventory when we were emerging from lockdowns. As seen in the months of inventory graph, we were limited entering the quarter and remain in a tight market at just 1 month of available inventory.
$1,567,141
0.4% 6%
10% <$1M | 46 $1M-2M | 147 $2M-3M | 24 $3M-5M | 13 $5M+ | 1
AV E R AG E S E L L I N G P R I C E
1.4% vs Q2 2021 1.9% vs Q3 2020
$139.5M
89
24
SALES VOLUME
UNITS SOLD
D AY S O N M A R K E T
1% vs Q2 2021 11% vs Q3 2020 2
64%
20%
2% vs Q2 2021 13% vs Q3 2020
85% vs Q2 2021 25% vs Q3 2020
2021 Q3 MARKET REPORT
Aptos Average vs Median Sales
Days on Market
$1.6M
50
37.5
$1.3M
25
$1M 12.5
2020 Q3
2020 Q4
Q1 2021
Q2 2021
Q3 2021
Q3 2020
Q4 2020
Q1 2021
Q2 2021
Average
Closed Sales by Quarter
Months of Available Inventory
110
3
Q3 2021
Median
Closed Sales Volume by Quarter $160M
88 $120M
2.25
66 $80M
1.5
44
0.75
$40M
22
Q1
Q2
2020
Q3
Q4
2021
Q1
Q2
2020
Q3
Q4
2021
Q1
Q2
2020
Q3
Q4
2021
3
831.624.2300 montereycoastrealty.com Dolores and Seventh Carmel-by-the-Sea
C A P I T O L A M A R K E T U P D AT E
SALES BY SEGMENT
C
oming off a great Q2 for the Capitola market we have seen a slight pull back in average and median sale prices, most likely caused by a lower sales number of sales in the $3-5 million range. This slight pull back is also represented in the number of sales for the quarter and total sales volume. Despite these trends, the available inventory has dropped to just 1.5 months at the end of the quarter and days on market remain extremely short at just 12 days, so the demand for homes in this area remains strong.
6% 4%
$1,815,222
24% <$1M | 3 $1M-2M | 32 $2M-3M | 12 $3M-5M | 2 $5M+ | 0
AV E R AG E S E L L I N G P R I C E
5.7% vs Q2 2021 43.8% vs Q3 2020
$32.7M
18
12
SALES VOLUME
UNITS SOLD
D AY S O N M A R K E T
11% vs Q2 2021 .4% vs Q3 2020 4
65%
5% vs Q2 2021 31% vs Q3 2020
9% vs Q2 2021 54% vs Q3 2020
2021 Q3 MARKET REPORT
Capitola Days on Market
Average vs Median Sales
40
$2M
30 $1.57M
20
$1.13M
10
Q3 2020
Q4 2020
Q1 2021
Q2 2021
Q3 2020
Q3 2021
Q4 2020
Q1 2021
Average
Months of Available Inventory 6
Closed Sales by Quarter 30
Q2 2021
Q3 2021
Median
Closed Sales Volume by Quarter $40M
4.5
$30M 20
3
$20M
10 1.5
$10M
Q1
Q2
2020
Q3
Q4
2021
Q1
Q2
2020
Q3
Q4
2021
Q1
Q2
2020
Q3
Q4
2021
5
831.624.2300 montereycoastrealty.com Dolores and Seventh Carmel-by-the-Sea
L A S E LVA B E A C H M A R K E T U P D AT E
SALES BY SEGMENT
L
a Selva Beach is a smaller market within the county with a limited number of sales per quarter, so statistics can vary wildly, and is why we see such large increases across the board. This has been driven by the largest sale in the last few quarters at $5.75 million, which was on market for nearly 2 years. However, it is good to see the number of sales back around the average for the past 2 years, and the sales volume above what was a strong Q3 last year.
13% <$1M | 2 $1M-2M | 11 $2M-3M | 2 $3M-5M | 0 $5M+ | 1
AV E R AG E S E L L I N G P R I C E
115.5% vs Q2 2021 63% vs Q3 2020
$14.5M
6
130
SALES VOLUME
UNITS SOLD
D AY S O N M A R K E T
331% vs Q2 2021 9% vs Q3 2020 6
13% 6%
$2,414,583
69%
100% vs Q2 2021 33% vs Q3 2020
2067% vs Q2 2021 81% vs Q3 2020
2021 Q3 MARKET REPORT
La Selva Beach Days on Market
Average vs Median Sales
140
$2.6M
105
$1.97M
70
$1.33M 35
Q3 2020
Q4 2020
Q1 2021
Q2 2021
Q3 2020
Q3 2021
Q4 2020
Q1 2021
Average
Closed Sales by Quarter
Months of Available Inventory
15
5
Q2 2021
Q3 2021
Median
Closed Sales Volume by Quarter $18M
$14M
3.75
10
$9M
2.5
5 1.25
$5M
Q1
Q2
2020
Q3
Q4
2021
Q1
Q2
2020
Q3
Q4
2021
Q1
Q2
2020
Q3
Q4
2021
7
831.624.2300 montereycoastrealty.com Dolores and Seventh Carmel-by-the-Sea
S A N TA C R U Z M A R K E T U P D AT E
SALES BY SEGMENT
I
n Santa Cruz we see another market with reductions this quarter in average and median sale price, though a $1.6 million average sales price is still well above the 3 quarters post lockdown and beforehand. As expected from these initial numbers, both units sold and sales volume also decreased from Q2, the best quarter the Santa Cruz market has ever seen. Both days on market and months of inventory have increased slightly as well, showing a slight relief for buyers, though they are by no means at levels that will provide a substantial reduction in competition.
$1,600,518
69% 15%
0.2%
AV E R AG E S E L L I N G P R I C E
3% vs Q2 2021 17.2% vs Q3 2020
11% <$1M | 69 $1M-2M | 316 $2M-3M | 52 $3M-5M | 23 $5M+ | 1
$260.9M
163
16
SALES VOLUME
UNITS SOLD
D AY S O N M A R K E T
13% vs Q2 2021 10% vs Q3 2020 8
5%
10% vs Q2 2021 6% vs Q3 2020
14% vs Q2 2021 16% vs Q3 2020
2021 Q3 MARKET REPORT
Santa Cruz Average vs Median Sales
Days on Market
$1.7M
26
20.8
$1.37M 15.6
10.4
$1.03M 5.2
Q3 2020
Q4 2020
Q1 2021
Q2 2021
Q3 2021
Q3 2020
Q4 2020
Q1 2021
Q2 2021
Average
Months of Available Inventory Closed Sales by Quarter
2.4 190
1.8
Q3 2021
Median
Closed Sales Volume by Quarter $400M
$300M 126.667
1.2
$200M
63.333
$100M
0.6
Q1
Q1
Q2
2020
Q3
Q4
2021
Q2
2020
Q3
Q4
2021
Q1
Q2
2020
Q3
Q4
2021
9
831.624.2300 montereycoastrealty.com Dolores and Seventh Carmel-by-the-Sea
S C O T T S VA L L E Y M A R K E T U P D AT E
SALES BY SEGMENT
I
n Scotts Valley we saw a significant pull back in sale prices from the amazing Q2 without the higher end sales to bolster these numbers. With this slight change in the composition of sales, and a lower number of units sold versus Q2, we have also seen a reduction in the sales volume to just below $60 million. Demand remains strong with both days on market and months of inventory decreasing, to 16 days and 0.7 months, respectively.
19% 1%
$1,324,995
8%
<$1M | 25 $1M-2M | 95 $2M-3M | 11 $3M-5M | 1 $5M+ | 0
AV E R AG E S E L L I N G P R I C E
11.7% vs Q2 2021 9.4% vs Q3 2020
$59.6M
45
16
SALES VOLUME
UNITS SOLD
D AY S O N M A R K E T
24% vs Q2 2021 33% vs Q3 2020 10
72%
13% vs Q2 2021 22% vs Q3 2020
6% vs Q2 2021 56% vs Q3 2020
2021 Q3 MARKET REPORT
Scotts Valley Days on Market
Average vs Median Sales
40
$1.5M
32 $1.23M
24
16 $0.97M
8
Q3 2020
Q4 2020
Q1 2021
Q2 2021
Q3 2020
Q3 2021
Q4 2020
Q1 2021
Average
Months of Available Inventory 2
Closed Sales by Quarter 60
Q2 2021
Q3 2021
Median
Closed Sales Volume by Quarter $80M
1.5
$60M 40
1
$40M
20 0.5
$20M
Q1
Q2
2020
Q3
Q4
2021
Q1
Q2
2020
Q3
Q4
2021
Q1
Q2
2020
Q3
Q4
2021
11
831.624.2300 montereycoastrealty.com Dolores and Seventh Carmel-by-the-Sea
S O Q U E L M A R K E T U P D AT E
SALES BY SEGMENT
S
oquel continued its run following a great Q2 with large increases in sales volume and units sold. This was driven by multiple new sales in the higher prices ranges of $2-3 and $3-5 million ranges, which lifted the average sale price to nearly $1.7 million. The number of days on market and months of inventory have both decreased due to this momentum, and the market is left with only 0.3 months of inventory.
70% 11%
$1,679,170
6%
<$1M | 7 $1M-2M | 46 $2M-3M | 9 $3M-5M | 4 $5M+ | 0
AV E R AG E S E L L I N G P R I C E
9% vs Q2 2021 37% vs Q3 2020
$50.4M
30
15
SALES VOLUME
UNITS SOLD
D AY S O N M A R K E T
72% vs Q2 2021 63% vs Q3 2020 12
14%
58% vs Q2 2021 20% vs Q3 2020
12% vs Q2 2021 48% vs Q3 2020
2021 Q3 MARKET REPORT
Soquel Days on Market
Average vs Median Sales
50
$1.7M
40 $1.37M
30
20 $1.03M
10
Q3 2020
Q4 2020
Q1 2021
Q2 2021
Q3 2020
Q3 2021
Q4 2020
Q1 2021
Average
Closed Sales by Quarter
Months of Available Inventory
30
3
Q2 2021
Q3 2021
Median
Closed Sales Volume by Quarter $60M
$45M
2.25
20
$30M
1.5
10 0.75
$15M
Q1
Q2
2020
Q3
Q4
2021
Q1
Q2
2020
Q3
Q4
2021
Q1
Q2
2020
Q3
Q4
2021
13
2021 Q3 MARKET REPORT
Brian Pybas REALTOR®
831.594.9402
Brian@MontereyCoastRealty.com DRE#02003077