2021 Q1 MARKET REPORT
831.624.2300 montereycoastrealty.com Dolores and Seventh Carmel-by-the-Sea
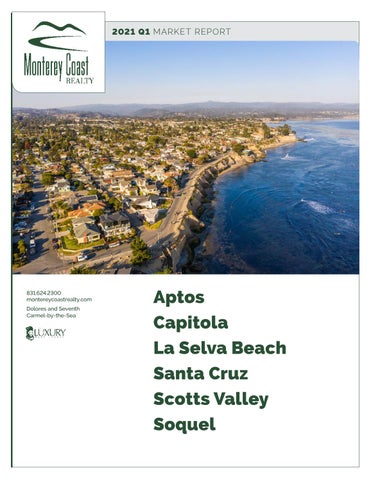
Aptos Capitola La Selva Beach Santa Cruz Scotts Valley Soquel
831.624.2300 montereycoastrealty.com Dolores and Seventh Carmel-by-the-Sea
A P T O S M A R K E T U P D AT E
SALES BY SEGMENT
I
n a market that saw some of the largest gains in average sales price through 2020 we continued to see this upward trend in the first quarter, where it rose another 8.8% to $1,578,379. Despite this rise, the sales volume dipped from last quarter due to a drop of 38.8% in units sold. Months of available inventory also rose for the first time in the last year and average days on market rose 75% from Q4. This shows a slight slowdown in momentum from what was a hot finish to 2020 in the Aptos market, however the market is still firmly in the hands of sellers.
24%
2%
$1,578,379
6%
AV E R AG E S E L L I N G P R I C E
8.8% vs Q4 2020 35.5% vs Q1 2020
10% <$1M | 12 $1M-2M | 28 $2M-3M | 5 $3M-5M | 3 $5M+ | 1
$77.3M
49
42
SALES VOLUME
UNITS SOLD
D AY S O N M A R K E T *
33.4% vs Q4 2020 25.3% vs Q1 2020 2
57%
38.8% vs Q4 2020 7.5% vs Q1 2020
75% vs Q4 2020 8.7% vs Q1 2020
2021 Q1 MARKET REPORT
Aptos Average vs Median Sales
Days on Market*
$1.6M
50
37.5
$1.3M
25
$1M 12.5
Q1 2020
Q2 2020
Q3 2020 Q4 2020
Q1 2021
Q1 2020
Closed Sales by Quarter
Months of Available Inventory
Q3 2020
Q4 2020
Average
* DOM count was suspended March 17th - May 16th 2020 due to COVID-19
110
3
Q2 2020
Q1 2021
Median
Closed Sales Volume by Quarter $160M
88 $120M
2.25
66 $80M
1.5
44
0.75
$40M
22
Q1
Q2
2020
Q3
Q4
2021
Q1
Q2
2020
Q3
Q4
2021
Q1
Q2
2020
Q3
Q4
2021
3
831.624.2300 montereycoastrealty.com Dolores and Seventh Carmel-by-the-Sea
C A P I T O L A M A R K E T U P D AT E
SALES BY SEGMENT
I
nventory was a major limiting factor in Capitola through the end of 2020, and even with an increase over Q4 it still sits at 1.3 months of available inventory. Average sale price rose 4.2% from Q4 and 45% over Q1 2020, which is a good sign after being the only city to pull back in this metric from 2019 to 2020. This accounted for the increase in sales volume despite the reduced sales numbers from the previous quarter.
30% 50% 20%
$1,439,200
<$1M | 3 $1M-2M | 5 $2M-3M | 2 $3M-5M | 0 $5M+ | 0
AV E R AG E S E L L I N G P R I C E
4.2% vs Q4 2020 45% vs Q1 2020
$14.4M
11
38
SALES VOLUME
UNITS SOLD
D AY S O N M A R K E T *
47.9% vs Q4 2020 20.8% vs Q1 2020 4
5% vs Q4 2020 33% vs Q1 2020
31% vs Q4 2020 no change
vs Q1 2020
2021 Q1 MARKET REPORT
Capitola Days on Market*
Average vs Median Sales
40
$1.5M
30 $1.23M
20
$0.97M
10
Q1 2020
Q2 2020
Q3 2020
Q4 2020
Q1 2020
Q1 2021
Months of Available Inventory
Q3 2020 Q4 2020
Average
* DOM count was suspended March 17th - May 16th 2020 due to COVID-19
6
Q2 2020
Closed Sales by Quarter
Q1 2021
Median
Closed Sales Volume by Quarter $40M
30
4.5
$30M 20
3
$20M
10 1.5
$10M
Q1
Q2
2020
Q3
Q4
2021
Q1
Q2
2020
Q3
Q4
2021
Q1
Q2
2020
Q3
Q4
2021
5
831.624.2300 montereycoastrealty.com Dolores and Seventh Carmel-by-the-Sea
L A S E LVA B E A C H M A R K E T U P D AT E
SALES BY SEGMENT
O
ne of the smaller markets in Santa Cruz County, La Selva Beach, has seen continued growth in sales price over the last few years. Despite a slight pull back in the average sale price from Q4, the median sale price has risen continuously and reached the highest point ever at $1,359,000. Although this area usually sees a lower number of sales compared to neighboring areas, you can see a pull back from a great Q4 in many of the metrics below.
29% 71%
$1,334,143
<$1M | 2 $1M-2M | 5 $2M-3M | 0 $3M-5M | 0 $5M+ | 0
AV E R AG E S E L L I N G P R I C E
18.3% vs Q4 2020 32.2% vs Q1 2020
$9.3M
7
74
SALES VOLUME
UNITS SOLD
D AY S O N M A R K E T *
42.8% vs Q4 2020 32.2% vs Q1 2020 6
30% vs Q4 2020 no change
vs Q1 2020
270% vs Q4 2020 32.1% vs Q1 2020
2021 Q1 MARKET REPORT
La Selva Beach Days on Market*
Average vs Median Sales
80
$1.4M
60 $1.17M
40
$0.93M
20
Q1 2020
Q2 2020
Q3 2020 Q4 2020
Q1 2020
Q1 2021
Average
* DOM count was suspended March 17th - May 16th 2020 due to COVID-19
Closed Sales by Quarter
Months of Available Inventory
Q4 2020
Q1 2021
Median
Closed Sales Volume by Quarter $40M
30
5
Q2 2020 Q3 2020
$30M
3.75
20
$20M
2.5
10 1.25
$10M
Q1
Q2
2020
Q3
Q4
2021
Q1
Q2
2020
Q3
Q4
2021
Q1
Q2
2020
Q3
Q4
2021
7
831.624.2300 montereycoastrealty.com Dolores and Seventh Carmel-by-the-Sea
S A N TA C R U Z M A R K E T U P D AT E
SALES BY SEGMENT
S
anta Cruz saw the average sale price continue to rise, gaining 4.7% from Q4 to $1,427,043. There are now just 24% of properties selling below $1 million compared to 41% for 2020. Along with higher percentages of sales in the $2-3 million and $3-5 million ranges versus 2020, this shows how the makeup of the Santa Cruz market has changed over the last year. Lack of inventory and high demand continues to drive this increase with months of inventory remaining at 1.2 months. This is contributing to the pull back of units sold and sales volume when compared to Q4.
$1,427,043
24%
4%
AV E R AG E S E L L I N G P R I C E
4.7% vs Q4 2020 36.8% vs Q1 2020
9% <$1M | 27 $1M-2M | 72 $2M-3M | 10 $3M-5M | 5 $5M+ | 0
$162.7M
114
25
SALES VOLUME
UNITS SOLD
D AY S O N M A R K E T *
20.9% vs Q4 2020 79.2% vs Q1 2020 8
63%
24.5% vs Q4 2020 31% vs Q1 2020
4.2% vs Q4 2020 51% vs Q1 2020
2021 Q1 MARKET REPORT
Santa Cruz Days on Market*
Average vs Median Sales
60
$1.5M
48 $1.23M
36
24 $0.97M
12
Q1 2020
Q2 2020
Q3 2020 Q4 2020
Q1 2020
Q1 2021
Months of Available Inventory
Q3 2020 Q4 2020
Average
* DOM count was suspended March 17th - May 16th 2020 due to COVID-19
2.4
Q2 2020
Closed Sales by Quarter 180
Q1 2021
Median
Closed Sales Volume by Quarter $240M
1.8
$180M
120
1.2
$120M
60 $60M
0.6
Q1
Q2
2020
Q3
Q4
2021
Q1
Q2
2020
Q3
Q4
2021
Q1
Q2
2020
Q3
Q4
2021
9
831.624.2300 montereycoastrealty.com Dolores and Seventh Carmel-by-the-Sea
S C O T T S VA L L E Y M A R K E T U P D AT E
SALES BY SEGMENT
T
he market momentum in Scotts Valley has picked up fiercely in Q4 2020 and moving into Q1 2021 as it becomes a more viable option for those priced out of other areas closer to the beach. That momentum is now showing in the average sales price as it rose 21.4% from Q4 to $1,405,088, while the median rose to $1,212,500 in the same period. Days on market and months of inventory remained stable when compared to Q4 showing that the competition in this market will remain.
26%
3%
$1,405,088
12% <$1M | 9 $1M-2M | 20 $2M-3M | 4 $3M-5M | 1 $5M+ | 0
AV E R AG E S E L L I N G P R I C E
21.4% vs Q4 2020 51.8% vs Q1 2020
$47.8M
34
28
SALES VOLUME
UNITS SOLD
D AY S O N M A R K E T *
26.3% vs Q4 2020 244% vs Q1 2020 10
59%
39.3% vs Q4 2020 127% vs Q1 2020
3.7% vs Q4 2020 73.3% vs Q1 2020
2021 Q1 MARKET REPORT
Scotts Valley Days on Market*
Average vs Median Sales
110
$1.5M
88
$1.23M 66
44
$0.97M 22
Q1 2020
Q2 2020
Q3 2020 Q4 2020
Q1 2020
Q1 2021
Months of Available Inventory
Q3 2020 Q4 2020
Average
* DOM count was suspended March 17th - May 16th 2020 due to COVID-19
2
Q2 2020
Median
Closed Sales Volume by Quarter
Closed Sales by Quarter 60
Q1 2021
$70M
$53M
1.5 40
1
$35M
20 $18M
0.5
Q1
Q2
2020
Q3
Q4
2021
Q1
Q2
2020
Q3
Q4
2021
Q1
Q2
2020
Q3
Q4
2021
11
831.624.2300 montereycoastrealty.com Dolores and Seventh Carmel-by-the-Sea
S O Q U E L M A R K E T U P D AT E
SALES BY SEGMENT
A
fter a spike in prices for Q4 we saw the average sale price pull back by 6.6% to $1,345,556 in Q1. This was accompanied by an increase in units sold of 5.9% from Q4, which left sales volume down a slight 1.1%. The days on market increase is likely due to properties closing this quarter which have long sat on market as Soquel remains the market with the tightest inventory at just 0.3 months of inventory.
28% 22%
$1,345,556
<$1M | 5 $1M-2M | 9 $2M-3M | 4 $3M-5M | 0 $5M+ | 0
AV E R AG E S E L L I N G P R I C E
6.6% vs Q4 2020 13.8% vs Q1 2020
$24.2M
18
50
SALES VOLUME
UNITS SOLD
D AY S O N M A R K E T *
1.1% vs Q4 2020 46.3% vs Q1 2020 12
50%
5.9% vs Q4 2020 28.6% vs Q1 2020
177.8% vs Q4 2020 36.7% vs Q1 2020
2021 Q1 MARKET REPORT
Soquel Days on Market*
Average vs Median Sales
80
$1.5M
64 $1.23M
48
32 $0.97M
16
Q1 2020
Q2 2020
Q3 2020 Q4 2020
Q1 2020
Q1 2021
Closed Sales by Quarter
Months of Available Inventory
Q3 2020
Average
* DOM count was suspended March 17th - May 16th 2020 due to COVID-19
Q4 2020
Q1 2021
Median
Closed Sales Volume by Quarter $32M
30
3
Q2 2020
$24M
2.25
20
$16M
1.5
10 0.75
$8M
Q1
Q2
2020
Q3
Q4
2021
Q1
Q2
2020
Q3
Q4
2021
Q1
Q2
2020
Q3
Q4
2021
13
2021 Q1 MARKET REPORT
Brian Pybas REALTOR®
831.594.9402
Brian@MontereyCoastRealty.com DRE#02003077