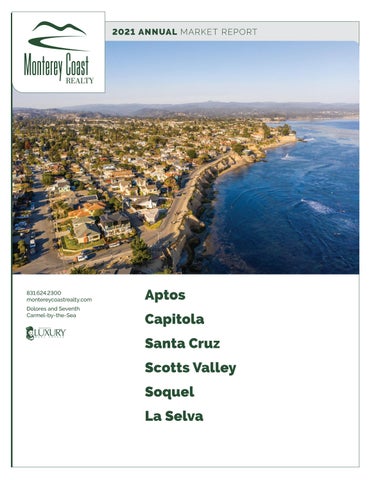
2021 ANNUAL MARKET REPORT
831.624.2300 montereycoastrealty.com Dolores and Seventh Carmel-by-the-Sea
Aptos Capitola Santa Cruz Scotts Valley Soquel La Selva
2021 ANNUAL MARKET REPORT
831.624.2300 montereycoastrealty.com Dolores and Seventh Carmel-by-the-Sea
A P T O S M A R K E T U P D AT E
SALES BY SEGMENT
T
he Aptos market continued its strong run from 2020 into 2021 and set several all-time highs for the market. 2021 brought the highest average sale price for this market at $1,609,521, up 16% year over year from a record 2020. The median price shows a similar move, up 22% from 2020 to $1,400,000. The number of sales held just above 2020 numbers at 307. When taking this into consideration along with the increase in average prices, we see the total sales volume was also up 19% to a record $494 million.
1.6% 5%
$1,757,101
11% <$1M | 60 $1M-2M | 193 $2M-3M | 35 $3M-5M | 14 $5M+ | 5
AV E R AG E S E L L I N G P R I C E
12% vs Q3 2021 21% Q4 2021 vs Q4 2020
$133.5M
76
29
SALES VOLUME
UNITS SOLD
D AY S O N M A R K E T
4% vs Q3 2021 15% vs Q4 2020 2
63%
20%
15% vs Q3 2021 5% vs Q4 2020
21% vs Q3 2021 21% vs Q4 2020
2021 ANNUAL MARKET REPORT
Aptos
Days on Market
Average vs Median Sales
50
$1.8M
37.5
$1.43M
25
$1.07M 12.5
Q4 2020
Q1 2021
Q2 2021
Q3 2021
Q4 2021
Q4 2020
Q1 2021
Q2 2021
Average
Months of Available Inventory 3
Closed Sales Volume by Quarter $160M
Q3 2021
Q4 2021
Median
Closed Sales by Quarter 110
88 2.25
$120M
66 1.5
$80M
44 $40M
0.75
22
Q1
Q2
2020
Q3
Q4
2021
Q1
Q2
2020
Q3
Q4
2021
Q1
Q2
2020
Q3
Q4
2021
3
2021 ANNUAL MARKET REPORT
831.624.2300 montereycoastrealty.com Dolores and Seventh Carmel-by-the-Sea
C A P I T O L A M A R K E T U P D AT E
SALES BY SEGMENT
D
espite a slight lull in Q4 for Capitola, we saw drastic yearover-year increases in the average and median sale prices of 42% and 47%, respectively. These increases led to a record sales volume for the year as well at $98.5 million, despite sales dropping off 18% to 56 for 2021. Lack of inventory is most likely the cause for these lower sales numbers and higher prices, with days on market setting an all-time low of just 18 days. Additionally, sales in the sub $1 million range now account for only 5% of this market when compared with 33% of the market in 2020.
70% 5% 4%
$1,677,769
<$1M | 3 $1M-2M | 39 $2M-3M | 12 $3M-5M | 2 $5M+ | 0
AV E R AG E S E L L I N G P R I C E
8% vs Q3 2021 22% vs Q4 2020
$11.7M
7
28
SALES VOLUME
UNITS SOLD
D AY S O N M A R K E T
64% vs Q3 2021 57% vs Q4 2020 4
21%
61% vs Q3 2021 65% vs Q4 2020
133% vs Q3 2021 3% vs Q4 2020
2021 ANNUAL MARKET REPORT
Capitola Days on Market
Average vs Median Sales
40
$2M
30 $1.57M
20
$1.13M
10
Q4 2020
Q1 2021
Q2 2021
Q3 2021
Q4 2020
Q4 2021
Q1 2021
Q2 2021
Average
Months of Available Inventory 6
Closed Sales by Quarter 30
Q3 2021
Q4 2021
Median
Closed Sales Volume by Quarter $40M
4.5
$30M 20
3
$20M
10 1.5
$10M
Q1
Q2
2020
Q3
Q4
2021
Q1
Q2
2020
Q3
Q4
2021
Q1
Q2
2020
Q3
Q4
2021
5
2021 ANNUAL MARKET REPORT
831.624.2300 montereycoastrealty.com Dolores and Seventh Carmel-by-the-Sea
S A N TA C R U Z M A R K E T U P D AT E
SALES BY SEGMENT
I
t was another great year for the largest market in the county, which set multiple all-time highs. The average sale price saw a 26% increase over 2020 to $1.6 million, while the median gained 30% to $1.4 million. While this market generally sees the number of sales in the 500-600 range, we saw the highest amount since 2015 at 591 in 2021. In turn, sales volume blew away records gaining 40% from a record 2020 to $946 million for 2021. Days on market set a record low of 20, which is down from the 2020 record of 25. The crazy demand in this area has continued to shape the composition of the marketplace with only 13% of sales below $1 million, down from 41% in 2020 where we began to realize this trend.
$1,690,110
0.3%
AV E R AG E S E L L I N G P R I C E
6% vs Q3 2021 24% vs Q4 2020
13% 5%
12% <$1M | 77 $1M-2M | 413 $2M-3M | 69 $3M-5M | 30 $5M+ | 2
212.9M
126
24
SALES VOLUME
UNITS SOLD
D AY S O N M A R K E T
18% vs Q3 2021 3% vs Q4 2020 6
70%
23% vs Q3 2021 17% vs Q4 2020
56% vs Q3 2021 4% vs Q4 2020
2021 ANNUAL MARKET REPORT
Santa Cruz
Average vs Median Sales
Days on Market
$1.7M
26
20.8
$1.37M 15.6
10.4
$1.03M 5.2
Q4 2020
Q1 2021
Q2 2021
Q3 2021
Q4 2021
Q4 2020
Q1 2020
Q2 2021
Q3 2021
Average
Months of Available Inventory Closed Sales by Quarter
2.4 190
1.8
Q4 2021
Median
Closed Sales Volume by Quarter $400M
$300M 126.667
1.2
$200M
63.333
$100M
0.6
Q1
Q1
Q2
2020
Q3
Q4
2021
Q2
2020
Q3
Q4
2021
Q1
Q2
2020
Q3
Q4
2021
7
2021 ANNUAL MARKET REPORT
831.624.2300 montereycoastrealty.com Dolores and Seventh Carmel-by-the-Sea
S C O T T S VA L L E Y M A R K E T U P D AT E
SALES BY SEGMENT
S
cotts Valley continued to see increased growth this year as buyers have been priced out of other areas. This has resulted in this market setting a record number of sales at 167 for the year, up 27% from 2020. Along with one of the lowest days on market numbers in the county at just 19 days, this market is no longer a relief outlet for buyers. The average and median sale prices also saw major increases of 25% and 22%. These numbers now sit at $1,418,183 and $1,325,000, respectively. As expected, the sales volume for the year totaled $237 million, which is up 58% from a great 2020.
$1,430,099
17% 1%
8%
<$1M | 28 $1M-2M | 124 $2M-3M | 14 $3M-5M | 1 $5M+ | 0
AV E R AG E S E L L I N G P R I C E
8% vs Q3 2021 24% vs Q4 2020
$50M
35
19
SALES VOLUME
UNITS SOLD
D AY S O N M A R K E T
16% vs Q3 2021 23% vs Q4 2020 8
74%
22% vs Q3 2021 38% vs Q4 2020
19% vs Q3 2021 30% vs Q4 2020
2021 ANNUAL MARKET REPORT
Scotts Valley
Days on Market
Average vs Median Sales
28
$1.5M
22.4
$1.23M 16.8
11.2
$0.97M 5.6
Q4 2020
Q1 2021
Q2 2021
Q3 2021
Q4 2021
Q4 2020
Q1 2021
Q2 2021
Average
Months of Available Inventory 2
Closed Sales by Quarter 60
Q3 2021
Q4 2021
Median
Closed Sales Volume by Quarter $80M
1.5
$60M 40
1
$40M
20 0.5
$20M
Q1
Q2
2020
Q3
Q4
2021
Q1
Q2
2020
Q3
Q4
2021
Q1
Q2
2020
Q3
Q4
2021
9
2021 ANNUAL MARKET REPORT
831.624.2300 montereycoastrealty.com Dolores and Seventh Carmel-by-the-Sea
S O Q U E L M A R K E T U P D AT E
SALES BY SEGMENT
I
n Soquel, we saw the average sale price for the year rise 25% to $1,594,475, while the median rose just 12% to $1,370,000. The number of sales for the year held strong just over 2020 numbers, which led to a record sales volume in this market of $121 million, up 36% versus 2020. As with most other markets, a new record for days on market was set for the year at just 26 days.
67% 11%
$1,922,778
7%
<$1M | 8 $1M-2M | 51 $2M-3M | 12 $3M-5M | 5 $5M+ | 0
AV E R AG E S E L L I N G P R I C E
15% vs Q3 2021 33% vs Q4 2020
$17.3M
9
34
SALES VOLUME
UNITS SOLD
D AY S O N M A R K E T
66% vs Q3 2021 29% vs Q4 2020 10
16%
70% vs Q3 2021 47% vs Q4 2020
126% vs Q3 2021 89% vs Q4 2020
2021 ANNUAL MARKET REPORT
Soquel Days on Market
Average vs Median Sales
50
$2M
40 $1.57M
30
20 $1.13M
10
Q4 2020
Q1 2021
Q2 2021
Q3 2021
Q4 2020
Q4 2021
Q1 2021
Q2 2021
Average
Months of Available Inventory
Closed Sales Volume by Quarter
3
$60M
2.25
$45M
Q3 2021
Q4 2021
Median
Closed Sales by Quarter 30
20
1.5
$30M
10 $15M
0.75
Q1
Q2
2020
Q3
Q4
2021
Q1
Q2
2020
Q3
Q4
2021
Q1
Q2
2020
Q3
Q4
2021
11
2021 ANNUAL MARKET REPORT
831.624.2300 montereycoastrealty.com Dolores and Seventh Carmel-by-the-Sea
L A S E LVA M A R K E T U P D AT E
SALES BY SEGMENT
O
ne of the smaller markets in the county, La Selva Beach, saw an up and down year due to the high volatility with a smaller number of sales. Both the average and median sale prices rose 23% to $1,705,447 and $1,140,000, respectively. However, the number of sales for the area dropped 39% to 19, which left total sales volume down 24% overall to $32 million. This is another area where sales below $1 million are disappearing from the marketplace, and now makeup just 11% of the market, which is down from 35% in 2020.
$1,738,333
67% 11% 7%
<$1M | 8 $1M-2M | 51 $2M-3M | 12 $3M-5M | 5 $5M+ | 0
AV E R AG E S E L L I N G P R I C E
28% vs Q3 2021 6.5% vs Q4 2020
$5.2M
3
15
SALES VOLUME
UNITS SOLD
D AY S O N M A R K E T
64% vs Q3 2021 68% vs Q4 2020 12
16%
50% vs Q3 2021 70% vs Q4 2020
88% vs Q3 2021 25% vs Q4 2020
2021 ANNUAL MARKET REPORT
La Selva Beach
Days on Market
Average vs Median Sales
140
$2.6M
105
$1.97M
70
$1.33M 35
Q4 2020
Q1 2021
Q2 2021
Q3 2021
Q4 2021
Q4 2020
Q1 2021
Q2 2021
Average
Months of Available Inventory
Closed Sales Volume by Quarter
5
$18M
3.75
$14M
Q3 2021
Q4 2021
Median
Closed Sales by Quarter 15
10
2.5
$9M
5 $5M
1.25
Q1
Q2
2020
Q3
Q4
2021
Q1
Q2
2020
Q3
Q4
2021
Q1
Q2
2020
Q3
Q4
2021
13
2021 ANNUAL MARKET REPORT
Brian Pybas REALTOR®
831.594.9402
Brian@MontereyCoastRealty.com DRE#02003077