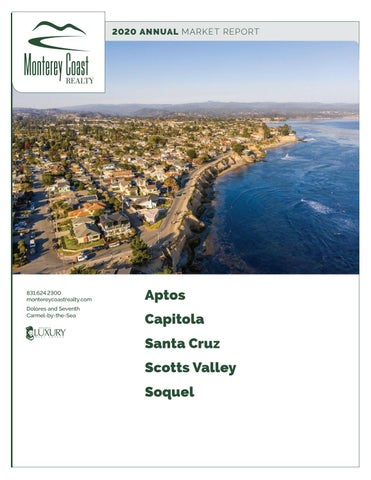
2020 ANNUAL MARKET REPORT
831.624.2300 montereycoastrealty.com Dolores and Seventh Carmel-by-the-Sea
Aptos Capitola Santa Cruz Scotts Valley Soquel
2020 ANNUAL MARKET REPORT
831.624.2300 montereycoastrealty.com Dolores and Seventh Carmel-by-the-Sea
A P T O S M A R K E T U P D AT E
SALES BY SEGMENT
T
he Aptos market saw major gains in the Average Sales Price of 18.5% which contributed to the 50% increase in Sales Volume over 2019. This is in part due to a higher concentration of sales at the high end, with double the sales over $2 million and a 50% increase in the number of sales between $1-2 million. A hot end to the year has left Aptos with the lowest Days on Market in 10 years, and a year end inventory down 50% to 0.8 months.
36% 1%
$1,384,662 AV E R AG E S E L L I N G P R I C E
19% vs 2019 21% Q4 2020 vs Q4 2019
5% 6% <$1M | 109 $1M-2M | 161 $2M-3M | 18 $3M-5M | 14 $5M+ | 3
$416.8M
301
30
SALES VOLUME
UNITS SOLD
D AY S O N M A R K E T *
50% vs 2019 61%
2
53%
Q4 2020 vs Q4 2019
27% vs 2019 33%
Q4 2020 vs Q4 2019
42% vs 2019 67%
Q4 2020 vs Q4 2019
2020 ANNUAL MARKET REPORT
Aptos
Days on Market*
Average vs Median Sales
80
$1.6M
60
$1.3M
40
$1M 20
Q4 2019
Q1 2020
Q2 2020
Q3 2020
Q4 2020
Q4 2019
Closed Sales by Quarter 110
$160M
4.5
82.5
$120M
3
55
$80M
1.5
27.5
$40M
Q2
2019
Q3
Q4
2020
Q1
Q3 2020
Q2
2019
Q3
Q4
2020
Q4 2020
Median
Closed Sales Volume by Quarter
6
Q1
Q2 2020
Average
* DOM count was suspended March 17th - May 16th due to COVID-19
Months of Available Inventory
Q1 2020
Q1
Q2
2019
Q3
2020
Q4
3
2020 ANNUAL MARKET REPORT
831.624.2300 montereycoastrealty.com Dolores and Seventh Carmel-by-the-Sea
C A P I T O L A M A R K E T U P D AT E
SALES BY SEGMENT
U
nlike the other areas looked at in the county, Capitola saw a decrease in the Average Sales Price year over year by 8% over a strong 2019. Despite this drop, Sales Volume increased by 4% over 2019 due to an increase in the number of sales by 5%. Inventory again appears to be the main factor restricting this market, with Capitola also having a 10-year low Days on Market of 29 days, and year end Months of Inventory reduced 70% from 2019 to 0.7 months.
33% 8%
$1,239,775
<$1M | 22 $1M-2M | 39 $2M-3M | 5 $3M-5M | 0 $5M+ | 0
AV E R AG E S E L L I N G P R I C E
8% vs 2019 20% Q4 2020 vs Q4 2019
$81.8M
66
29
SALES VOLUME
UNITS SOLD
D AY S O N M A R K E T *
4% vs 2019 60%
4
59%
Q4 2020 vs Q4 2019
5% vs 2019 33%
Q4 2020 vs Q4 2019
36% vs 2019 17%
Q4 2020 vs Q4 2019
2020 ANNUAL MARKET REPORT
Capitola
Days on Market*
Average vs Median Sales
40
$1.4M
30 $1.17M
20
$0.93M
10
Q4 2019
Q1 2020
Q2 2020
Q3 2020
Q4 2019
Q4 2020
Months of Available Inventory
Q2 2020
Average
* DOM count was suspended March 17th - May 16th due to COVID-19
8
Q1 2020
Closed Sales by Quarter
Q3 2020
Q4 2020
Median
Closed Sales Volume by Quarter $40M
30
6
$30M 20
4
$20M
10 2
$10M
Q1
Q2
2019
Q3
Q4
2020
Q1
Q2
2019
Q3
Q4
2020
Q1
Q2
2019
Q3
2020
Q4
5
2020 ANNUAL MARKET REPORT
831.624.2300 montereycoastrealty.com Dolores and Seventh Carmel-by-the-Sea
S A N TA C R U Z M A R K E T U P D AT E
SALES BY SEGMENT
A
s with most of the coastal areas in Santa Cruz County, the Santa Cruz market was hampered by low inventory throughout the latter half of the year. This contributed to the market seeing the lowest Days on Market in the last 10 years, and year end Months of Inventory down 40% from 2019 to just 0.9 months. Despite having a lower Number of Sales than in 2019, the Sales Volume for 2020 increased slightly year over year, and was driven by a larger composition of high-end sales in the $2mil+ range.
$1,270,799 AV E R AG E S E L L I N G P R I C E
8% vs 2019 19% Q4 2020 vs Q4 2019
50%
0.2% 2% 6%
<$1M | 223 $1M-2M | 269 $2M-3M | 32 $3M-5M | 13 $5M+ | 1
$676.1M
532
25
SALES VOLUME
UNITS SOLD
D AY S O N M A R K E T *
3% vs 2019 37%
6
41%
Q4 2020 vs Q4 2019
4% vs 2019 15%
Q4 2020 vs Q4 2019
43% vs 2019 63%
Q4 2020 vs Q4 2019
2020 ANNUAL MARKET REPORT
Santa Cruz
Days on Market*
Average vs Median Sales
70
$1.4M
56 $1.17M
42
28 $0.93M
14
Q4 2019
Q1 2020
Q2 2020
Q3 2020
Q4 2019
Q4 2020
Closed Sales by Quarter
Months of Available Inventory
Q2 2020
Q3 2020
Average
* DOM count was suspended March 17th - May 16th due to COVID-19
180
3
Q1 2020
Q4 2020
Median
Closed Sales Volume by Quarter $240M
$180M
2.25
120
$120M
1.5
60 0.75
$60M
Q1
Q2
2019
Q3
Q4
2020
Q1
Q2
2019
Q3
Q4
2020
Q1
Q2
2019
Q3
2020
Q4
7
2020 ANNUAL MARKET REPORT
831.624.2300 montereycoastrealty.com Dolores and Seventh Carmel-by-the-Sea
S C O T T S VA L L E Y M A R K E T U P D AT E
SALES BY SEGMENT
S
cotts Valley saw a shift in the composition of sales from the lower end to the mid-range of the market where sales in the $1-2 million range increase by 21%. This bumped the Average Sales Price for the area up 4.5% over 2019, which is only half of the county average. Combined with an increase in the Number of Sales of 7.3%, Sales Volume increased by 12% year over year. Months from Inventory increased year over year, which is a break from the trend, but remains tight at 0.9 months.
41% 56%
$1,136,869 AV E R AG E S E L L I N G P R I C E
5% vs 2019 4% Q4 2020 vs Q4 2019
<$1M | 54 $1M-2M | 74 $2M-3M | 4 $3M-5M | 0 $5M+ | 0
$150M
132
35
SALES VOLUME
UNITS SOLD
D AY S O N M A R K E T *
12% vs 2019 76%
8
3%
Q4 2020 vs Q4 2019
7% vs 2019 70%
Q4 2020 vs Q4 2019
3% vs 2019 48%
Q4 2020 vs Q4 2019
2020 ANNUAL MARKET REPORT
Scotts Valley
Average vs Median Sales
Days on Market*
$1.3M
110
88
$1.1M 66
44
$0.9M 22
Q4 2019
Q1 2020
Q2 2020
Q3 2020
Q4 2020
Q4 2019
Closed Sales by Quarter
Months of Available Inventory
Q2 2020
Average
* DOM count was suspended March 17th - May 16th due to COVID-19
Q3 2020
Q4 2020
Median
Closed Sales Volume by Quarter $70M
60
7
Q1 2020
$53M
5.25
40
$35M
3.5
20 1.75
$18M
Q1
Q2
2019
Q3
Q4
2020
Q1
Q2
2019
Q3
Q4
2020
Q1
Q2
2019
Q3
2020
Q4
9
2020 ANNUAL MARKET REPORT
831.624.2300 montereycoastrealty.com Dolores and Seventh Carmel-by-the-Sea
S O Q U E L M A R K E T U P D AT E
SALES BY SEGMENT
I
n Soquel we saw the Average Sales Price increase by 8.5% while the Median Sales Price rose 26%. This was led by a change in the composition of sales from the below $1 million range to $1-2 million range, and an overall increase in sales over $2 million. This shift accounts for the increase in Sales Volume despite a decrease in the years Number of Sales. Once again, we saw the lowest Days on Market in the past 10 years at 31 days, and a slightly reduced Months of Inventory to 1.1 months.
$1,274,833
59% 1% 6% <$1M | 24 $1M-2M | 42 $2M-3M | 4 $3M-5M | 1 $5M+ | 0
AV E R AG E S E L L I N G P R I C E
9% vs 2019 25% Q4 2020 vs Q4 2019
$89.2M
70
31
SALES VOLUME
UNITS SOLD
D AY S O N M A R K E T *
4% vs 2019 15%
10
34%
Q4 2020 vs Q4 2019
4% vs 2019 32%
Q4 2020 vs Q4 2019
39% vs 2019 71%
Q4 2020 vs Q4 2019
2020 ANNUAL MARKET REPORT
Soquel
Days on Market*
Average vs Median Sales
80
$1.5M
64 $1.23M
48
32 $0.97M
16
Q4 2019
Q1 2020
Q2 2020
Q3 2020
Q4 2019
Q4 2020
Months of Available Inventory
Q2 2020
Average
* DOM count was suspended March 17th - May 16th due to COVID-19
4
Q1 2020
Closed Sales by Quarter
Q3 2020
Q4 2020
Median
Closed Sales Volume by Quarter $32M
30
3
$24M 20
2
$16M
10 1
$8M
Q1
Q2
2019
Q3
Q4
2020
Q1
Q2
2019
Q3
Q4
2020
Q1
Q2
2019
Q3
2020
Q4
11
2020 ANNUAL MARKET REPORT
Brian Pybas REALTOR®
831.594.9402
Brian@MontereyCoastRealty.com DRE#02003077