
Transportation Market Overview






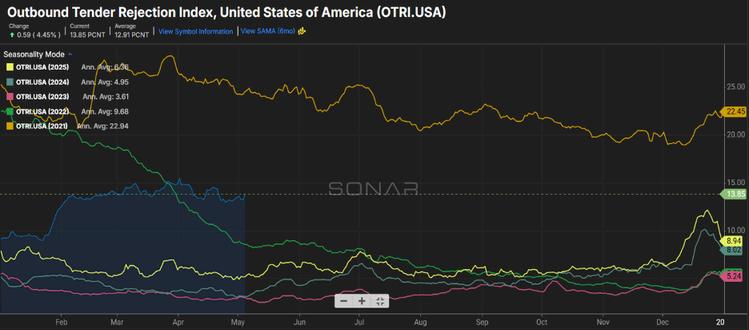
Elevated spot rates have reversed the decline in for-hire truckload employment, with more drivers returning to their trucks This environment of increasing spot rates has facilitated more drivers entering the market despite diesel price inflation due to the standstill in Iran Time will tell if this trend holds, given the lag in reporting and known impact to capacity after the surge in diesel prices in March, though raw carrier base numbers have increased for the third consecutive month, a trend unseen since September 2022. This dynamic will most certainly be met with challenges given the Supreme Court ruling in the Montgomery vs. Caribe case with increased scrutiny on an already strained market takes shape
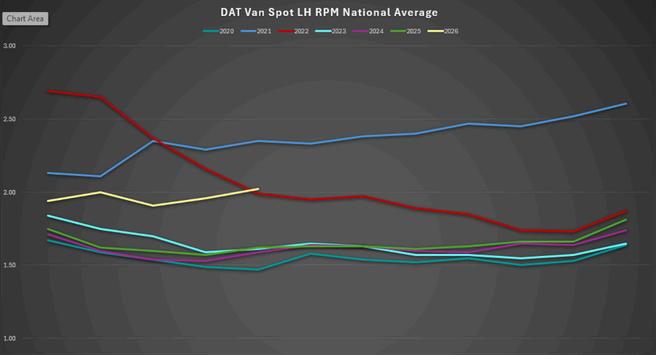
DAT’s National Van Spot
Linehaul RPM remained high and increased from March to April. Dry Van load volumes are up significantly YoY. The degree to which capacity tightens due to both demand, geopolitics and the recent Supreme Court ruling will set the stage for what could be a sustained period of elevated rates Significant volatility with fuel will impact available capacity and further pressure test rates.


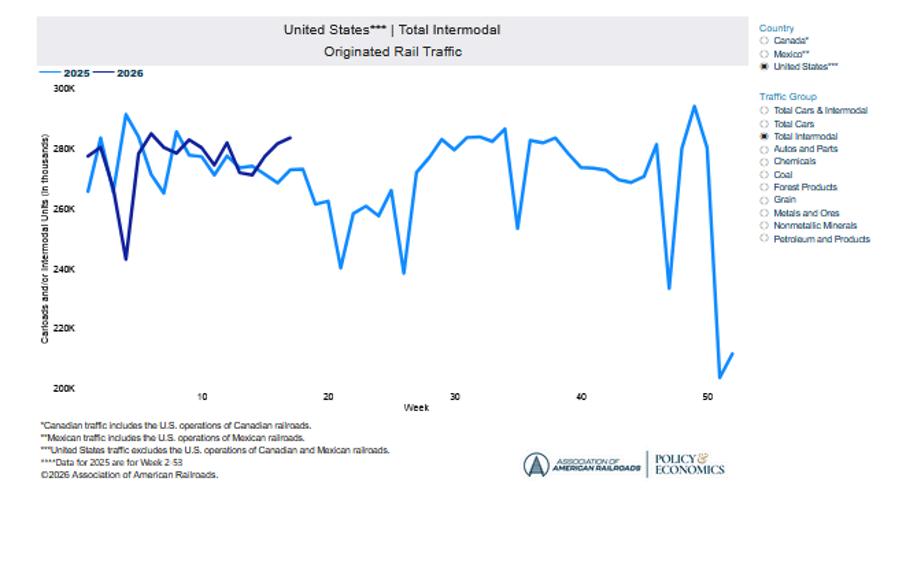
Domestic intermodal volumes continue to surge due to increasing fuel costs and truck capacity tightening. It is recommended that shippers explore intermodal options for long-distance lanes over 500 miles before intermodal capacity shrinks too far and rates increase. Rising fuel costs and truckload rates are already leading to tighter intermodal capacity, most noticeably on the West Coast, but can be seen everywhere in North America.
We are still seeing intermodal providers taking rate increases of 3-5% on RFPs and bid proposals, though some shippers have experienced higher increases. Intermodal providers are showing rate discipline and not giving many concessions during this bid cycle.
The intermodal volume forecast for 2026 has increased to 2.6% growth, and 2027 projections have shrunk to 1%. The expected primary driver of intermodal growth remains truckload-to-intermodal conversions

Here are links to some top stories in the industry for you to check out:
Shipping Data Is Transforming LTL Outcomes
Saia Enhances Northeast Presence
XPO Reports 20%
YoY Spike in Q1 LTL Operating Income
Averitt Plans $200
Million Logistics Campus in Charlotte Area
May is starting to give the industry a better read on whether the market has truly stabilized or if freight is simply moving around differently. Most carriers are still reporting fairly steady shipment activity, but network performance and freight quality are becoming bigger talking points than raw volume. The focus now is less about “winning freight” and more about making sure the freight being moved actually fits the network efficiently.
One trend becoming more noticeable is how differently regional markets are performing. Some industrial and manufacturing pockets are showing signs of life, while other areas remain extremely slow. That unevenness is creating a more fragmented operating environment where carriers are seeing strong density in certain lanes but softer utilization in others As a result, network balancing and freight mix management continue to play a major role in day-to-day operations
The market is also beginning to feel more competitive around service expectations. After several years where capacity concerns drove many conversations, shippers are putting more attention back on consistency, communication and claims performance. Carriers that can combine stable pricing with reliable execution appear to be separating themselves from the pack as customers reevaluate long-term routing decisions coming out of bid season.
At the same time, most carriers still seem hesitant to fully call a recovery. While there are some encouraging signals in parts of the goods economy, freight demand overall has not yet built enough consistency to support broad expansion plans or aggressive growth strategies. Instead, the industry continues to prioritize operational discipline, cost control and network efficiency while waiting for stronger demand signals to develop.
Bottom line: May feels like a market that is settling into its current conditions rather than fighting them. Freight levels remain stable, networks are becoming more refined, and service execution is regaining importance as a competitive differentiator The industry is operating from a more controlled position now, but meaningful growth still depends on stronger and more consistent demand developing later in the year
SOURCE: FreightWaves, “Yield discipline, fuel price surge driving LTL rates to new highs in Q2,” Todd Maiden, April 14, 2026
The LTL market continues to show strong pricing discipline as carriers move through the second quarter of 2026. According to the latest TD Cowen-AFS Freight Index, LTL rates are expected to reach new highs, driven by a combination of elevated fuel costs, improving shipment weights, and carriers continuing to protect yield rather than aggressively pursue volume.
The report showed LTL rate-per-pound levels remaining significantly above historical benchmarks, with expectations for another year-over-year increase during Q2. Fuel prices have become a major contributor to rising transportation costs, while improving freight characteristics are also helping support carrier margins.
One notable shift is the return of heavier shipment profiles. Weight per shipment increased sequentially for the first time in nearly two years, signaling possible stabilization within the industrial economy. Manufacturing activity remained in expansion territory throughout the first quarter, and new order activity continued to improve despite ongoing concerns tied to tariffs, geopolitical tensions, and overall economic uncertainty
The report also reinforced a trend that has defined the market over the past year: carriers continue to prioritize pricing discipline and network efficiency over chasing incremental freight Rather than discounting to fill networks during slower demand periods, most LTL providers have remained selective about the freight they accept and focused on protecting long-term yield performance.
At the same time, rising diesel prices are beginning to create additional pressure across the transportation sector. Increased fuel surcharge activity, combined with improving shipment density, is contributing to stronger carrier revenue performance and pushing overall transportation costs higher for shippers.
This environment continues to reinforce the importance of strategic carrier alignment, clean freight execution and disciplined pricing strategies As carriers remain focused on yield and network efficiency, MODE Global’s ability to align customers with the right carrier solutions becomes increasingly important in helping manage cost, service and long-term transportation stability When you partner with MODE Global, that’s exactly what you gain: access to a disciplined, carrier-aligned network focused on delivering dependable service, competitive solutions and long-term value in a changing freight market.
The ISM Manufacturing PMI held at 52.7 in April 2026, matching the strongest reading since August 2022, though slightly below expectations. New orders improved, and supplier delays continued to lengthen, while production growth slowed and employment posted its weakest reading in four months. The biggest concern remained inflationary pressure, with input costs rising at the fastest pace since late 2021, largely tied to higher oil and diesel prices stemming from Middle East conflict impacts. ISM survey commentary stayed heavily cautious, with most respondents citing ongoing uncertainty around the Iran war and tariffs.
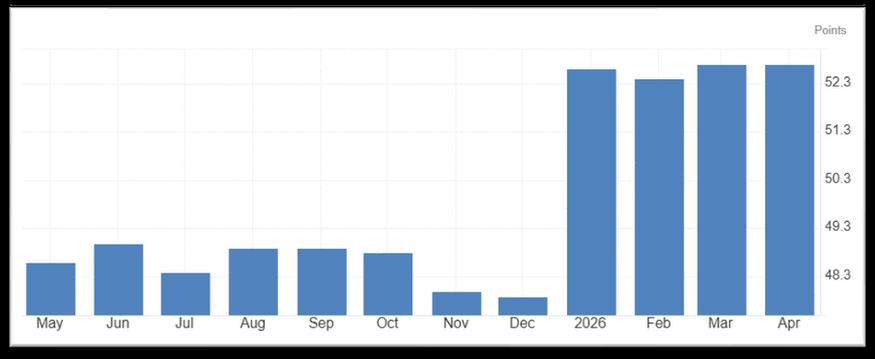
Source: Trading Economics & Federal Reserve
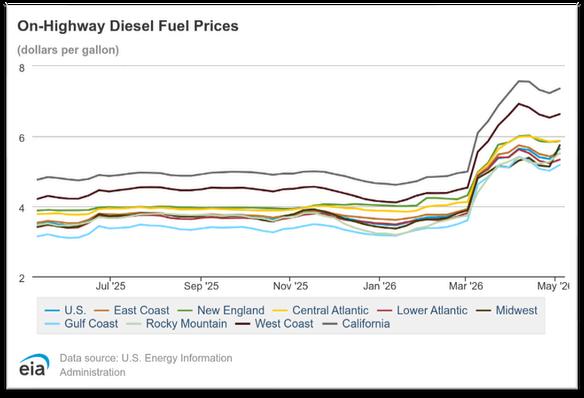
The U.S. national average cost per gallon for on-highway diesel in April 2026 came in at approximately $3.66, which is $0.08 (2.1%) lower than March 2026’s average of roughly $3.74. April 2025’s average was approximately $4.02, putting April 2026 about $0.36 (9.0%) lower yearover-year. As of the first week of May 2026 (week ending May 4, 2026), the national average stands at $3.59 per gallon, reflecting a decrease of $0.07 (1 9%) from the April monthly average

May marks a pivotal moment for parcel shippers. Here’s what is influencing the market right now and what should be top of mind.
On June 1, FedEx completes the spinoff of FedEx Freight into an independent, publicly traded company, making it the largest standalone LTL carrier in North America The new entity will trade on the NYSE under the ticker FDXF, generating nearly $9 billion in annual revenue This marks one of the most significant structural changes in the carrier's history.
For decades, FedEx operated as an integrated network where parcel, express and freight services shared infrastructure, capital and commercial relationships. The spinoff formally separates that structure. FedEx will now focus exclusively on parcel, ground and express services, while FedEx Freight operates independently with its own pricing strategy, network investment decisions and capital allocation.
For shippers, the practical impact is mostly felt in how services and agreements are structured going forward. Many FedEx customers have historically shipped both parcel and LTL freight under a single commercial relationship, but post-spinoff, those are two separate companies. Shippers with both parcel and freight needs will manage those relationships independently, each governed by its own terms and service commitments.
The spinoff is expected to benefit both businesses operationally FedEx Freight gains the ability to invest in terminal upgrades and pursue LTL-specific growth without competing internally with parcel for capital. FedEx parcel, in turn, sharpens its focus on ground, express, and the data and visibility capabilities it has been building out. A more focused FedEx means a more responsive FedEx for customers.
While the June 1 date is confirmed, shippers with existing FedEx relationships will continue to be served as the transition is designed to be seamless. Understanding the structural shift helps set the right expectations for how the relationship evolves from here.

FedEx and ServiceNow recently announced an expanded collaboration embedding FedEx network intelligence directly into enterprise supply chain and procurement workflows, the clearest signal yet that it intends to compete on the value of its data, not just its network. Carriers are no longer competing only on rate and transit time; data capabilities, visibility tools and system integrations are becoming part of the carrier value equation and worth understanding when evaluating your program.
Data capabilities, visibility tools and system integrations have become a more meaningful part of how carriers differentiate MODE is collaborating closely with FedEx to identify the best ways to leverage their data to enhance client value and strengthen our parcel offering
The end of the U.S. de minimis exemption is now the baseline reality for cross-border parcel. Every commercial shipment entering the U.S. requires full customs entry and documentation, adding $15–$25 per parcel in brokerage and compliance costs, making it a structural cost shift, not a temporary one.
Looking ahead, the USMCA treaty review beginning July 1 introduces new uncertainty for Canadian and Mexican cross-border volume. Shippers with cross-border programs should ensure their cost models and compliance processes reflect where policy currently stands and not where it was a year ago.
Cross-border programs built on 2025 cost assumptions are likely underestimating current landed costs. Q2 is the right time to recalibrate.
Carrier peak surcharge announcements arrive in August, and the time to get ahead of them is Q2 Volumes are stable, Q1 data is available and there's still room to make program changes before the market tightens That window closes quickly once mid-year contract activity picks up in June and July
Audit Q1 invoices for surcharge exposure such as residential, delivery area, additional handling and large package fees. As mentioned in last month’s Insight, surcharges now represent 30–40% of total parcel spend for many shippers.
Review package dimensions against current dim weight and handling thresholds. Thresholds were updated in 2026, and some packages that cleared last year may not today.
Validate cross-border compliance and cost models reflect the post-de minimis reality.
Stay informed on the FedEx Freight spinoff and how the separation of parcel and freight services may affect your shipping program going forward.

Rates: Spot rates remain volatile but stabilizing, especially on Transpacific lanes. Surcharges and fuel increases pushing rates higher globally.
Volume: Consumer demand is slowing modestly prior to typical peak season. Little optimism for increases as retail inventory “normalization” continues with U.S. importers.
Capacity: Structural oversupply of vessels remains the primary driver while blank sailings, port congestion and transit delays offset some of the imbalance.
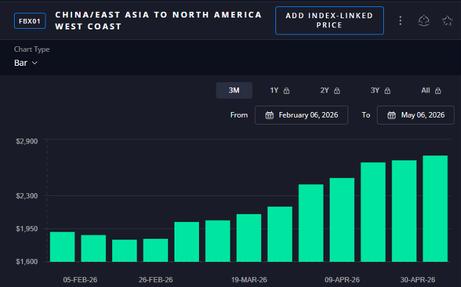
Container freight rates stabilized in late April and early May after sharp increases during March and early April linked to disruptions around the Strait of Hormuz and Middle East shipping corridors. Rates remain materially above February lows but below the crisis peaks seen during earlier Red Sea disruptions.
Moving into May, the Freightos Baltic Index showed Asia-U S West Coast spot rates increased about 3% to $2,675 per FEU AsiaU S East Coast prices rose nearly 10 % to $3,939 per FEU.
The Xeneta market average index for spot rates closing April for Far East to the U.S. West Coast were $2,857 per FEU, and $3,871 per FEU to the East Coast.
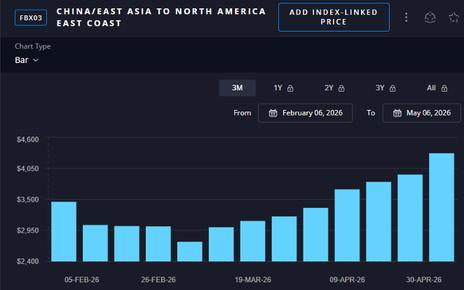
Increasing fuel costs and other surcharges from the Strait of Hormuz closure continue to keep container rates elevated during the pre-peak season, a low-demand period for ocean freight when prices typically drop to the lowest levels for the year
However, even with this pressure, rates remain well below the spikes caused by recent disruptions, such as the Red Sea crisis and trade-war frontloading last year.
Slowly improving demand has helped carriers steadily push up rates on the Transpacific and prevent backsliding since late February. The current West Coast price is 45% higher than at the start of the Iran conflict, and almost 90% higher than post-peak season levels back in October. East Coast prices are 30% higher than pre-conflict and 30% better than October.
Carriers continue to implement additional surcharges to provide artificial support for the eroding rate levels due to slow demand. Some carriers have already started to talk about Peak Season Surcharges (PSS), while all have fully implemented substantial Emergency Fuel Surcharges (EFS). The latest additional fee is a Congestion Surcharge at some ports.
April U.S. import volumes saw a month-over-month increase compared to March and nearly matched January levels; however, although only projections at this point, import volumes for May 2026 are forecasted for a solid recovery compared to earlier months in the year, with an estimated 2 13 million TEUs This represents the first positive year-over-year growth of 2026, driven primarily by a low comparative base from 2025
These projected levels for May would be the highest volume month in the first half of 2026 This reflects a seasonal “peak season” uptick when retailers typically start shipping for late-summer and earlyfall inventory needs.
It is important to note that the sharp 9.3% YoY increase is largely due to the weaker comps from May 2025. During that time, the market mostly collapsed in the aftermath of the start of the Trump tariff war on imports.
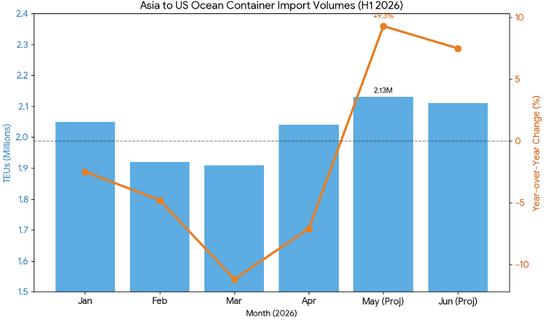
While China remains the dominant origin for U.S. import demand, May volumes also reflect an ongoing divergence in sourcing. Imports from Southeast Asia, like Thailand (+36.5% YoY) and Vietnam (+17.8% YoY), are growing rapidly, partially offsetting continued weakness in China-origin volumes.
The past two years have been driven more by “just-in-case” inventory management, which was fueled by global disruptions and tariff concerns. This process has now somewhat normalized, with U.S. importers now managing inventory levels and ordering patterns shifting more toward a leaner, just-in-time model. In either case, consumer demand for imports has slowed modestly, and organic demand growth remains weaker than in prior recovery cycles over the last two years.
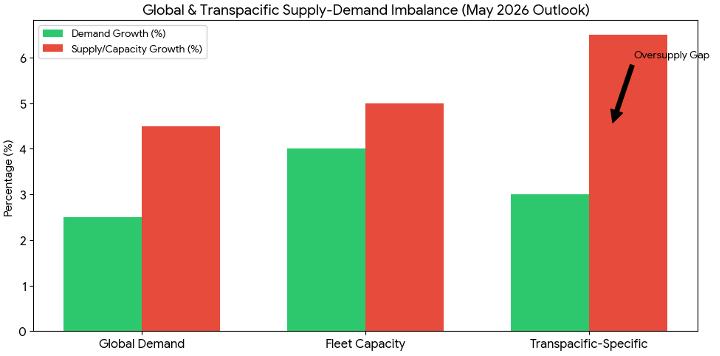
The biggest issue facing container shipping for the rest of 2026 remains structural oversupply, meaning that there is already more capacity than the volumes will support. But on top of that, there continues to be a significant influx of new vessels and capacity that is scheduled to come online throughout the remainder of 2026.
Additionally, many analysts believe that reopening Suez Canal routings (re-routed by the Red Sea conflict) would rapidly release new, effective, or “real-world” capacity back into regular service rotations and pressure rates even further downward.
Carriers have scheduled a 6% global blank sailing (sailing cancellation) rate for May. The majority of these blank sailings will occur in the Asia-Europe (42%) trade and Asia to U.S. Transpacific (40%) trades.
Through mid-June, roughly 6% of scheduled departures are expected to be blanked This is about 43 total blank sailings across major global lanes, with 40% affecting the Transpacific eastbound route The chart provides an overview of available capacity by carrier alliance:
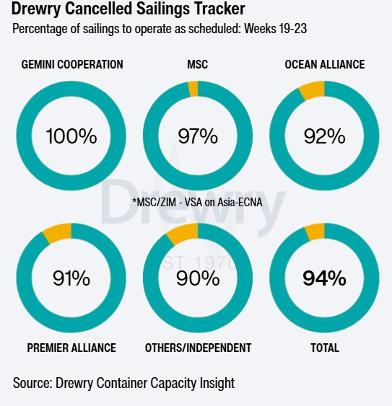
Despite blank sailings, actual deployed capacity is expected to increase in May with new vessel introductions. Overall capacity, even factoring in blank sailings and service suspensions, is projected to rise 11% for Asia–U.S. East Coast and 6% for Asia–U.S. West Coast.
Fleet capacity growth continues to outpace cargo demand globally, but the gap is much worse in the Asia-to-U.S. trade. Although carrier capacity management (blank sailings and rerouting) is preventing a steep collapse in rates, it seems unlikely that carriers will be able to push rates upwards based only on supply and demand.