Prince George’s County Planning Department
Tunisia
Morocco Algeria
Libya
Egypt
Mauritania Mali Senegal Gambia Guinea-Bissau Guinea Sierra Leone Liberia
Niger
Eritrea
Burkina Faso Benin Togo Ghana Côte d'Ivoire
Djibouti Nigeria Central African Republic
Cameroon Equatorial Guinea Gabon
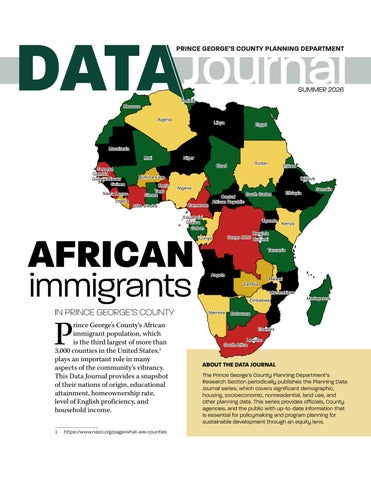
AFRICAN immigrants P IN PRINCE GEORGE’S COUNTY rince George’s County‘s African immigrant population, which is the third largest of more than 3,000 counties in the United States,1 plays an important role in many aspects of the community’s vibrancy. This Data Journal provides a snapshot of their nations of origin, educational attainment, homeownership rate, level of English proficiency, and household income. 1
Sudan
Chad
https://www.naco.org/page/what-are-counties
Ethiopia
South Sudan
Uganda
Somalia
Kenya
Rwanda Congo DRC Burundi
Congo
Tanzania
Angola Zambia
Malawi Mozambique
Zimbabwe Namibia
Madagascar
Botswana Eswatini
Lesotho South Africa
ABOUT THE DATA JOURNAL The Prince George’s County Planning Department’s Research Section periodically publishes the Planning Data Journal series, which covers significant demographic, housing, socioeconomic, nonresidential, land use, and other planning data. This series provides officials, County agencies, and the public with up-to-date information that is essential for policymaking and program planning for sustainable development through an equity lens.
African Immigrants The County Ranks Third Nationally The Washington, D.C., metropolitan area has one of the largest African immigrant populations in the nation, particularly in Montgomery and Prince George’s Counties. Table 1 shows that the two counties ranked second and third, respectively, in the nation for the number of African immigrants. “African residents represent a remarkable percentage of the County’s business community, and they continue to shape the economic and cultural fabric of our County’s future,” said Prince George’s County Council Member Wala Belgay ahead of a 2024 cultural night celebration. Earlier that year, Maryland Governor Wes Moore proclaimed September as African Heritage Month. In 2024, 25 percent of the County’s 959,754 residents were foreign born. Table 2 shows that 61,443 of these foreign-born residents are from African nations. The number of African immigrants increased 58 percent from 2010 to 2024. Table 1.
TOP 10
ABOUT THE DATA The data are from the U.S. Census Bureau’s American Community Survey (ACS) 5-year estimates for 2010 and 2024 by public use microdata area (PUMA). PUMAs are nonoverlapping, statistical geographic areas of no fewer than 100,000 people each.”2 There are seven PUMAs in Prince George’s County. PUMAs are used for statistical analysis because: 1.
The larger the geography, the more accurate the data are.
The Seven PUMAS are: 2.
PUMAs represent the County well, showing
PUMAareas 01101:inside Innerand Northwest George’s County-outsidePrince the Capital Beltway College(I-495). Park City & Langley Park For some categories, this George’s Journal applies the ACS PUMA 01102: North Prince County--Laurel, Public Use Microdata Sample (PUMS or MDAT) to Greenbelt & Beltsville access specific cross-referenced data. MDAT files
PUMA InnertoNortheast Prince County-allow01103: data users filter records by George’s both geography New Carrollton & Hyattsville (PUMA) and specific demographics, such as place of birth (Nigeria) with limited English proficiency.
PUMA 01104: Central Prince George’s County--Seat The more detailed data, the larger the margin Pleasant City, Capitolthe Heights Town & Landover of error, because ACS estimates are based on a
PUMA 01105: Eastsample Princeof George’s County--Bowie City, relatively small approximately 2 percent Kettering & Largo of addresses nationwide. Cross-referenced data may face additional statistical limitations due to PUMA 01106: South Prince George’s County--Clinton, small sample sizes and federal confidentiality Fort Washington & Rosaryville
requirements. Additionally, totals may differ across tables because Prince of sampling variation and PUMA 01107: Southwest George’s County--Oxon statistical methods used in data collection and Hill, Hillcrest Heights & Temple Hills computation. 2 census.gov/programs-surveys/geography/guidance/ geo-areas/pumas.html
counties in the U.S. with the largest African immigrant populations in 2024
IN 2024 County
IN 2010 Population
County
Population
1. Harris County, Texas
76,731
1. Los Angeles County, California
2. Montgomery County
62,763
2. Montgomery County
41,473
3. Prince George’s County
61,443
3. Prince George’s County
38,889
4. Bronx County, New York
60,060
4. Bronx County, New York
38,811
5. Los Angeles County, California
59,313
5. Hennepin County, Minnesota
35,205
6. Hennepin County, Minnesota
58,613
6. Harris County, Texas
33,119
7. Franklin County, Ohio
54,889
7. Cook County, Illinois
30,350
8. Dallas County, Texas
52,475
8. King County, Washington
28,618
9. Cook County, Illinois
50,198
9. Kings County, New York
27,654
10. King County, Washington
48,452
10. Fairfax County, Virginia
United States
2,762,710
Page 2 • African Immigrants in Prince George’s County
United States
47,484
26,917 1,466,454
Prince George’s County Planning Department
Map 1. Prince George’s County Public Use Microdata Areas (PUMAs)
Laurel
PUMA 01102 PUMA 01101
Beltsville
Inner Northwest Prince George’s County— College Park City & Langley Park
Greenbelt
Bladensburg
Bowie
Landover
Seat Pleasant
PUMA 01104
Glenn Dale
New Carrollton
PUMA 01103
Inner Northeast Prince George’s County—New Carrollton & Hyattsville
PUMA 01105
PUMA 01105
East Prince George’s County—Bowie City, Kettering & Largo
Largo
PUMA 01104
Central Prince George’s County—Seat Pleasant City, Capitol Heights Town & Landover
Southwest Prince George’s County—Oxon Hill, Hillcrest Heights & Temple Hills
PUMA 01102
College Park
PUMA 01101
PUMA 01103
PUMA 01107
North Prince George’s County—Laurel, Greenbelt & Beltsville
Forestville Hillcrest Heights
Oxon Hill
PUMA 01107
Upper
Camp Springs
Marlboro
Clinton
Fort Washington
PUMA 01106 Brandywine
PUMA 01106 South Prince George’s County—Clinton, Fort Washington & Rosaryville
Aquasco
Prince George’s County Planning Department
African Immigrants in Prince George’s County • Page 3
African Immigrants Map 2. African Immigrant Population by Public Use Microdata Area Laurel
African Immigrant Population
PUMA 01102 14,438
2,413 - 6,000 Beltsville
6,001 - 10,000 10,001 - 14,438
College
Greenbelt
PUMA Park 01101 New 8,824 Carrollton PUMA 01103 10,596 Bladensburg
Glenn Dale Bowie
Landover Largo
Seat Pleasant
PUMA 01105 14,363
PUMA 01104 6,344
Forestville Hillcrest Heights
Oxon Hill
PUMA 01107 2,413
Upper Marlboro
Camp Springs
Clinton
PUMA 01106 4,465
Fort Washington Brandywine
Aquasco
Page 4 • African Immigrants in Prince George’s County
Prince George’s County Planning Department
Table 2. Prince George’s County population born in Africa by PUMA, 2010 and 2024 PUMA 01101
PUMA 01102
PUMA 01103
PUMA 01104
PUMA 01105
PUMA 01106
PUMA 01107
County
2024 Population
129,371
145,892
120,587
116,524
196,488
136,335
114,557
959,754
Total Foreign-born
59,718
46,776
47,604
19,124
33,609
17,875
17,673
242,379
Born in Africa
8,824
14,438
10,596
6,344
14,363
4,465
2,413
61,443
14.8%
30.9%
22.3%
33.2%
42.7%
25.0%
13.7%
25.3%
2010 Population
112,608
128,142
107,048
95,302
162,844
144,132
104,646
854,722
Total Foreign-born
47,942
33,892
34,587
7,506
21,819
11,831
8,267
165,844
Born in Africa
7,922
9,196
7,005
2,059
9,189
2,184
1,334
38,889
Percent of foreign-born population born in Africa
16.5%
27.1%
20.3%
27.4%
42.1%
18.5%
16.1%
23.4%
Change in population between 2010-2024
16,763
17,750
13,539
21,222
33,644
-7,797
9,911
105,032
African immigrant population
902
5,242
3,591
4,285
5,174
2,281
1,079
22,554
Percent change
11.4%
57.0%
51.3%
208.1%
56.3%
104.4%
80.9%
58.0%
Percent of foreign-born population born in Africa
Table 3. Decade of Entry of African Immigrants by PUMA, 2024 PUMA 01101
PUMA 01102
PUMA 01103
PUMA 01104
PUMA 01105
PUMA 01106
PUMA 01107
County
Before 1950
0
0
0
0
0
11
0
11
1950 - 1959
0
21
0
0
71
32
0
124
1960 - 1969
37
196
14
48
182
22
40
539
1970 - 1979
289
175
473
84
365
146
104
1,636
1980 - 1989
586
1,056
820
306
1,716
502
184
5,170
1990 - 1999
1,140
2,329
889
699
3,422
859
520
9,858
2000 - 2009
1,849
3,982
2,009
1,999
4,593
1,670
778
16,880
2010 or later
5,212
6,587
6,841
3,810
6,040
1,712
984
31,186
Total
9,113
14,346
11,046
6,946
16,389
4,954
2,610
65,404
African Immigrants in Prince George’s County • Page 5
African Immigrants Table 4. African Immigrants by African Region by PUMA, 2024 and 2010 PUMA 01101
PUMA 01102
PUMA 01103
PUMA 01104
PUMA 01105
PUMA 01106
PUMA 01107
County
2024
8,824
14,438
10,596
6,344
14,363
4,465
2,413
61,443
Eastern Africa
2,654
1,467
1,570
752
707
898
555
8,603
Middle Africa
2,029
3,297
1,873
1,402
3,080
747
209
12,637
Northern Africa
286
191
56
38
494
181
104
1,350
Southern Africa
79
0
121
0
116
20
64
400
Western Africa
3,451
9,155
6,835
4,138
9,881
2,601
1,335
37,396
325
328
141
14
85
18
146
1,057
2010
7,922
9,196
7,005
2,059
9,189
2,184
1,334
38,889
Eastern Africa
1,648
1,278
994
271
700
642
580
6,113
Middle Africa
1,665
1,205
717
213
553
29
32
4,414
Northern Africa
38
299
127
30
32
24
36
586
Southern Africa
56
18
11
0
48
0
0
133
Western Africa
3,522
5,745
4,181
1,326
6,944
1,275
519
23,512
993
651
975
219
912
214
167
4,131
Africa, not elsewhere classified
Africa, not elsewhere classified
Table 5. Top Five African Nations of African Immigrants by PUMA, 2024 and 2010 PUMA 01101
PUMA 01102
PUMA 01103
PUMA 01104
PUMA 01105
PUMA 01106
PUMA 01107
2024 1.
Ethiopia
1,570 Nigeria
2.
Cameroon 1,546 Cameroon 3,172 Cameroon 1,716 Cameroon
3.
Nigeria
707 Ghana
4.
Sierra Leone
659
5.
Togo
Sierra Leone
4,388 Nigeria
2,118
Sierra Leone
4,274 Nigeria
1,059 Kenya
3,051 Nigeria
6,047 Nigeria
1,036 Nigeria
440
965 Cameroon 3,030 Ghana
754 Ethiopia
373
687 Ghana
344
350
Sierra Leone
1,402 Cameroon Sierra Leone
1,455 Ethiopia
841 Ethiopia
255 Ghana
770
400 Cameroon 187
406 Ethiopia
995 Ghana
533 Senegal
238 Liberia
633 Ethiopia
1.
Cameroon 1,478 Nigeria
3,178 Nigeria
2,294 Nigeria
857 Nigeria
4,133 Nigeria
851 Ethiopia
510
2.
Ethiopia
1,054 Cameroon 1,191
Sierra Leone
1,099 Ethiopia
416 Ghana
215
3.
Nigeria
1,023
4.
Sierra Leone
5.
Ghana
380
Ivory Coast
131
2010
Sierra Leone
Sierra Leone
797
Sierra Leone
267
1,051 Cameroon
550 Cameroon
171 Liberia
665 Ghana
265 Nigeria
135
783 Ghana
998 Ghana
534 Ethiopia
98 Ghana
562 Kenya
139 Liberia
109
614 Ethiopia
383 Ethiopia
360 Ghana
59 Cameroon
455
Sierra Leone
116 Kenya
49
Page 6 • African Immigrants in Prince George’s County
Prince George’s County Planning Department
The largest absolute increases of African immigrants were in PUMAs 01102 and 01105, while PUMAs 01104 and 01106 recorded the highest growth rates (Table 2). In PUMA 01105, African immigrants composed the largest share of the foreign-born population in 2010 and 2024. African immigrants live throughout the County, as shown in Map 2, with concentrations in the northern and eastern areas. Overall, the County’s African immigrants are relatively recent arrivals and increasingly diverse in their nations of origin. More than 88 percent arrived in the United States in or after 1990, as shown inTable 3. The Census Bureau defines the year of entry as “the year in which people born outside the United States came to live in the United States.” Most African immigrants in the County are from Western African nations, with concentrations in PUMA 01105 and PUMA 01102 in 2010 and 2024, as shown in Table 4. The top nation of origin for African immigrants in the County is Nigeria, as shown in Tables 5 and 6. African immigrants from other nations, such as Cameroon, Ghana, Sierra Leone, and Ethiopia, are also emerging.
Prince George’s County Planning Department
Table 6.
TOP 5
African Nations of Origin of Prince George’s County Residents
IN 2024 Nation
Population in County
1. Nigeria
19,943
2. Cameroon
11,303
3. Sierra Leone
5,200
4. Ghana
5,139
5. Ethiopia
4,618
IN 2010 Nation 1. Nigeria
Population in County 12,471
2. Sierra Leone
4,141
3. Cameroon
3,896
4. Ghana
3,247
5. Ethiopia
3,081
African Immigrants in Prince George’s County • Page 7
African Immigrants Superb Educational Attainment The share of African immigrants in the County who hold a bachelor’s degree continues to grow. In 2010, this group already outpaced the County average for bachelor’s degree or higher (Table 7 and Figure 1). In 2024, all but one PUMA have educational attainment levels that exceed the County level of 37.6 percent, particularly PUMAs 01105 and 01107, where more than 50 percent of African immigrants age 25 and older hold a bachelor’s degree or higher.
Various Homeownership Rate Tenure refers to the distinction between owneroccupied and renter-occupied housing units, as defined by the Census Bureau. Occupied housing units are considered households. The homeownership rate is the percent share of owner-occupied housing units among all occupied housing units. The homeownership rate for African immigrants fell from 60.9 percent in 2010 to 55.5 percent in 2024, noticeably lower than the County rate (Table 7 and Figure 1). Homeownership rates varied by location. PUMA 01106 continues to have the highest rate among and remains considerably above the County level. PUMAs 01101 and 01106 were the only two areas where the rate increased from 2010 to 2024. Available data are insufficient to establish a correlation between low homeownership rates and the recent arrival of African immigrants in the County. Similar to overall County patterns, the homeownership rate is high outside the Beltway and relatively low inside the Beltway, where there is a large concentration of renter-occupied housing units or households, as analyzed and discussed in The Housing Cost Study for Prince George’s County, published in early 2026.2
2
HOUSEHOLD INCOME DATA Because of the small data sample, household income estimates are available for only some African nations of origin. Comparisons and conclusions should be conducted with caution.
Notably High Household Income The exceptionally high household incomes of many African immigrants may be attributable to their strong educational backgrounds. In most PUMAs, the average household income for African immigrants exceeds the County average. Although average household income declined in PUMAs 01104 and 01106 between 2010 and 2024, income levels remain substantially high (Figure 1 and Table 7). Table 7 displays the “average of household income” (as defined by the Census Bureau) by PUMA for 2010 and 2024 and adjust the 2010 income using the Consumer Price Index (CPI). It is standard practice among scholars, economists, and other data users to use CPI to adjust dollar-denominated values before comparing data across different periods.
Strong English Proficiency At least one person in 93 percent of African immigrant households speaks English very well, or it is their only language, according to Table 7 and Figure 1. Across the County, African immigrants in households where no one aged 14 or older speaks English only or very well are largely from Ethiopia, Nigeria, Cameroon, Ghana, and Sierra Leone, due to their population size. However, data are not available for some African immigrant groups in the County due to the small population size.
https://www.pgplanning.org/wp-content/uploads/2026/01/2025_Housing-Cost-Study-1.pdf
Page 8 • African Immigrants in Prince George’s County
Prince George’s County Planning Department
01102 01101
Figure 1. A Snapshot of African Immigrants Across Prince George’s County as of 2024
01103 01105 01104 01107
01106
Prince George’s County Planning Department
African Immigrants in Prince George’s County • Page 9
African Immigrants Conclusion Prince George’s County has the third-largest African immigrant population in the nation, growing 58 percent since 2010, and largely concentrated in the northern and eastern portions of the County. Today, one in four foreign-born residents originates from an African country. Nigeria remains the leading nation of origin, while Cameroon, Ghana, Sierra Leone, and Ethiopia also contribute to the County’s diversity. African immigrants in Prince George’s County demonstrate notable socioeconomic strengths, including high levels of educational attainment, strong English proficiency, and generally high household incomes. Their homeownership rates vary geographically, reflecting overall County patterns. These findings underscore that African immigrants are an integral part of Prince George’s County’s social and economic fabric, contributing significantly to the County’s continued population growth, racial and cultural diversity, and economic prosperity.
CELEBRATE AFRICA The Prince George’s County Government and The MarylandNational Capital Park and Planning Commission will jointly host the annual Celebrate Africa Festival during Federal African Heritage Month in September. The festival recognizes African immigrants’ contributions to the County and the Washington, D.C., metropolitan region while showcasing cultural vibrancy and diversity through art and other creative works.
PRINCE GEORGE’S COUNTY DEPARTMENT OF PARKS AND RECREATION
Page 10 • African Immigrants in Prince George’s County
Prince George’s County Planning Department
Table 7. African Immigrant Communities by PUMA: Education, Homeownership, Language, and Income, 2010 and 2024 PUMA 01101
PUMA 01102
PUMA 01103
PUMA 01104
PUMA 01105
PUMA 01106
PUMA 01107
County
Educational Attainment 2010 Total Population 25 Years Old and Over
6,028
8,401
5,642
1,941
8,566
2,182
1,000
558,007
Bachelor’s degree or higher
1,773
3,551
1,583
477
3,744
973
374
163,904
Bachelor’s degree
1,261
2,155
891
259
2,357
519
374
95,118
Master’s degree
300
822
410
204
1,078
288
0
51,257
Professional school degree
96
380
232
14
207
87
0
9,792
Doctorate degree
116
194
50
0
102
79
0
7,737
29.4%
42.3%
28.1%
24.6%
43.7%
44.6%
37.4%
29.4%
Total Population 25 Years Old and Over
8,628
14,075
10,662
6,458
16,209
4,850
2,556
667,226
Bachelor’s degree or higher
3,312
6,534
3,237
2,790
8,568
2,298
1,299
250,544
Bachelor’s degree
2,106
3,676
2,031
1,884
4,183
1,138
762
133,836
Master’s degree
837
1,857
883
745
3,545
877
384
86,724
Professional school degree
105
407
283
118
457
0
71
13,915
Doctorate degree
264
594
40
43
383
283
82
16,069
38.4%
46.4%
30.4%
43.2%
52.9%
47.4%
50.8%
37.6%
Owner-Occupied
1,360
5,468
1,799
1,140
7,947
2,052
618
189,330
Renter-Occupied
4,613
2,767
3,843
801
565
130
382
112,593
Homeownership Rate
22.8%
66.4%
31.9%
58.7%
93.4%
94.0%
61.8%
62.7%
Owner-Occupied
2,866
7,405
3,101
3,398
13,081
4,931
1,401
216,692
Renter-Occupied
6,133
6,932
7,926
3,544
3,303
23
1,209
131,052
Homeownership Rate
31.8%
51.6%
28.1%
48.9%
79.8%
99.5%
53.7%
62.3%
% of Population 25+ with Bachelor’s+ 2024
% of Population 25+ with Bachelor’s+ Tenure and Homeownership Rate 2010
2024
Limited English Proficiency (Members in Households 14 Years Old and Over) 2010 1+ person speaks English only/very well
5,506
7,590
5,370
1,912
7,983
2,039
991
31,391
No one speaks English only or very well
467
645
272
29
529
143
9
2,094
1+ person speaks English only/very well
7,017
12,965
9,572
6,551
15,624
4,972
2,227
58,928
No one speaks English only or very well
1,197
1,001
1,138
165
510
198
300
4,509
2010
$53,248
$87,656
$68,057
$92,967
$104,893
$128,858
$68,357
$85,275
2010 CPI Adjusted to 2024 Value
$76,845
$126,501
$98,216
$134,165
$151,376
$185,962
$98,650
$123,065
2024
$116,109
$126,528
$110,147
$126,763
$168,251
$148,459
$106,465
$125,138
$39,264
$27
$11,930
-$7,402
$16,875
-$37,503
$7,815
$2,073
2024
Average of Household Income
Change, 2010 (Adjusted) and 2024
Prince George’s County Planning Department
African Immigrants in Prince George’s County • Page 11
African Immigrants Acknowledgments SENIOR MANAGEMENT TEAM James R. Hunt, MPA Gwen McCall-Winston Katina Shoulars James Cannistra, C.P., GISP
Acting Planning Director Deputy Director of Administration Acting Deputy Director of Operations Division Chief, Information Management
PRODUCTION TEAM Kui Zhao, AICP
Planning Supervisor
William Lescure, GISP
Senior GIS Specialist
Emma Walker Xuedi Yan
Planner II Intern II, University of Maryland
PUBLICATIONS TEAM Carly Brockinton
Public Affairs and Marketing Specialist II
PRINCE GEORGE’S COUNTY DEPARTMENT OF PARKS AND RECREATION
Page 12 • African Immigrants in Prince George’s County
Prince George’s County Planning Department