39 minute read
Section 1. Background

from W11P169
by PDF Uploads

Section 1 : Table of Contents
1. Site Overview 2. Demographics 3. Historical Background 4. Natural Environment & Sustainability 5. Crime 6. Socioeconomic Dimensions 7. Health & Wellbeing 8. Transportation & Movement 9. Current Land Use & Ownership 10. Public Spaces & Activities 11. Planning & Policy Context 12. Linkage Analysis 13. Conclusion
Section 1 : Background
Wood Green is located in the north of London in the borough Haringey and the proposed area of intervention is located primarily in the ward of Noel Park with a small portion of the northern extent in the ward of Woodside (see figure 1.1.1).
The intervention area has an irregular shaped perimeter of approximately 2 miles and area of approximately 30 hectares. This area captures a dense concentration of commercial activity along and near to High Road (A105) and which forms the primary economic centre of Wood Green and the surrounding wards (as shown in Figure 1.1.2). High Road runs through approximately 0.6 miles of the site from the south-east to the northwest. The composition of these commercial areas are covered in greater detail in the following sections.
Areas containing primarily residential activities are located to the north, east, and south of the intervention area. A formerly industrial area undergoing regeneration is located immediately to the west called Haringey Heartlands. This development comprises 1,700 homes, open space, and employment facilities and has received planning permissions from Haringey Council (Haringey Council 2018). A National Rail Line is located to the north of Haringey Heartlands and the intervention area and runs from the south-east to the north-west.
Figure 1.1.1: Location overview (Author, 2020)
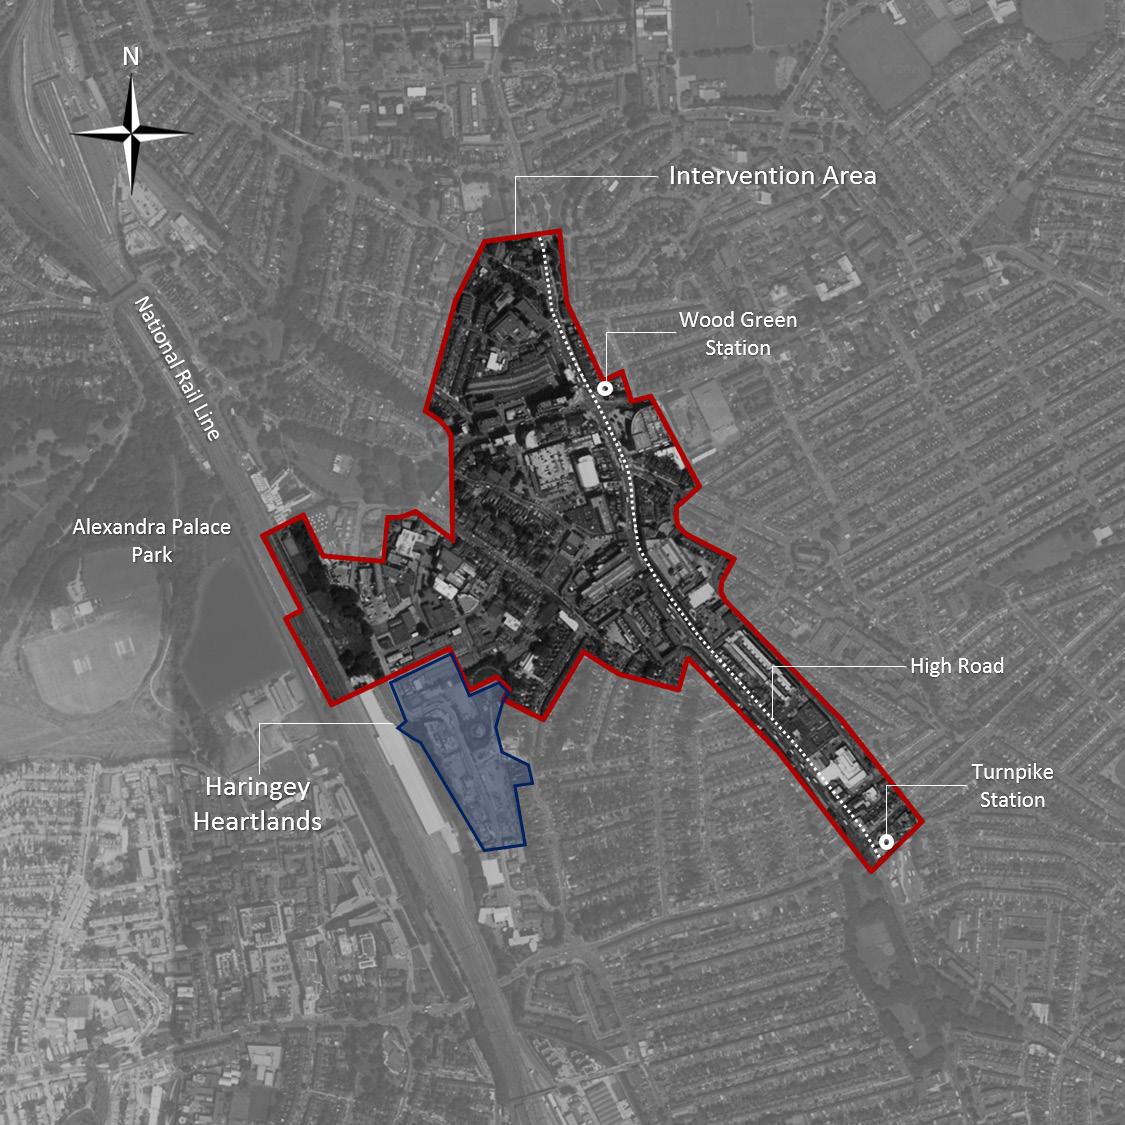
Figure 1.1.2: Site detailed overview (Author, 2020)
2. Demographics
Overview
To understand the area, the first thing is to understand its population structure. Population in Haringey is young, and according to current projections, this trait will continue for the next ten years. Although the percent of people over 65 is projected to grow more than any other age demographic, the majority of the population will still be comprised of people of working age (Noel Park Ward Profile, 2019). Haringey is also an ethnically diverse area and its proportion of non-English speaker is the third largest of in all the London boroughs. In terms of religion, Haringey is dominated by Christianity and quarter of residents identify themselves as having no religion. Wood Green is identified as one of the metropolitan centres in Greater London (GLA, 2016) and is the core of Haringey, whose demographic status is in line with the borough average to some degree .
Current status
Wood Green’s population had reached to 28,453 residents and 11,229 households by 2017 and population growth in Wood Green is the highest in the entire borough in last decades (HC, 2016) , 24% between 2001-2011 and over 10% after 2011 (as shown in Figure1.2.1). The site is mostly located in Noel Park Ward, the southern part of Wood Green, whose population reached to 15,161 in 2017 and its population structure is in line with the Haringey borough, which means Noel Park Ward has a young and diverse population. People aged in 20-44 are the majority in the ward (47.8%) and over 90% of the population are aged under 65 (as shown in Figure 1.2.2). Though also being a multi-ethnic area, the ward has a higher proportion of population in the group of White Other compared to the borough (as shown in Figure 1.2.3). Residents born in foreign countries are mostly from Turkey and Poland, which also mirrors in the most popular foreign languages. In line with the brough, there are large proportions of Christians (45%) and atheists (20%) in this area and a Muslim population (19.1%) larger than borough average (as shown in Figure1.2.4).
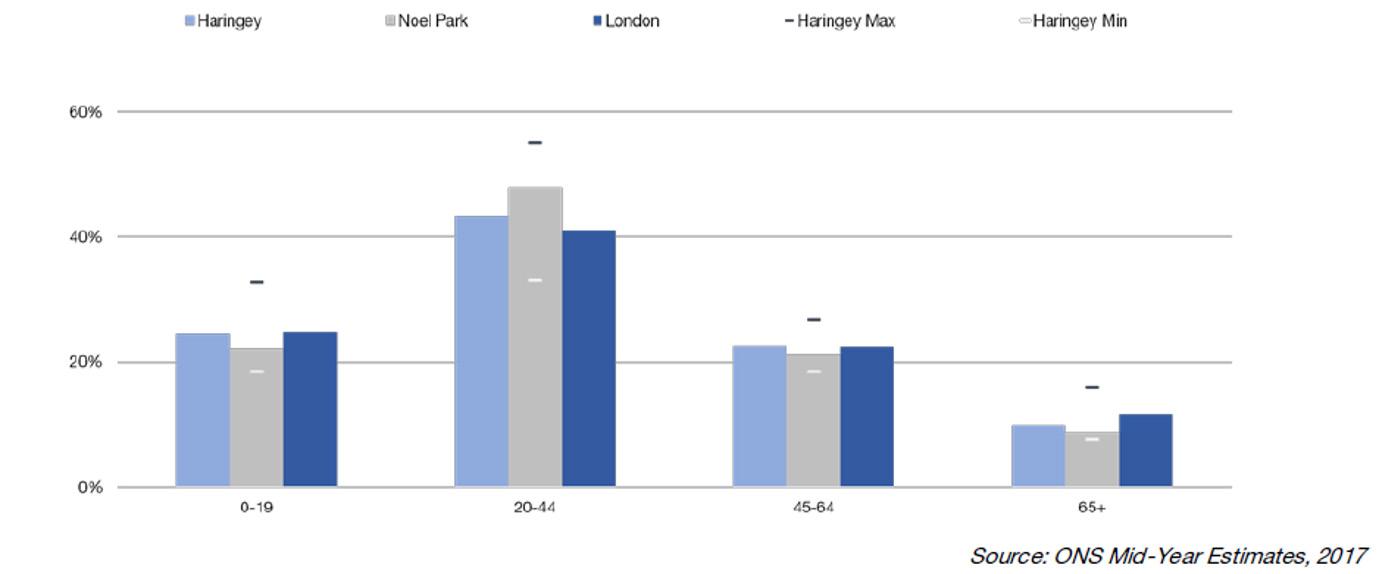
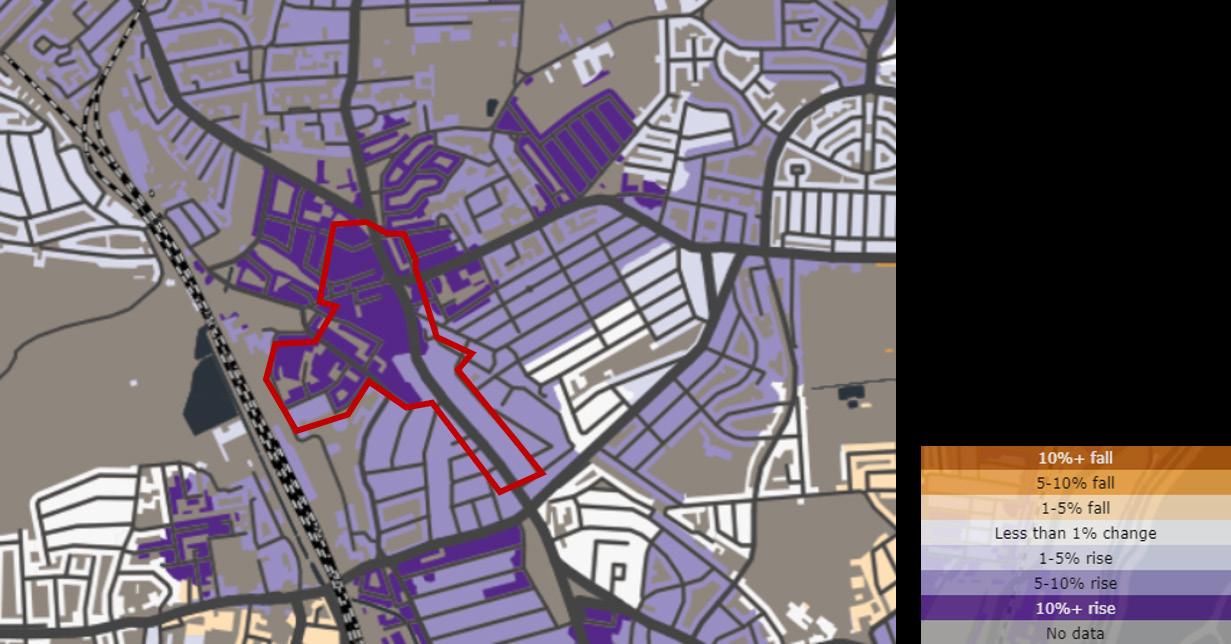
Figure 1.2.1: Population rose by more than 10% in Wood Green in last decade (CDRC Maps, 2020) Figure 1.2.2: The Noel Park Ward has an under-represented population aged over 65 and people in working age are the majority (Noel Park Ward Profile, 2019).
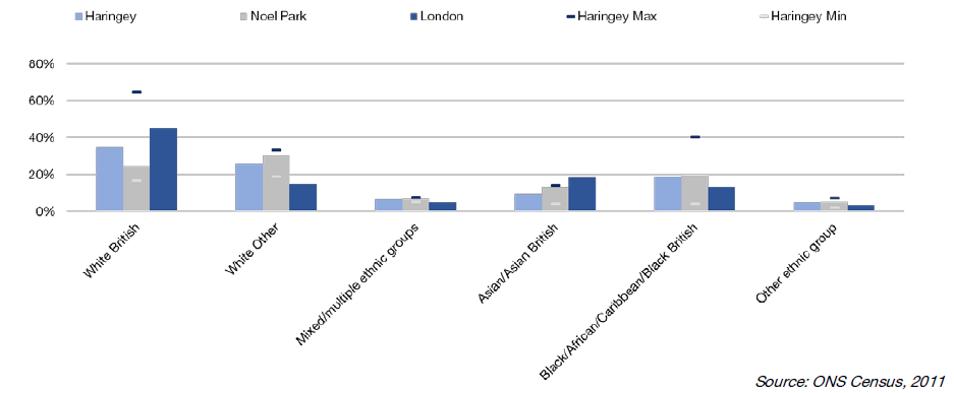
Figure 1.2.3: The major ethnic group in Noel Park is the White Other group.(Noel Park Ward Profile, 2019).
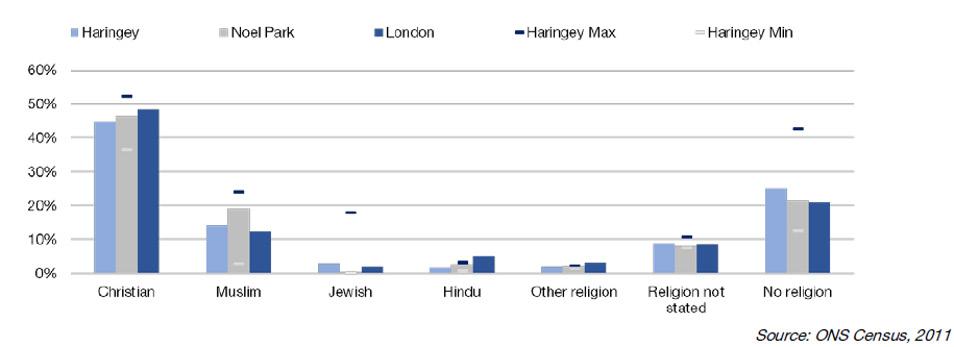
Figure 1.2.4: Proportion of Muslim in Noel Park is larger than borough average(Noel Park Ward Profile, 2019).
London comparison
Noel Park has a larger population and population density (15,161; 12,683per sq.km) than the London average (13,854; 8894 per sq.km). However, the age demographics of Haringey and London are similar, with a larger proportion (47.4% in Noel Park, about 40% in London) in people aged between 20 to 44 and less proportion (8.8% in Noel Park, about 11% in London) of old people aged over 65. Also, Noel Park has larger group of White Other (nearly 30%) and Muslim (19.1%) than London (less than 20%; around 10%).
Diagnosis
A relatively large population in the district and a young population structure means opportunities to develop and a vibrant economy, but also a pressure to ensure adequate housing, public well-being and employment are provided to residents. Similarly, though helping area create and develop rich cultural and economic resources, cultural and ethnical diversity bring the challenge of social exclusion and ethnical conflicts, which may damage connections between residents and safety in the area.
3. Historic Background
Overview
Wood Green became a settlement after the Norman Conquest (Pinching, 2000) and remained a small town until late 19th century (as shown in Figure 1.3.1). The rise of Wood Green was accompanied by the public infrastructure construction. After the construction of New River, several properties were built in the area and the construction and operation of Great Northern Railway in 1895 and the Palace Gate Line in 1878 brought more opportunities for development and more population to this area (as shown in Figure 1.3.2). Also, a tramway was built along the High Road and Station Road in 1890s and 1900s (as shown in Figure 1.3.3). In the same period, a tramway depot was built, which transformed into a trolleybus depot after the demolition of tramway in 1950s (as shown in Figure 1.3.4).
Wood Green’s city history started in 1894 when it was first created as an urban district. After it merged into Haringey Borough in 1965 , Wood Green was expected to be the centre of Haringey and many new constructions were built in the area.
Current state
As Wood Green developed, the Palace Gate Line across the area declined and was replaced by the complex and some residential buildings because of its lost in the competition with the Great Northern Line and the construction of Piccadilly Line (as shown in Figure 1.3.5 and Figure 1.3.6). The tramway built along the main street was removed and depot was transformed into a bus hub.
Historical development of economy in Wood Green.
Wood Green has finished its transformation from an agricultural field to an industrial area and then to a commercial city centre and a comprehensive community. Retailing in the area thrived after 1960s along the High Road and Wood Green became a concentration of retailers. Moreover, exploration and attempts to develop the new industries also emerge in the area. For example, the Blue House Yard is a redevelopment site creating studio spaces with fair rents to encourage local creatives and entrepreneurs.
Long history in the area also left an abundant legacy in terms of heritage and cultural resources. Currently, there three conservation areas in Wood Green: Wood Green Common, Trinity Garden and the Noel Park, highlighting the rare open green spaces, quaint religion buildings and Victorian housing in this area (as shown in Figure 1.3.7).
Figure 1.3.1: Wood Green 1870s: most areas are undeveloped (Digimap, 2020)
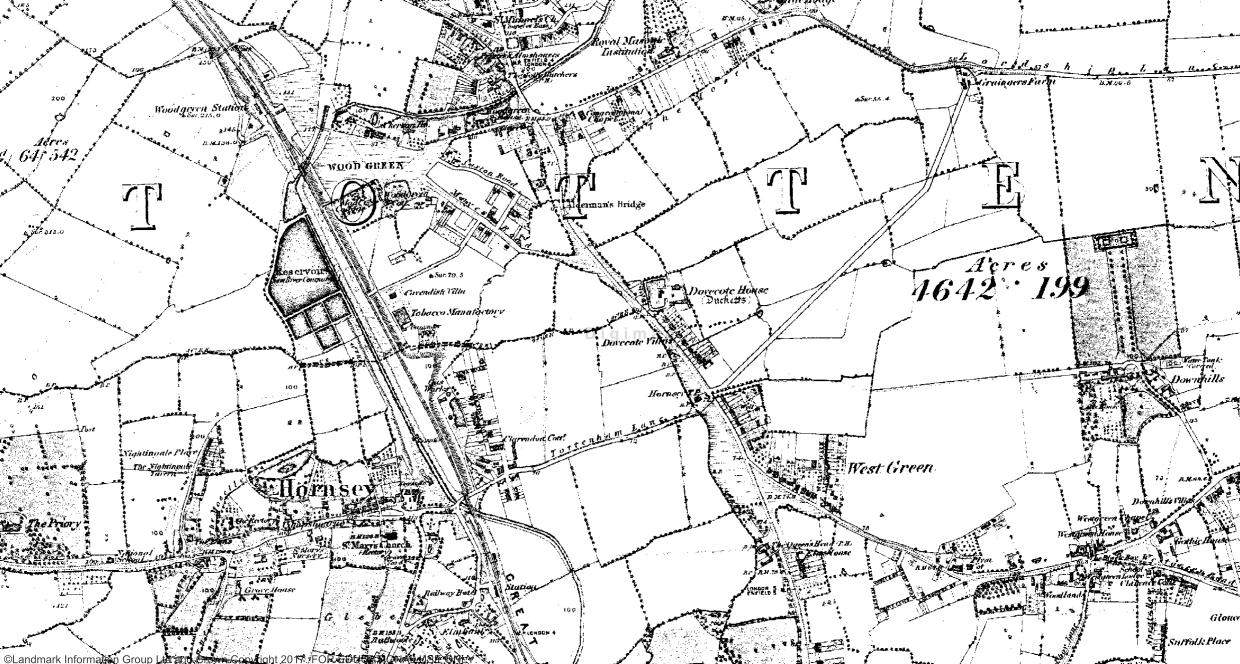
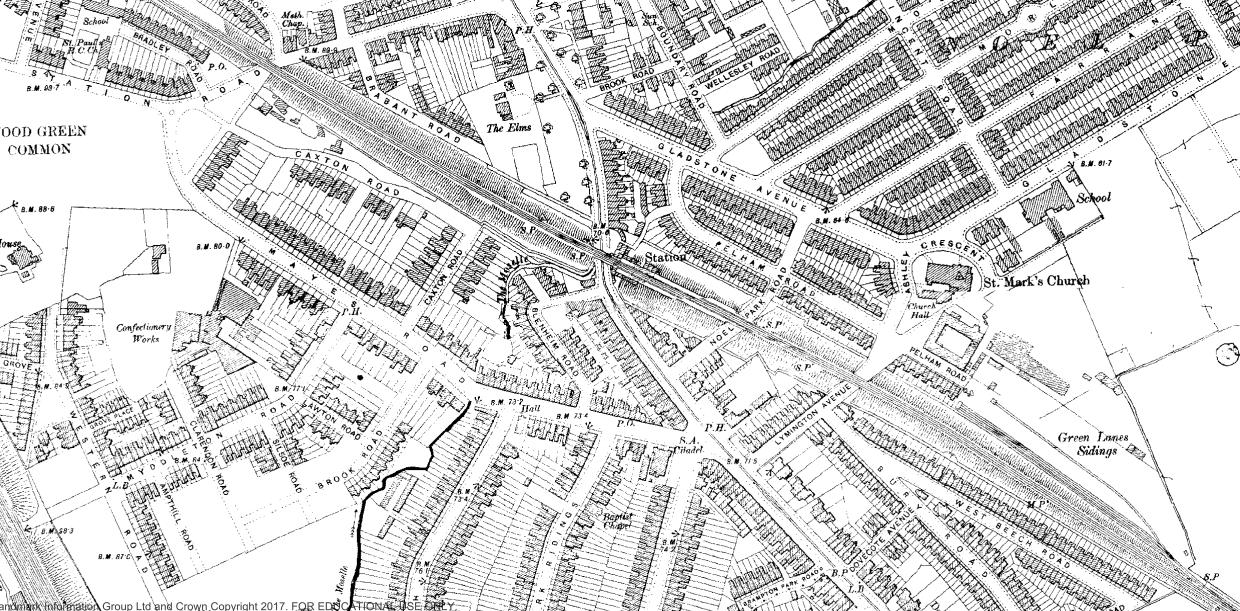
Figure 1.3.2: Wood Green 1890s (Digimap, 2020)
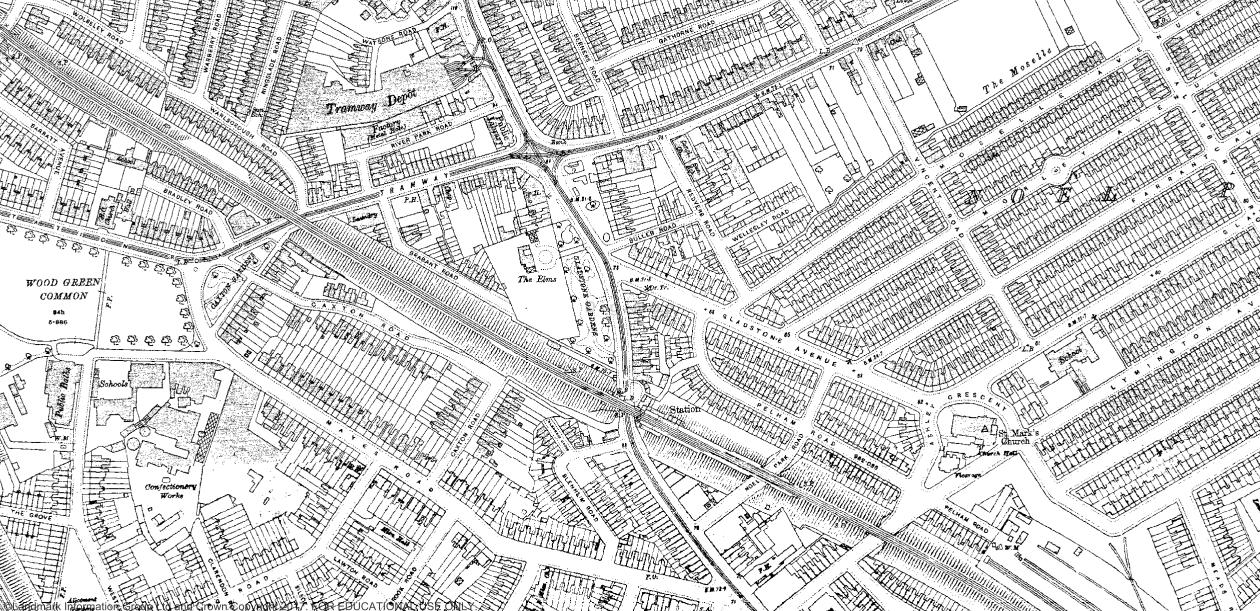
Figure 1.3.3: Wood Green 1910s: Trams and railway contributed to the townscape; industrial area emerged in the southwestern area. (Digimap, 2020)
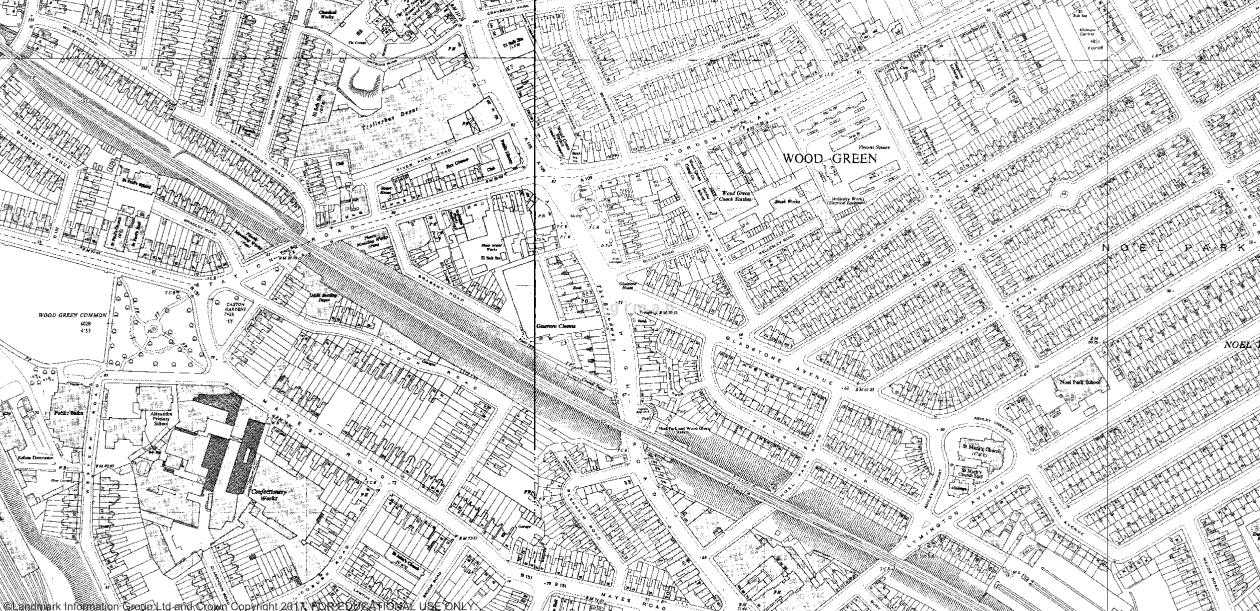
Figure 1.3.4: 1950s: Tramway removed from the street; Noel Park estate completed (Digimap, 2020)
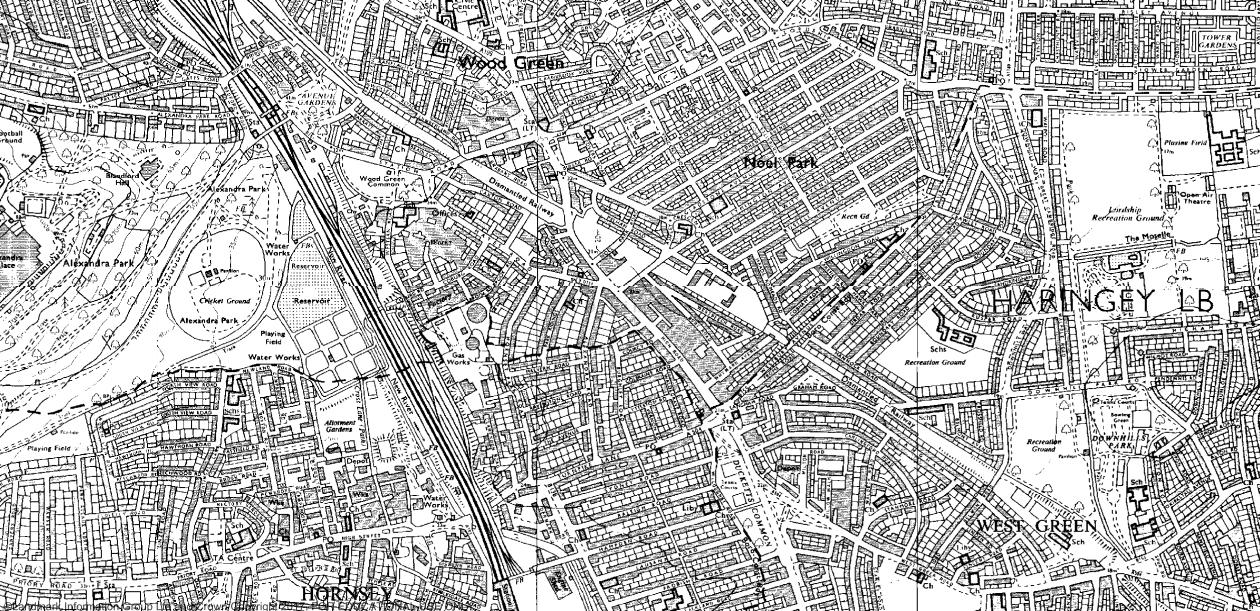
Figure 1.3.5: Wood Green 1970s: railway was dismantled (Digimap, 2020)
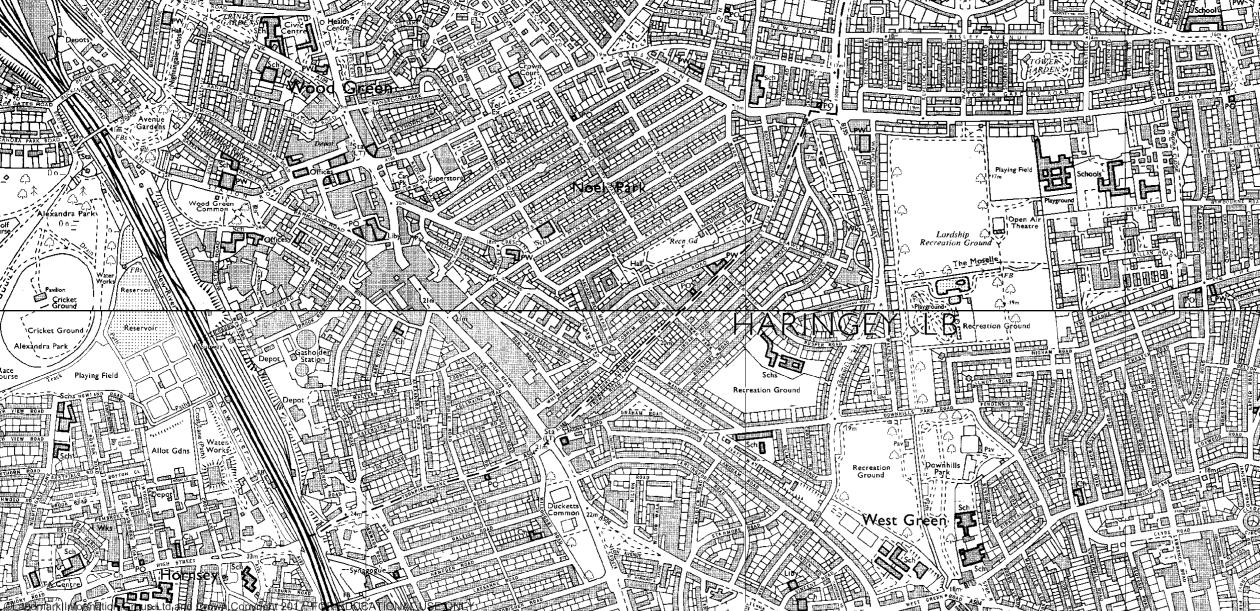
Figure 1.3.6: Wood Green 1990s: Big mall and social housing were built on the former railway (Digimap, 2020)
The site, surrounded by these conservation areas, includes several local listed buildings in its western part and a listed building in its centre (as shown in Figure 1.3.8).
London Comparison
Compared to surrounded area, Wood Green had become a small town when its neighbourhood was still undeveloped land. Although established in 1894, Wood Green rapidly developed in the late 19th century. Large amounts of workers and new developments were introduced by the railway from central London, which is highly industrialised and developed the area.
Diagnosis
The cultural and historic background of Wood Green provide it with abundant cultural resources and there are opportunities for improving education, framing community imagination and strengthening social ties related to these assets. However, there are also some sites in the area suffering due to the transformation of its economic base and the heavy car-oriented transportation, especially the industrial area in the west part of the site and buildings surrounding the bus depot. Since Wood Green has become a centre of retailing, people around the borough drive to the town centre for daily shopping or leisure, and the industrial past of the area was eventually forgotten. Many factories or industrial buildings became vacant or moved out and the huge demand on transportation makes the large bus depot remain in the town centre, which leads to the inefficient land use in the area.
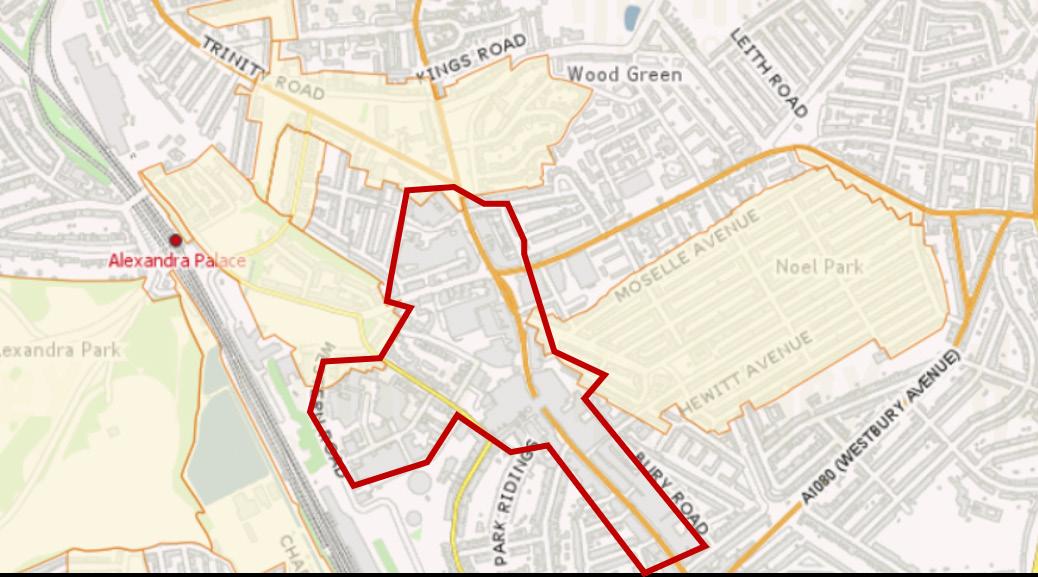
Figure 1.3.7: Conservation area in Wood Green and the site boundary (Haringey Council, 2019)
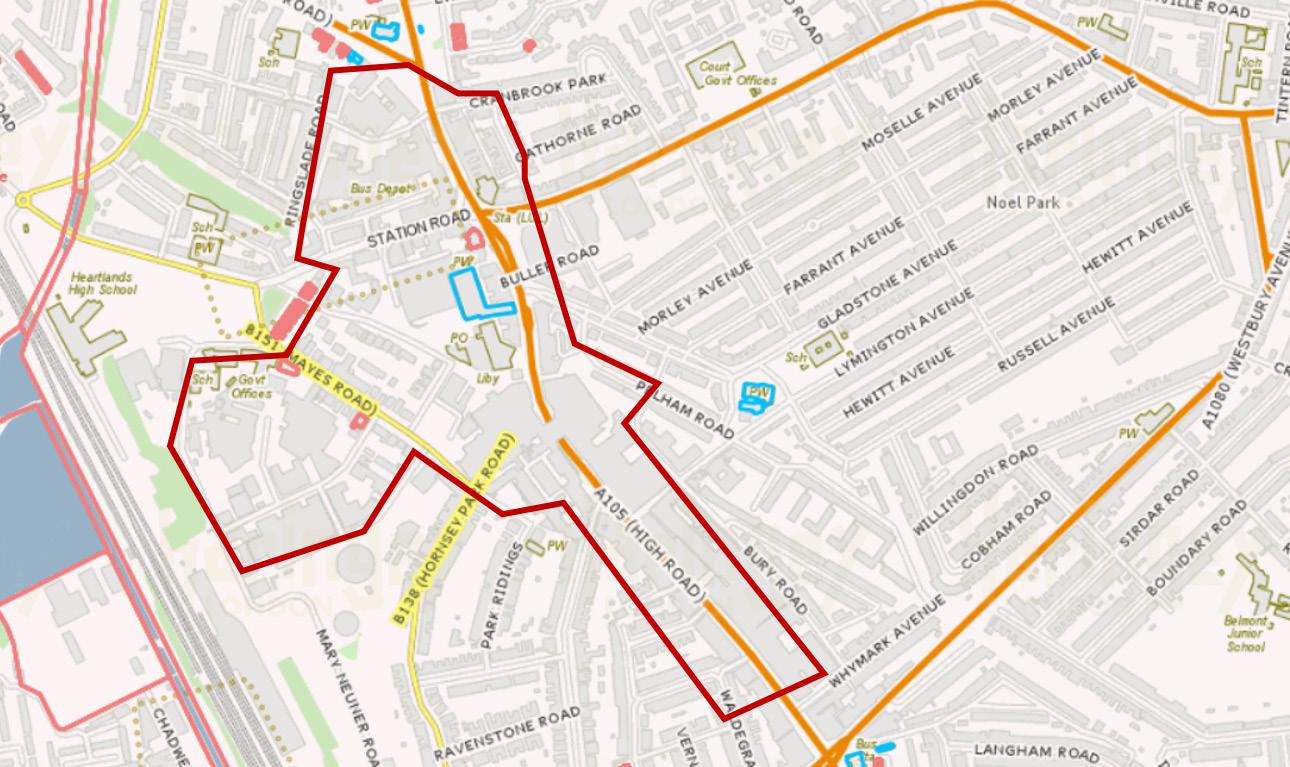
Figure 1.3.8: Listed (blue) and locally listed (pink) buildings in the site (Haringey Council, 2019)
4. Natural Environment and Sustainability
Overview
Located in north London, Haringey which stretches from the panoramic views from Muswell Hill and High gate in the west through to the open plains of the Tottenham Marshes in the east. Although Haringey is essentially a very urban borough, at the same time, it takes pride in managing areas of outstanding nature conservation such as Alexandra Park and Finsbury Park, made up of a wide range of habitats playing host to a remarkable variety of wildlife. Haringey recognises that the environment is the defining issue for this generation and is changing now. It places long term solutions that will protect the built and natural environment and encourage biodiversity - securing sustainable development (HaringeyCouncil, 2008).
Current state
Haringey has many public parks and open spaces, including the most notably Alexandra Park in the middle of the borough, and Finsbury Park in the south. Broadly speaking, accesses to metropolitan parks in Haringey is very good, while those to the local, small or pocket parks and district parks is less good. However, there is substantial variation in the amount of open space in different wards. Especially Wood Green, the accessibility to nature is relatively worse than Haringey (Haringey Council, 2019:45). The project site has a lower portion of nature and open spaces than both Haringey and Wood Green but close to Alexandra Park and has a linkage through a small tunnel.
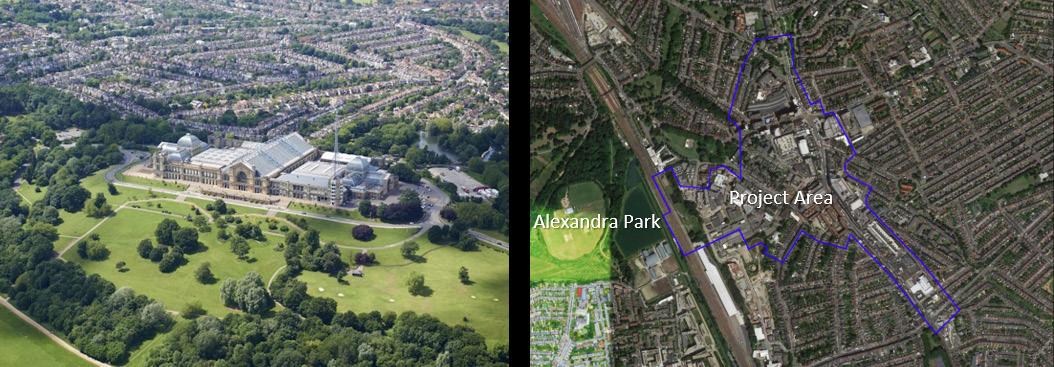
Figure 1.4.1: Alexandra Park and Project Area In a view of sustainability, Haringey is striving to become one of London's greenest boroughs. Its environmental strategy, the Greenest Borough Strategy sets out how the Council will deliver a wide range of activity designed to create a 'Greener Haringey’, tackle climate change and embed environmental sustainability into everything. Haringey's Greenest Borough Strategy 'Going Green' was also adopted and officially launched on 20 October 2008 (Haringey Council, 2020).
Haringey is conducting a Going Green policy which is promoting sustainability with a reducing environmental impact and empowering local community. CO2 emission reduced noticeably but air pollution is similar to London and the Project site is particularly higher than the other areas.
Figure 1.4.2: The air pollution of Haringey (Source: Haringey Council) London comparison
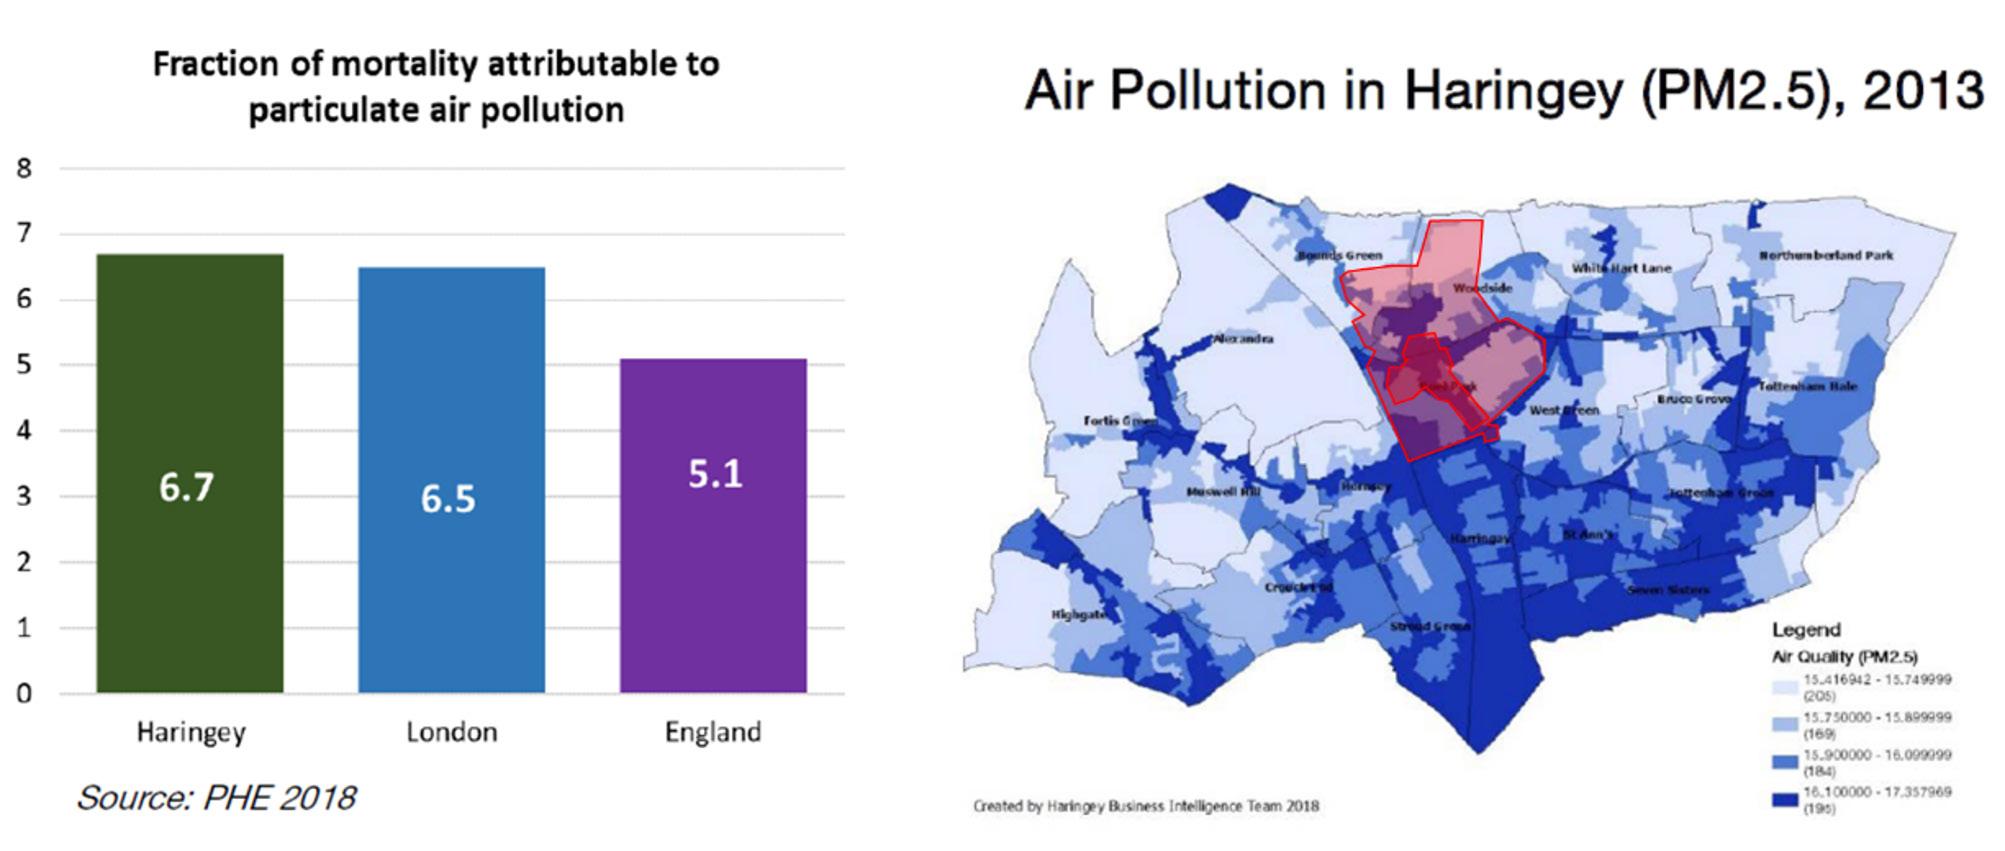
For the view of the natural environment, Haringey has less green and open spaces than London but the accessibility to green spaces is relatively good. Due to the efforts such as the Going Green policy, the CO2 emission is decreased gradually and now is the third lowest, while the air pollution with PM2 is similar to London. 27.8% of Haringey is made up of open space compared to average of 33% for London Haringey has the third lowest carbon emissions per capita among its neighbouring boroughs, just above Waltham Forest with 2.5 tons of CO2. This is substantially below the Greater London (3.3) and England levels (4.5). The rate of fraction of mortality attributable to particulate air pollution in Haringey is 6.7% which is similar to London’s 6.5 and higher than 5.5% of England (Haringey Council, 2019:41).
Diagnosis
Haringey needs to enhance local, small and pocket parks and also the accessibility to them also require improvement. To relate to the environmental issue, although many efforts, living litters and air pollution of the specific area should be more reformed
Overview
Crime has clearly negative impacts on its victims, but it might also cause considerable harm to other local people who fear being victims in the future. Cornaglia and Leigh argued (2011) that for victims and non-victims, as well as the effects of crime reporting by local media, it is plausible that an even larger cost of crime occurs via its indirect impact on the mental wellbeing. They suggested that increases in crime rates have a negative impact on the mental wellbeing of residents, with the biggest impacts arising from violent crime.
Current state
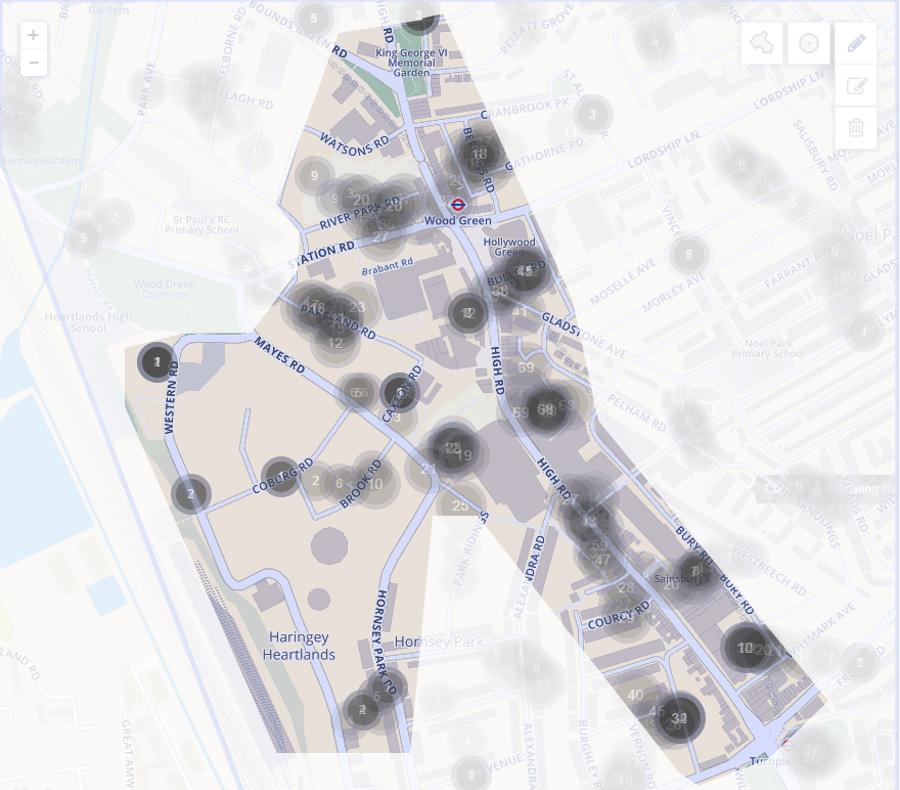
In 2019, Haringey had the third-highest crime rate in London. It led the residents to recognise crime (include antisocial behaviour) is the most dislike about living and many of them are scared of going out at night. Anti Social Behaviour and violent crime are the dominant crime types and also the high rate of youth delinquency is still a big problem. So, the borough gives efforts to reduce crime and anti social behavior by improving the security of public environment and community-enhancing as well as family education and community-enhancing to reduce youth crime. Locally, high rates of crime around large malls and on High road and the anti-social behaviour and drug use are relatively evenly distributed in the project site (Haringey Council, 2019:33). Figure 1.5.1: The analysis of high crime rate area in Wood Green (Source: police.uk) iour) is the most dislike about living in Haringey, but the crime rate of the project site is slightly decreased Efforts to reduce crime by improving security of public environment and community-enhancing Efforts to reduce youth crime through policies that family education and community-enhancing
London Comparison
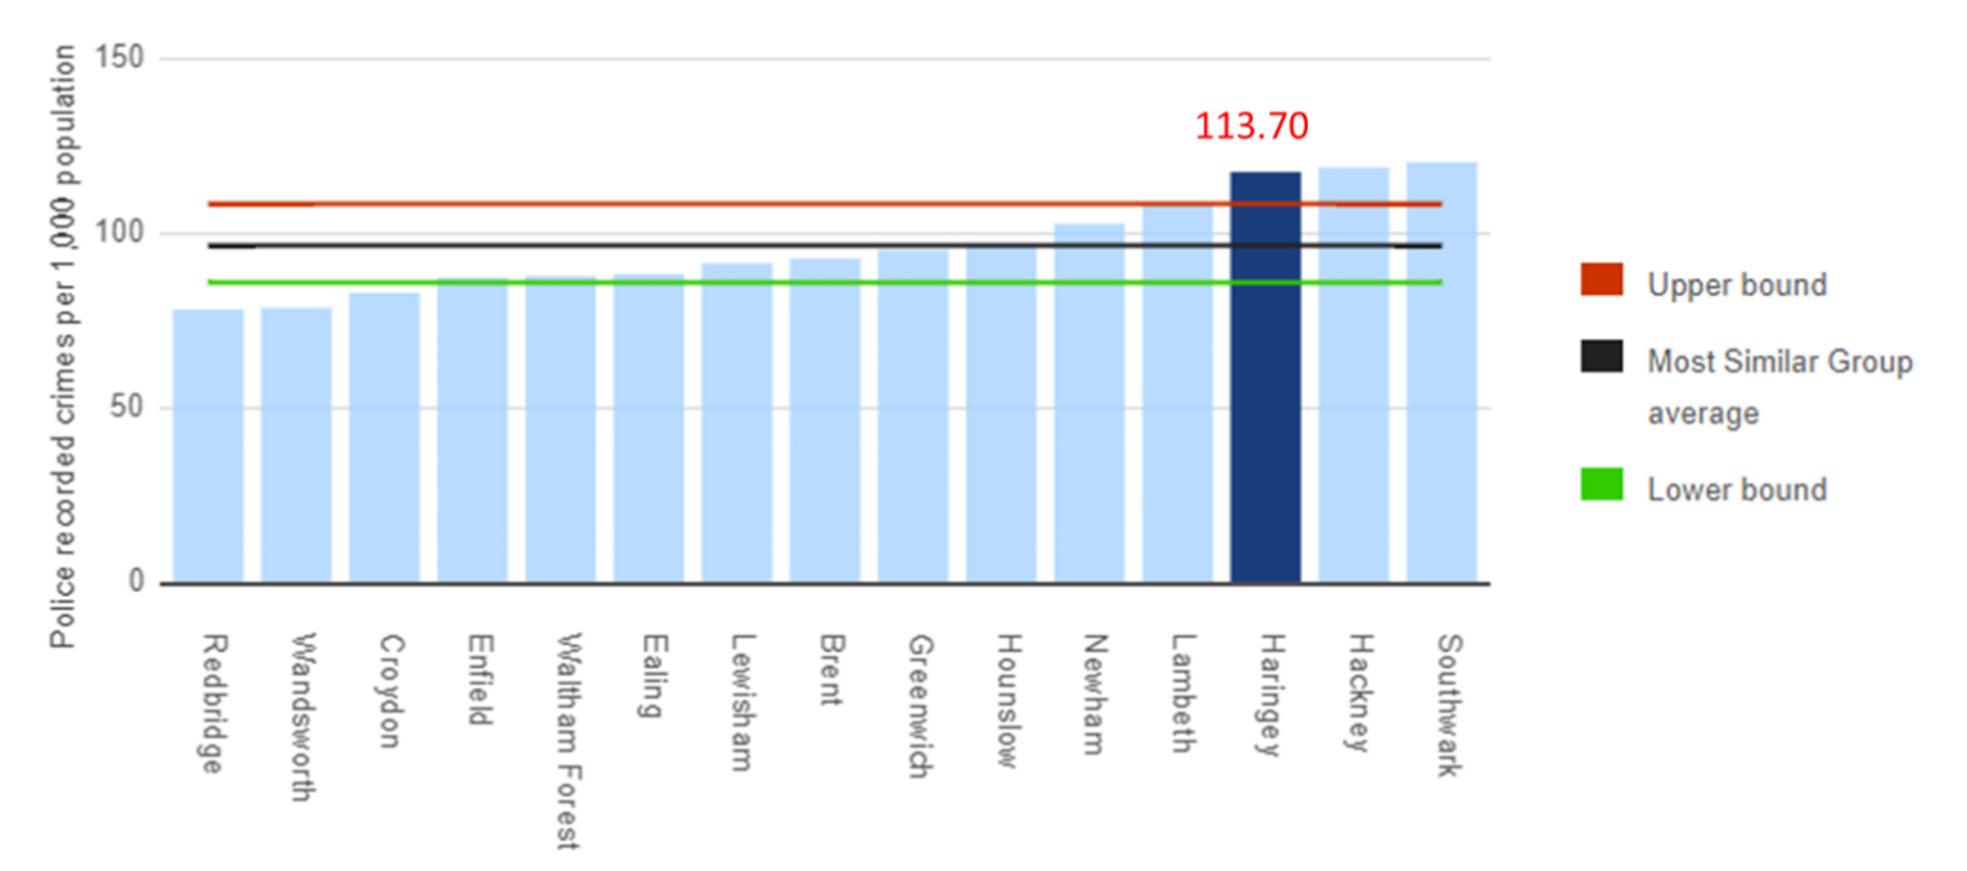
As mentioned above, Haringey shows 113.7 crimes per thousand residents which ranked the third in 2019. It makes the lowest portion of residents agree with that police contribute the area’s security. The rate of knife crime and domestic abuse are reducing, but still much higher than London. For youth delinquency, drug use and being sentenced of youth are also above the average of London and ranked 2nd and 10th (Haringey Council, 2019:38).
54% of residents agree that police do a good job in the local area –the lowest level of all London The rate of knife crime and domestic abuse are reducing, but still much higher than London The rate of drug use and being sentenced of youth are above London and ranked
34% which is the largest portion of residents said crime (include antisocial behav2nd and 10th
Anti Social Behaviour and violence crime are the dominant crime types The rate of Youth drug and offenders are also high Locally, High rates of crime around large malls and on High Rd
Figure 1.5.2: The crime rate of Haringey, London Comparison (Source: police.uk)
Diagnosis
Although improving, the high crime rate is one of the most significant issues of Haringey. Different types of crimes from anti-social behaviour to violent crime as well as youth crime required proper treatment such as improving the security of the public environment, community-enhancing and family education according to the type and regional characteristics.
Overview
The area in focus, Wood Green is one of three economic centres within Haringey and attracts many visitors from around the borough as well as neighbouring areas. This is predominantly due to Wood Green High Road which is a have hive of activity related to the retail and commercial office facilities along and adjacent to the street. Wood Green and Turnpike Lane underground stations flank either end of the High Road and provide good connectivity to the area.
Most of the socioeconomic data available for Wood Green is on a Haringey Borough level. As Wood Green is an Economic Centre of Haringey, the data available has been adopted for analysis purposes and will be quoted on a borough level.
Current State
To evaluate the current state of the economy within Haringey, it is important to understand People, Employment & Jobs and Local Business. Under each one of these areas a variety of figures have been provided to act as indicators to assess the economic health of Haringey.
People
• Median hourly pay for those working in Haringey is £14.87. This is 20% lower than the London average. Haringey has the second largest proportion in London that are earning below the London Living wage (29%) (Haringey, 2019). • Approximately one third of Haringey residents are in receipt of Housing Benefit (Haringey, 2019). • Haringey has a higher than average number and rate of children living in all out of work benefit claimant households, compared to London average (Haringey, 2019). • In middle income working households with children, 30% of income comes from benefits and tax credits (Haringey, 2019). • 12.6% of Haringey households live in Fuel Poverty, the 4th highest percentage in
London and substantially above the London average (10%) (Haringey, 2019).
• Employment & Jobs
In Haringey residents’ unemployment levels have reduced in line with average levels of reduction in London. Haringey’s current unemployment level is 4.5% compared to a London average of 4.7% (Haringey, 2019). As of December 2019 there are 92,000 jobs in Haringey, this is under half of the London average of 186,000 for other Boroughs. Haringey has the fourth lowest jobs density of all London boroughs (Haringey, 2019). Haringey’s population decreases by about 16% during the workday, indicating that residents leave the borough for work (Haringey, 2019). 8.6% of Haringey residents have no qualifications, the 7th largest proportion of all London boroughs (Haringey, 2019).
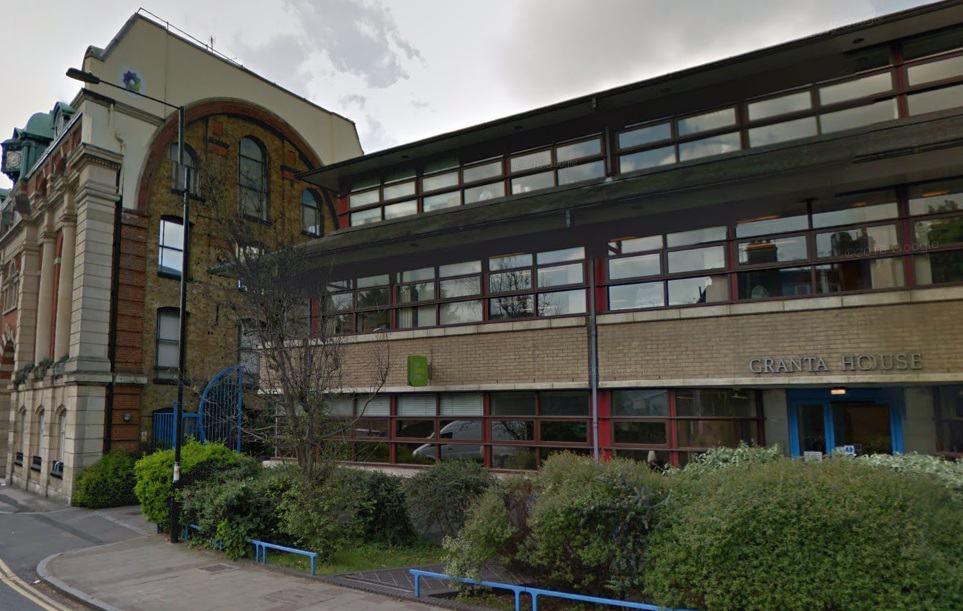
Figure 1.6.1: Wood Green JobCentre Plus in Granta House (Wood Green JobCentre Plus, n.d.)

Figure 1.6.2: Workshop taking place in Wood Green (Brexit Workshop, n.d.)
The focus of this section will be micro SMEs which employ 1 to 9 employees. Micro SMEs make up 96% of all businesses within the UK (Haringey, 2019). In October 2019, there were 12.1 start-ups for every 10,000 working age people in Haringey, compared with a rate of 12.4 per 10,000 across the whole of London (Haringey, 2019). There were 5.7% more business start-ups in Haringey during the first ten months of 2019 compared with the corresponding period of 2018, according to latest data from a BankSearch survey. This growth rate ranks Haringey at 87 out of the 326 English districts (Haringey, 2019).
Diagnosis
These findings suggest that in-work poverty is likely to be a significant issue for many residents. Many residents are in work, but are unable to meet their outgoings. This can be closely linked to average hourly pay within Haringey being 20% less than the London average and the high proposition of residents reliant on housing benefits and tax credits to supplement their income. The ability to achieve higher salaries could also be attributed to lack of qualifications of residents. Unemployment in Haringey is below the national average, however the amount of jobs available is half that of a London borough of similar population size (Haringey, 2019). This would suggest that there are not enough businesses in the area to support a higher proportion of jobs. This is further evidenced by a higher proportion of residents traveling out of the borough for work, compared to the London average (Haringey, 2019) .
The number of start-up businesses in Haringey is below the London average, although there has been a growth in the number of start ups between 2018 and 2019. There is likely to be a correlation between the number of new start ups and the amount of jobs available in Haringey.

Figure 1.6.3: 'Shop Local' Advertising Campaign Poster by The Mall, Wood Green (Wood Green Mall Promotional Poster, n.d.)
7. Health and Wellbeing
Overview
The rapidly developed health crisis this year shows the urgent need to manage public health, especially in globalised cities like London. One of the main challenges is to accommodate huge numbers of people crowding into the inner core of cities. The World Health Organization understands health not just as the absence of illness, disease and injury but embraces the extension of health to well-being. Built environment has been planned and formed to its best potential to meet human needs through design and development, but it could also lead to health threats. Globally, around 23% of deaths in 2012 were attributed to the physical environment including air and noise pollution, housing, transport and other factors (RICS, 2018). Haringey, where its Council is the second largest provider of mental health services, faces a wide range of health issues affecting the population. Cancer, cardiovascular disease and lung disease are the main causes of deaths under the age of 75 in Haringey. Nearly 2 in 3 adults are overweight or obese, 3 in 5 adults do not eat a healthy diet, more than 1 in 5 adults have high blood pressure and 1 in 5 people drink too much. Children from black and minority ethnic (BME) groups are more likely to be obese than white British children (Haringey’s Health and Wellbeing Strategy 2015-2018).
A UK wide study also found that minority ethnic groups in Haringey have lower life satisfaction and mental health than those of white ethnicity (Borough Profile 2019). Moreover, over 34,500 adults have a common mental disorder such as anxiety or depression (Haringey’s Health and Wellbeing Strategy 2015-2018). Suicide rates are 33% higher than the London average. residents tend not to use the facilities and help centres that are available locally (Haringey’s Health and Wellbeing Strategy 2015-2018).
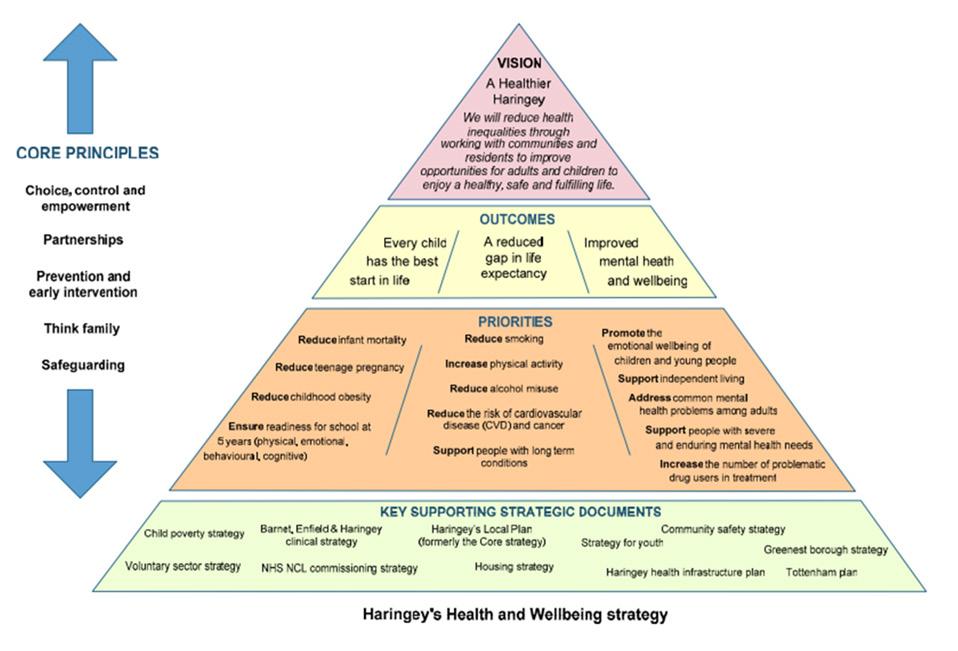
Fig1.7.1: Structure of Wellbeing Vision for Haringey (Haringey’s Wellbeing strategy, 2012)

Figure 1.7.2: Elements to Achieve Health and Wellbeing (Interns Pamojo , 2019)
The following are some of the current organisations available or sets the Council has taken to improve health and wellbeing:
Free Mental Health First Aid Training - available for all frontline staff working in Haringey. The Haringey Suicide Prevention Group (HSPG) - an organisation that aims to strengthen community response to suicide prevention planning and implementation. Haringey’s Health and Wellbeing Framework – a plan to improve the mental health and wellbeing of our residents. Second largest provider of mental health services in the borough is Haringey Council that provides social worker input to Community Mental Health Services and day services.
London comparison
Haringey has similar rates of depression 7.7% compared to London but higher rates of serious mental illness 1.37%. Approximately 5000 people are diagnosed with mental health problems in Haringey (Borough Profile 2019). Life expectancy in the borough is in line with the London average though there are stark differences among different groups (Borough Profile 2019). A higher proportion of children in Haringey are obese in both Reception (ages 4 to 5) and Year 6 (ages 10 to 11) than London and England as a whole (2012/13).
Diagnosis
Food choices and healthcare are two areas of focus. As such, Wood Green which sits within the London Borough of Haringey should improve its connections and accessibility to various health services in the vicinity, including walking trails and healthcare infrastructure. Healthier food option should be introduced in the more accessible parts of the area.
Figure 1.7.3: Elderly Wellbeing (Author, 2020)

8. Transport and movement
Overview
There are multiple ways and choices to get to Wood Green, with a generally good use of public transport. In the following different modes of transportation/movement and their quality of services are discussed, highlighting one of the internal weaknesses being that the service provision in the western parts of Wood Green is relatively poor. Current state
Wood Green has moderately good access to public transport (see Figure 1.8.1 and 1.8.2), as it is well connected by tube and rail services.
Picadilly line serves the area with underground stations such as Wood Green and Turnpike Lane Regular train service, that stops at Alexandra Palace station, runs direct from Moorgate or from Kings Cross. A number of bus routes run through the area such as W4, 121, 141, 221
However the connection between east and west is still weak with the absence of overground or underground lines. According to Transport for London’s 2015 Public Transport Access Level measurement, Wood Green received scores ranging from 2 to 6b (on a scale where 0 means very poor access and 6b means excellent access) (see Figure 1.8.3). There is an arguably huge disparity within the area, as the western parts of Wood Green perform significantly weaker than that of the other parts where the tube stations and the high street are located. In terms of transport facilities, there is a large bus garage near Wood Green tube station, which belongs to Arriva London bus company.
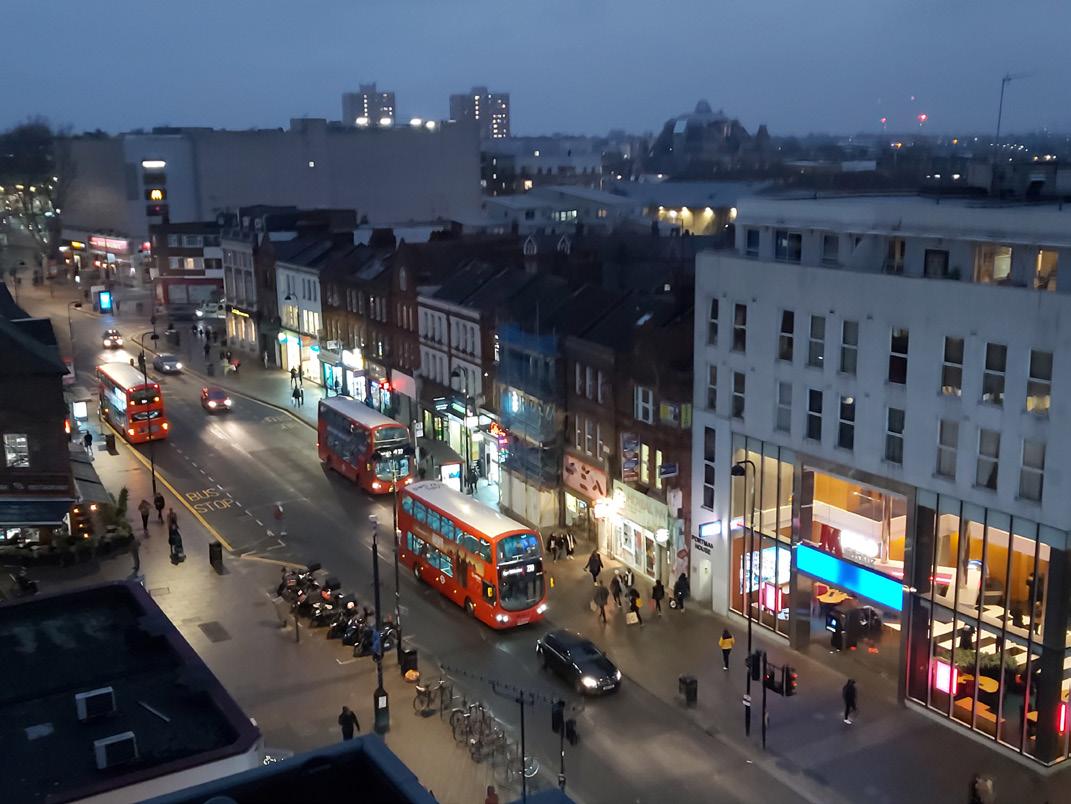
Figure 1.8.1: Bus routes operating along High Road (Author, 2020)
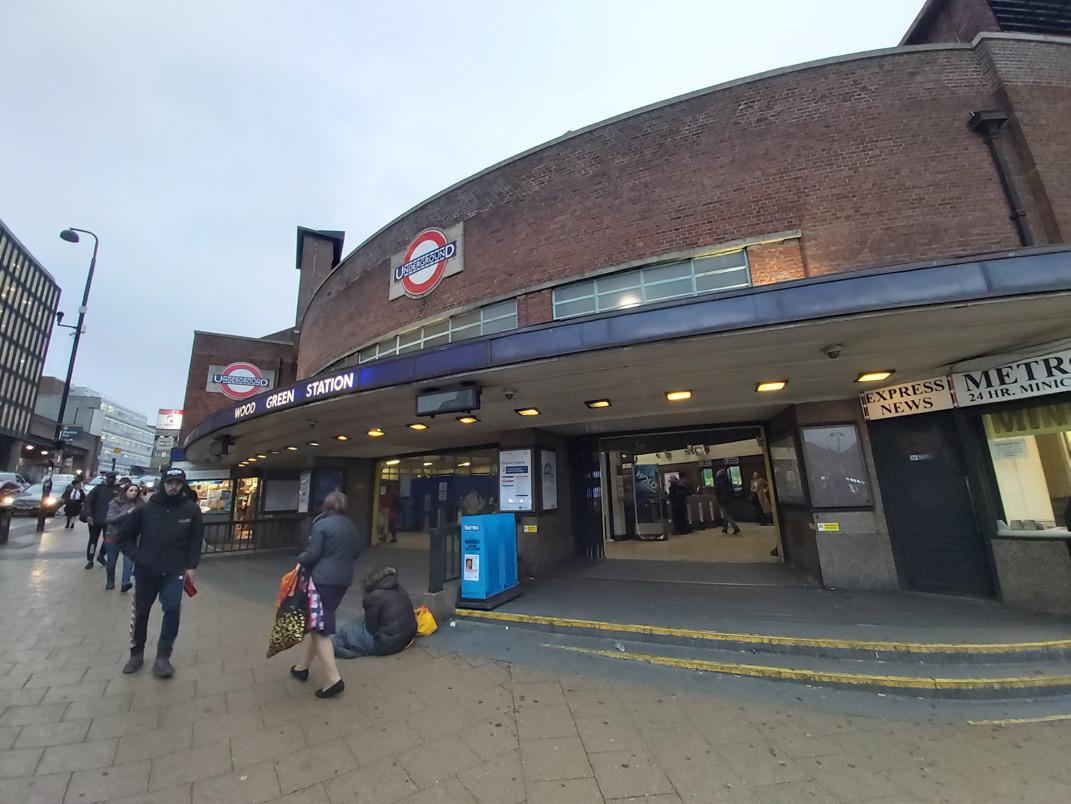
Figure 1.8.2: Tube station in Wood Green (Author, 2020) On the other hand, huge supermarkets and malls in Wood Green serve as the major hub bringing people from wider areas of Haringey together, but the size of buildings limits permeability and walkability, preventing a further increase in footfall. For example, people on high street need to either go through the building or detour via Station Road or Alexandra Road in order to reach the western parts due to barriers created by the bulky buildings as well as their parking lots; Wayfinding is another issue as the bulky malls and the lack of clear signages often would distract pedestrians or drivers, leaving them only the sense of where the key attractions are. Alexandra park, a highly loved public facility with diverse landscape, is situated at the western side of Wood Green and it is of great potential in providing desirable spaces for the creative industry in the vicinity, yet the tracks of National Rail and the unmanaged mound have created barriers in the accessibility, leaving just one small pedestrian tunnel between Wood Green and the Park.
London Comparison
Comparing Haringey with the wider London, Haringey has the third highest number of people in London that travel to work by public transport. Bus (20%) and underground (12%) usages are higher than the London averages. It is also one of the leading boroughs in London in delivering walking and cycling facilities. 31% of all trips are on foot, contrasting with the London-wide average of 21%. Cycle greenways, cycle training and cycle parking are sufficient. It reflects the higher potential to switch to more sustainable modes. In terms of car usage, journeys made accounts for 31% of trips, which is slightly higher than the inner London average (27%) but significantly lower than the outer London average (51%).
Diagnosis
Locally, public transport connectivity of the western parts of Wood Green and Turnpike Line is poor, where there is almost an absence of tube stations and bus stops. The existence of rail tracks further hinders a comprehensive provision of public transport services, permeable design and good wayfinding experiences. In terms of the wider area, east-west connection performs poorer than south-north due to the lack of tube and train services.
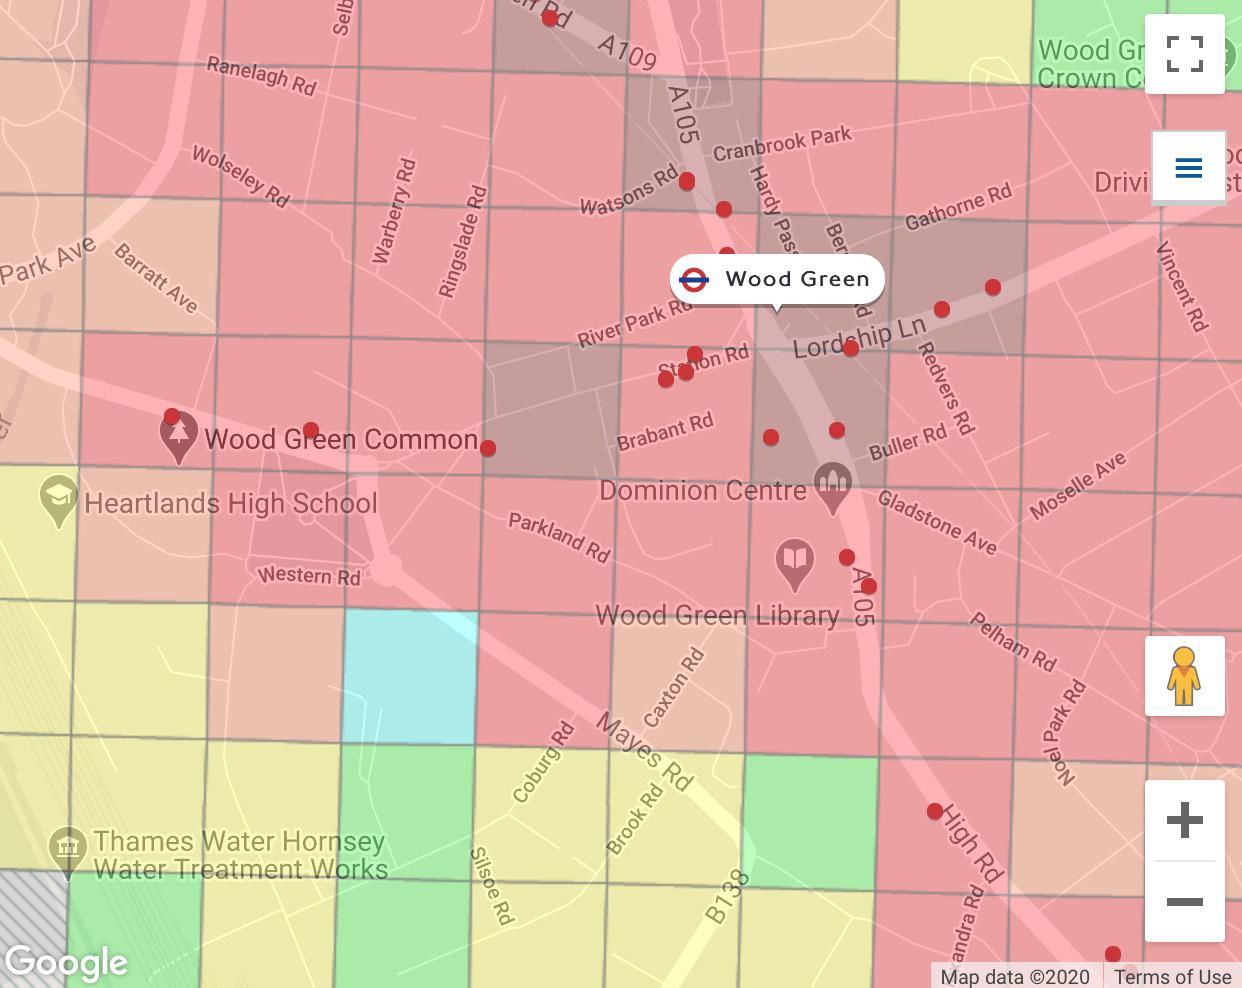
Figure 1.8.3: Public Transport Access Level in Wood Green (Source: Transport for London)
9. Current land Use and Ownership
Overview
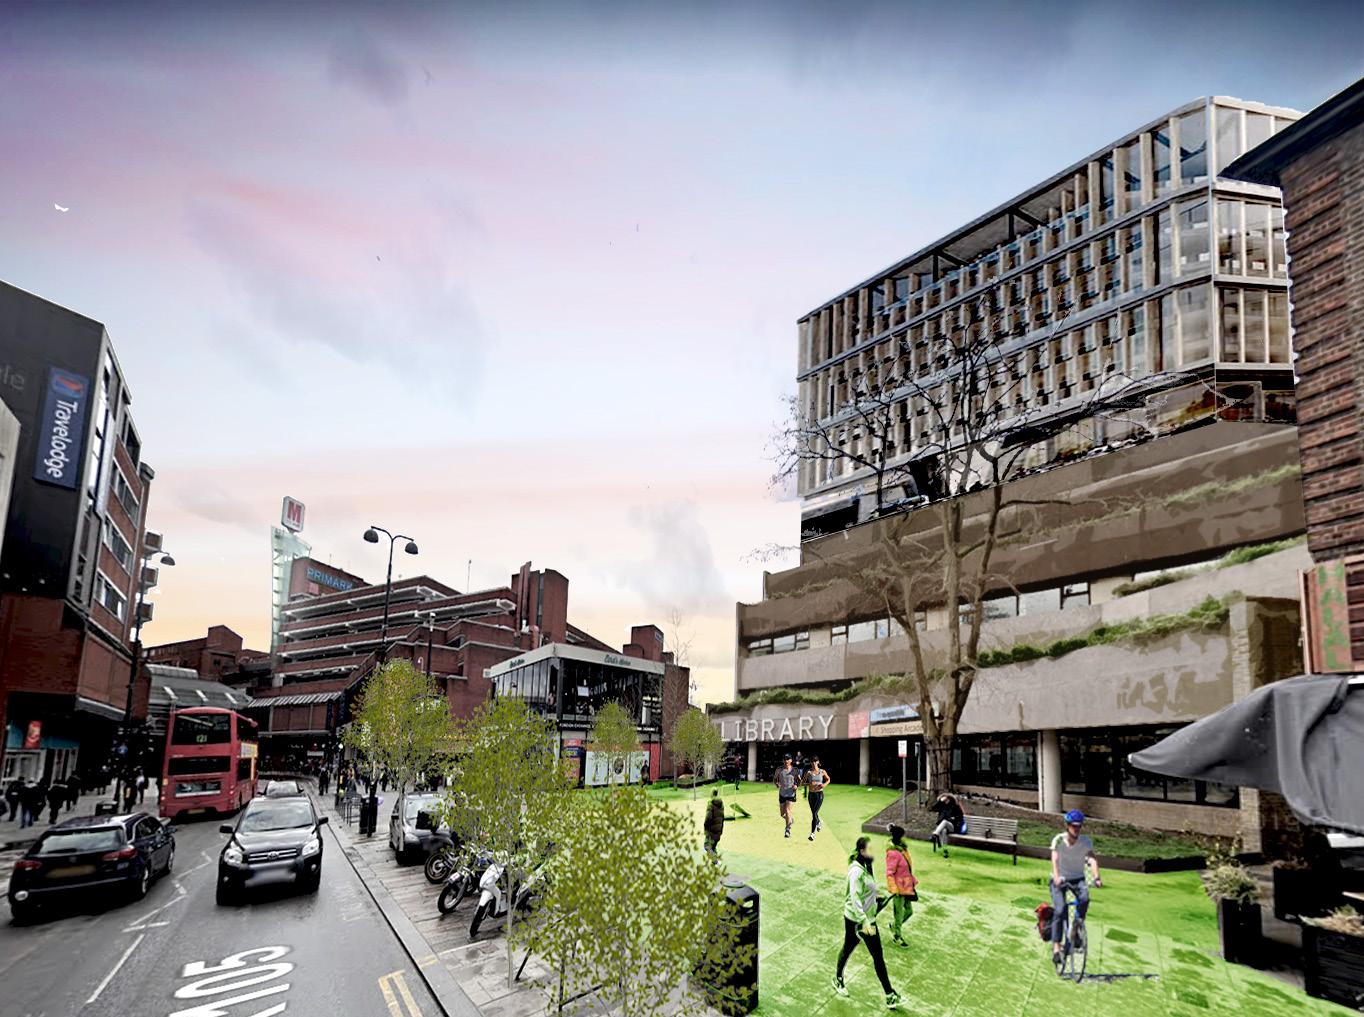
Wood Green’s High Road is a popular shopping and services destination which is recognised for the high footfall that it attracts on a regular basis (Wood Green Area Action Plan). Its primary attractors include larger retail facilities such as The Mall Wood Green and Vue Cinema London. It also includes community facilities such as the Wood Green Library and shops that cater to the necessities of residents in the area (grocery stores, pharmacies, and dentists). A complex of buildings used for light industrial activities is located to the north-west of the High Road. This area is recognised as an important contributor of office and creative spaces in Haringey, specifically for its co-working and maker space called the Chocolate Factory. Other similar coworking spaces and creative industries, The Blue Yard and Wood Green Works, are co-located in the general vicinity. The businesses along the highroad are considered dependent of footfall while the businesses to the northwest are not (see figure 1.9.1)
The typologies, conditions, and strengths and weaknesses of the area are discussed below. The intervention area contains Wood Green which is a Metropolitan Centre comprising a linear collection of shops adjacent to the High Road, made up of approximately 337 retail/service units (Haringey Council, 2013).
The commercial land uses on the High Road can be broadly separated into five categories, which are: convenience shopping, comparison shopping, services, leisure and entertainment, and community uses (Haringey Council, 2013). A concentration of large and medium sized buildings are located near the High Road in contrast to the surrounding residential neighbourhoods which are comprised primarily of developments with smaller footprints.
The buildings in the intervention area are largely younger than the surrounding residential areas which are primarily historic buildings (see figure 1.9.2). Although there are some historic buildings in the intervention area, the majority of structures in it can be classified as mixed age, interwar and post-war, and modern. Problems of under-utilised space and decaying property that need to be addressed have been identified by Haringey Council (2017B; 2018B).
Figure 1.9.1: Land uses (Haringey Council 2015)
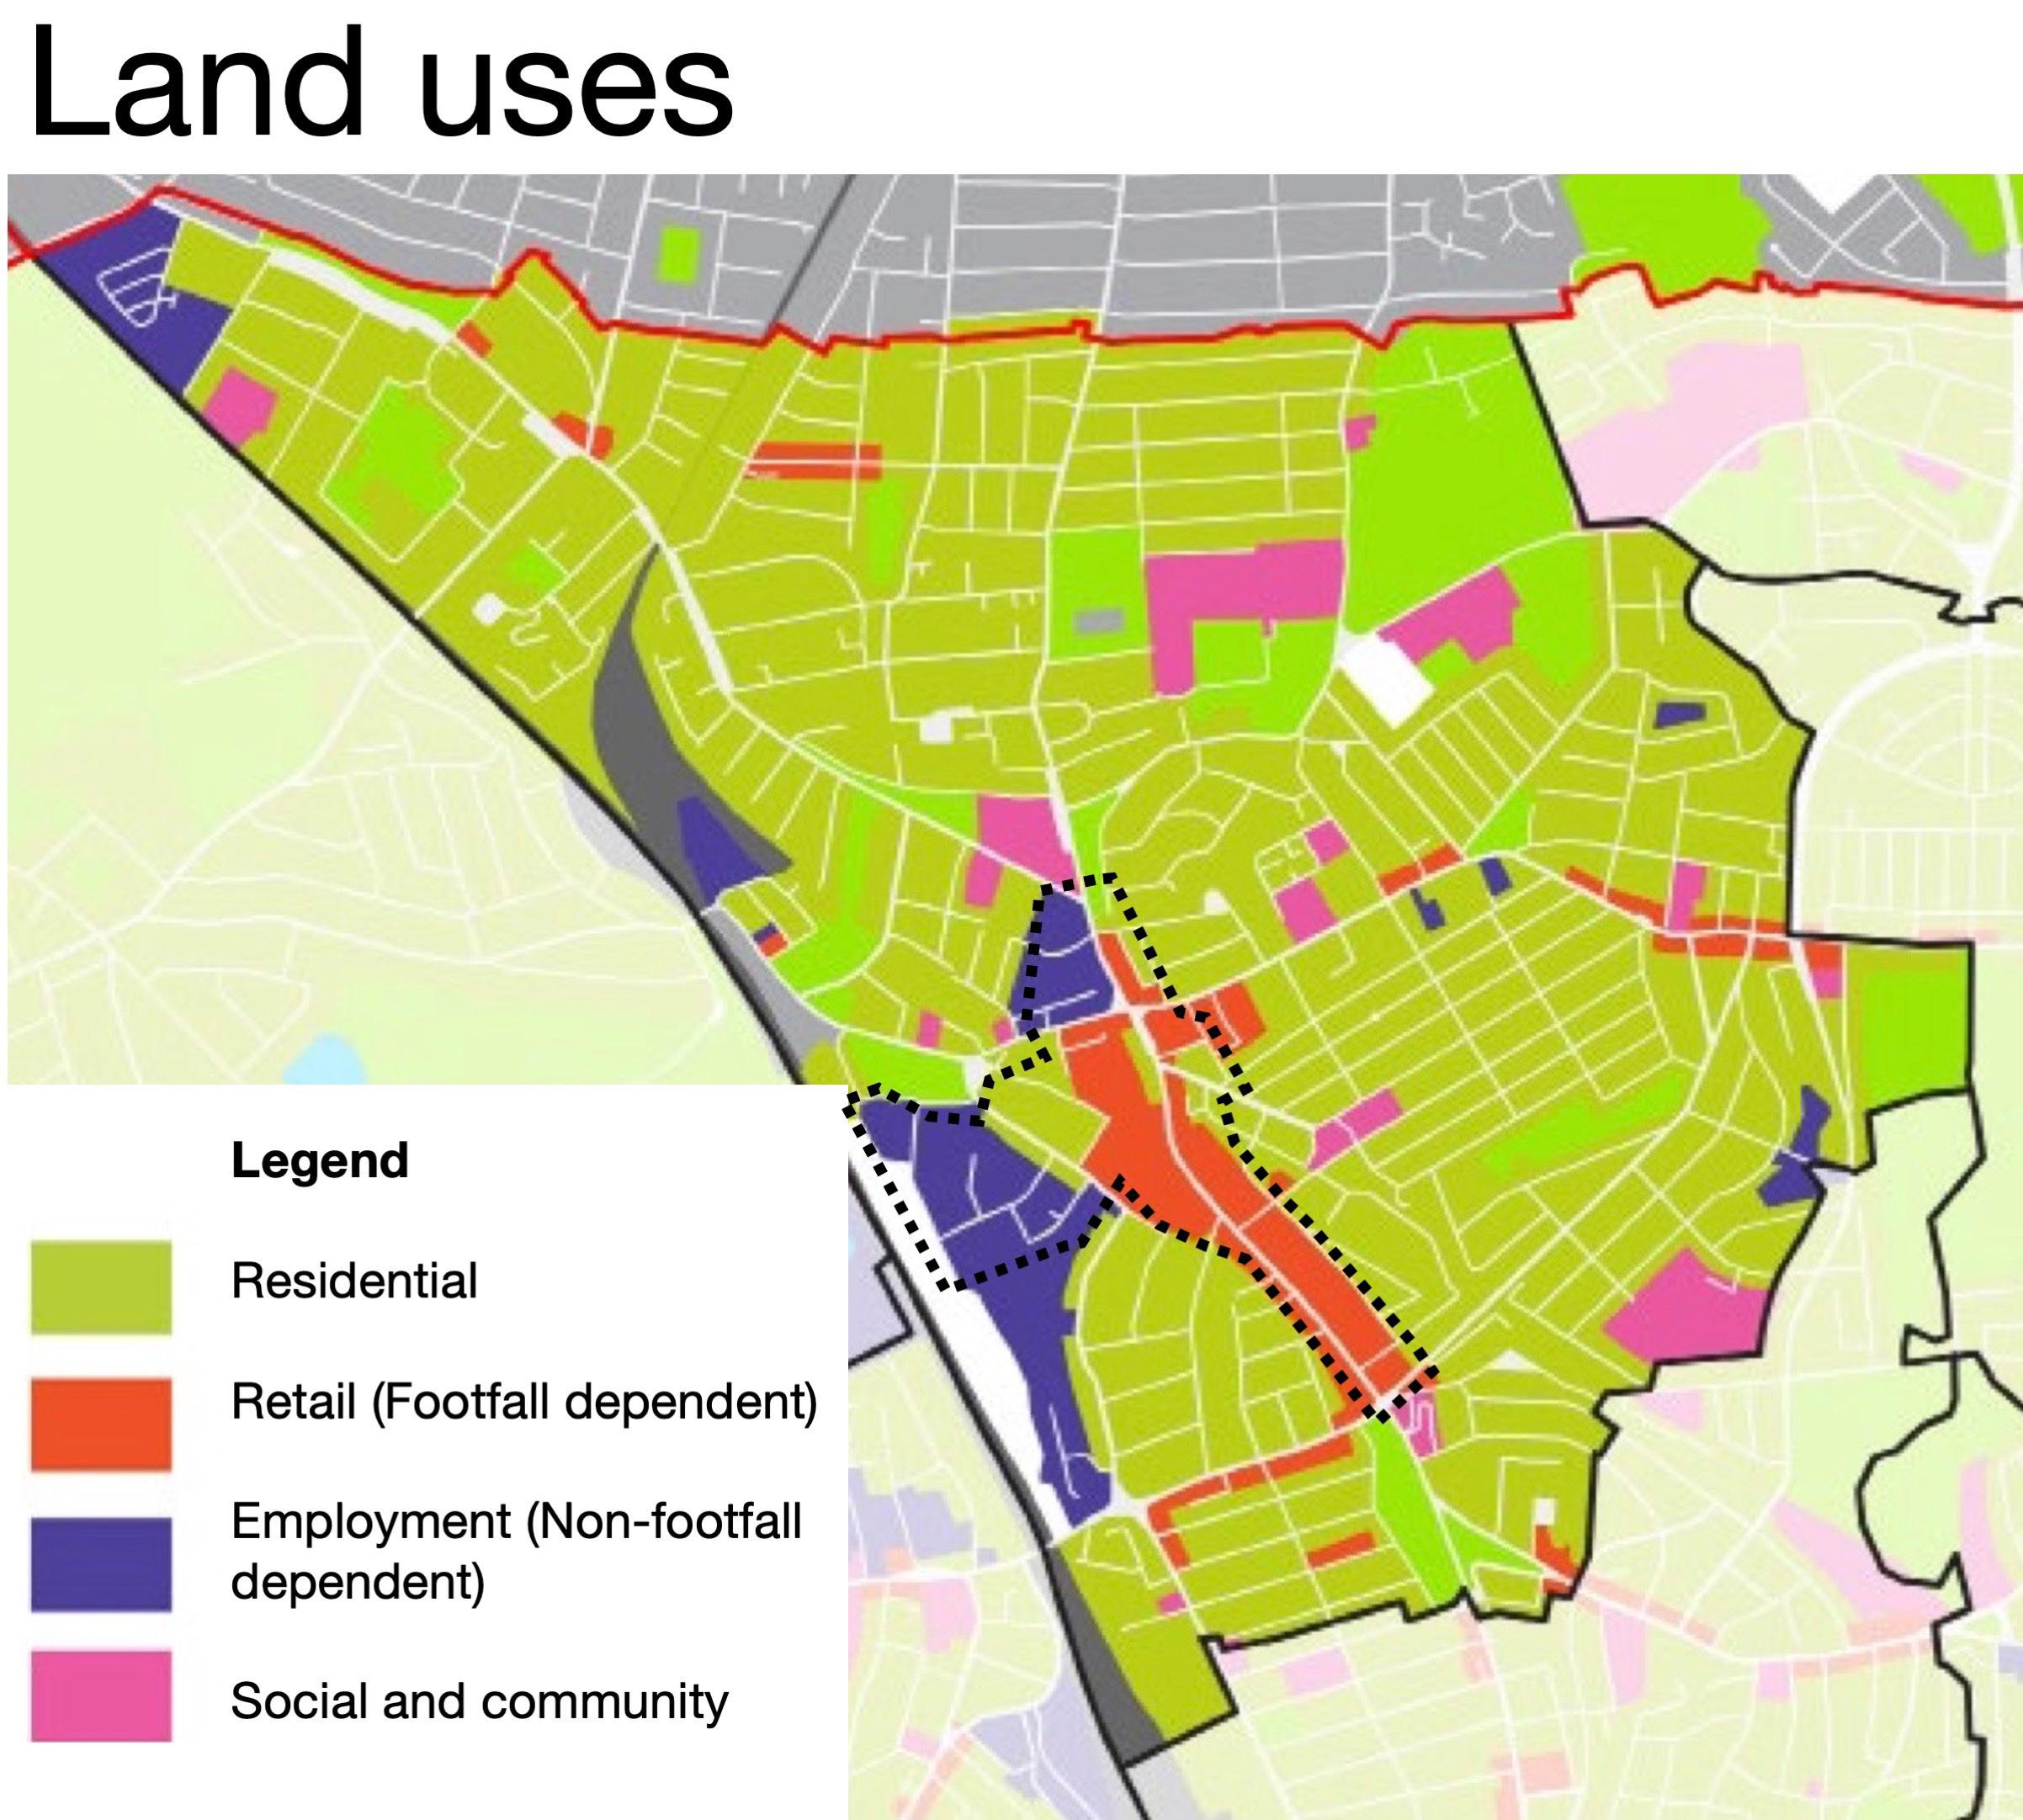
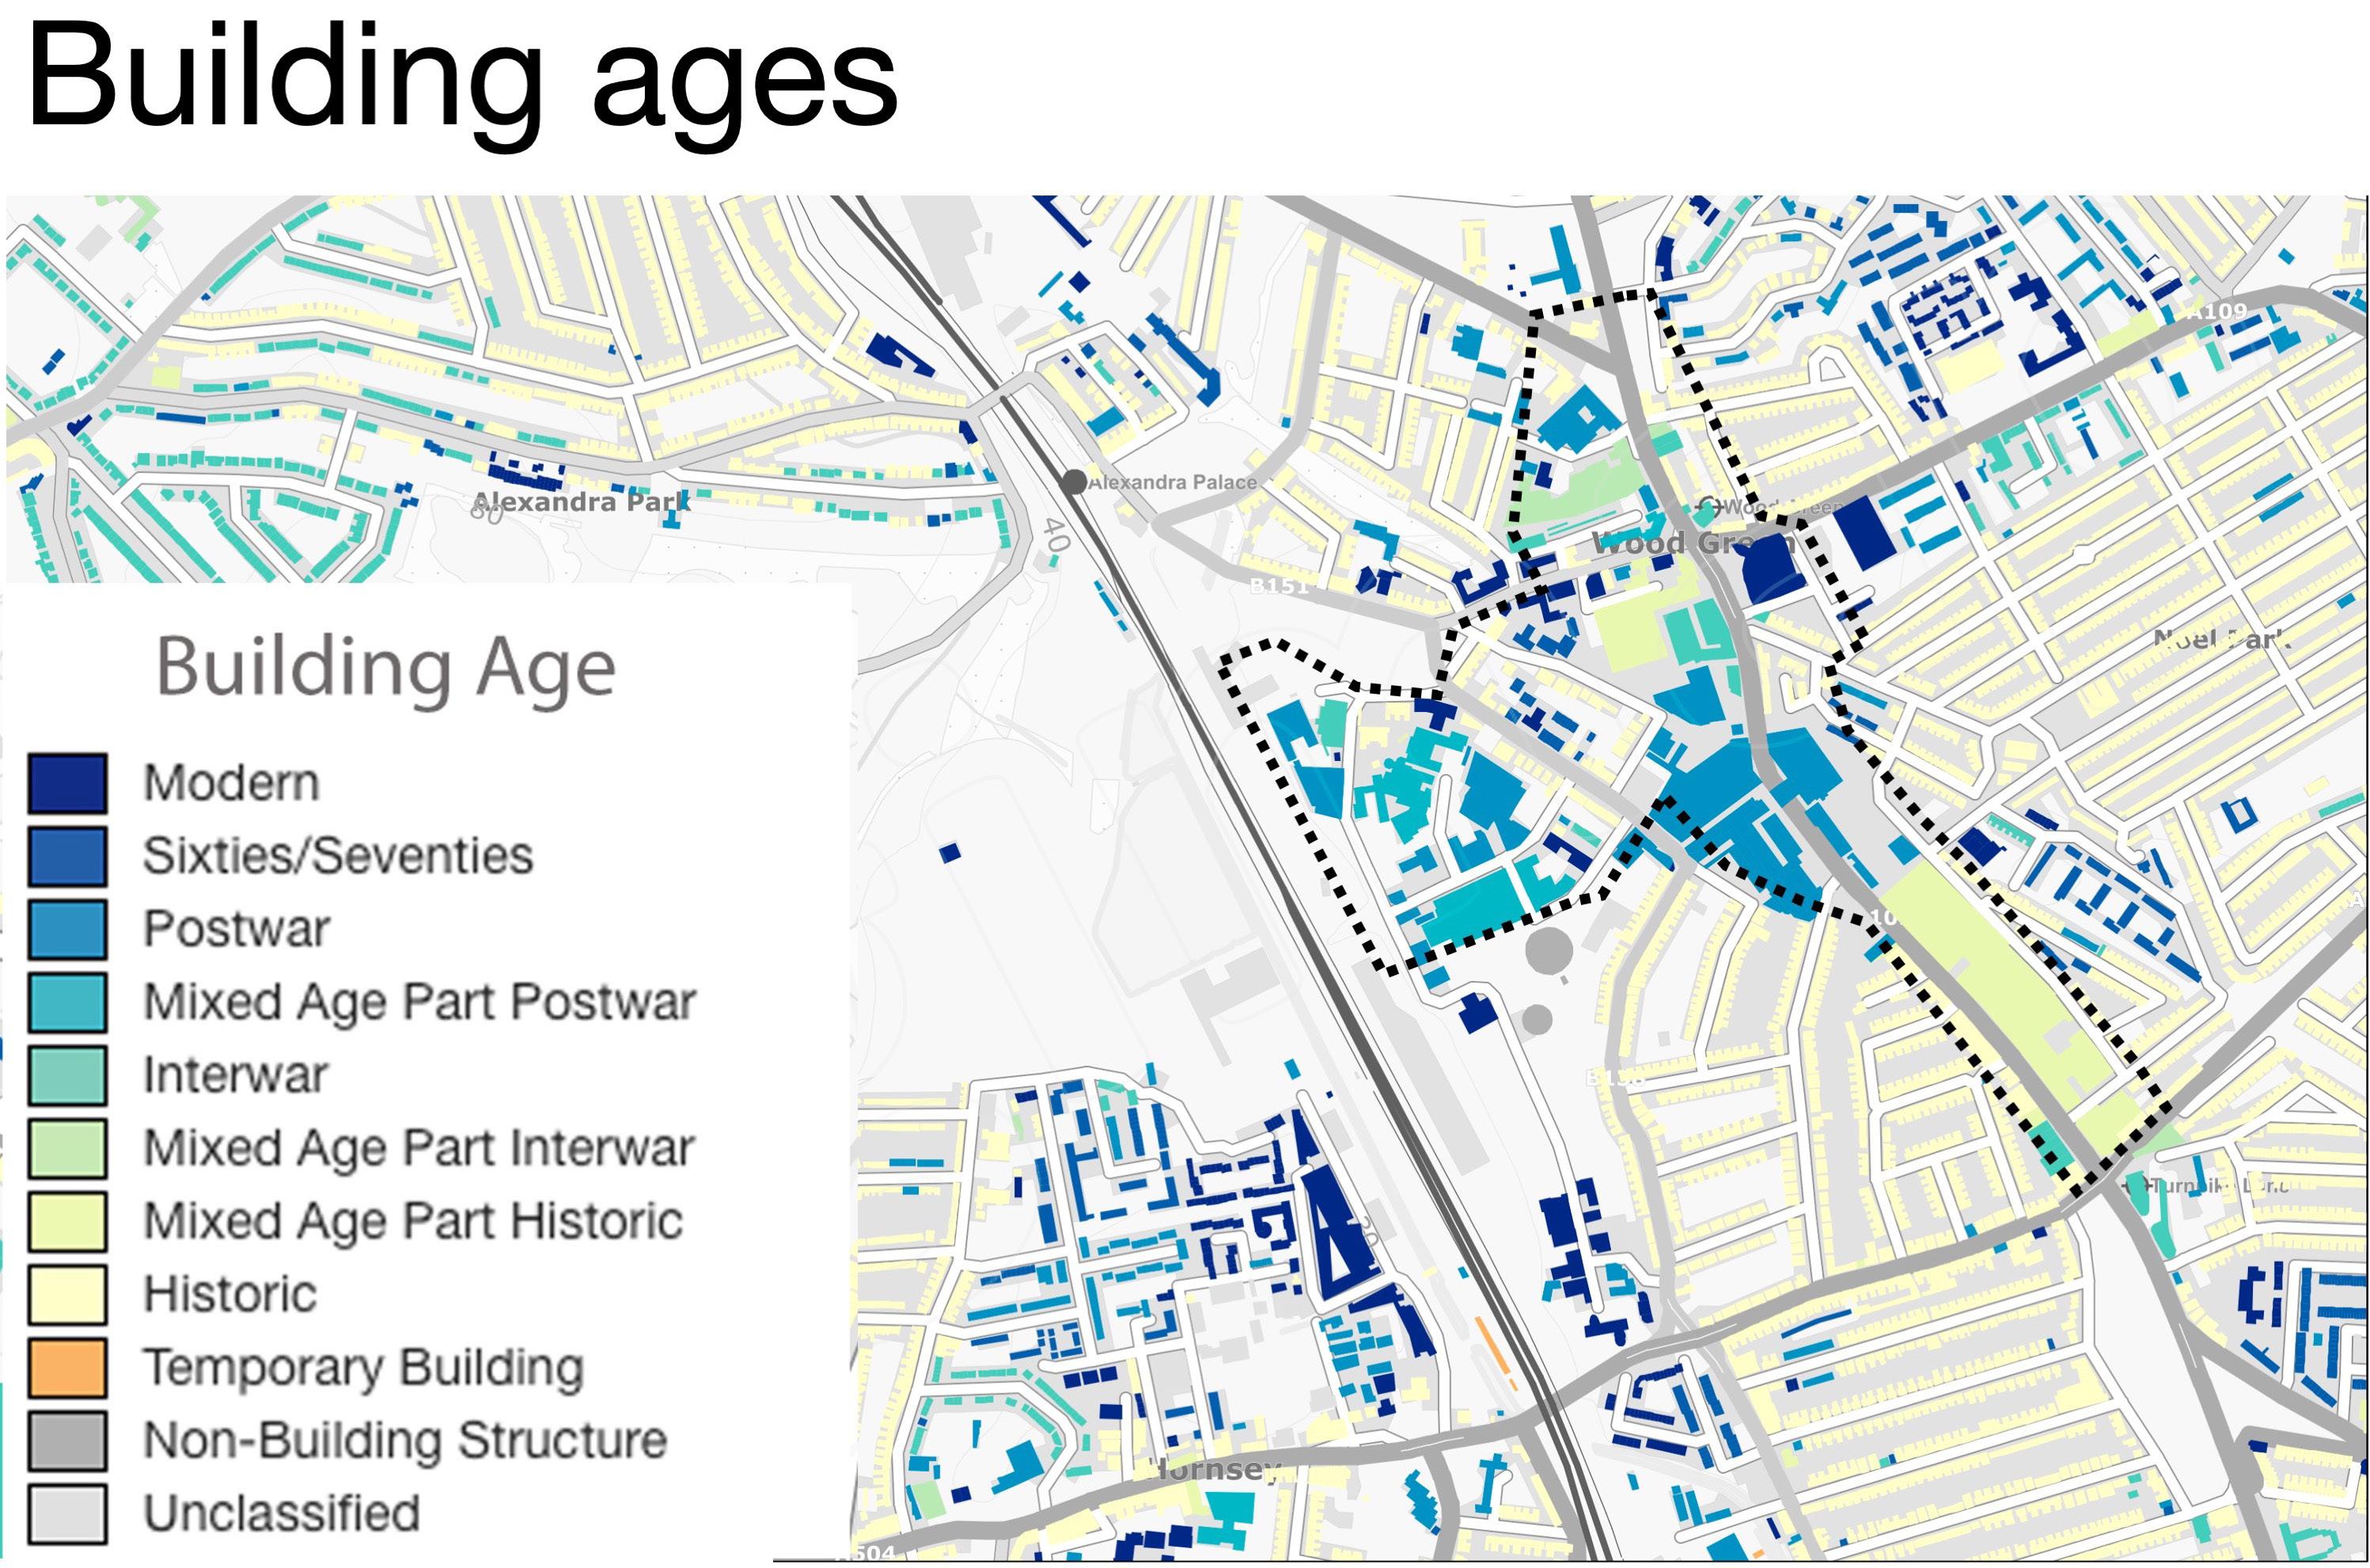
Figure 1. 9.2: Building age (EDINA, 2020)
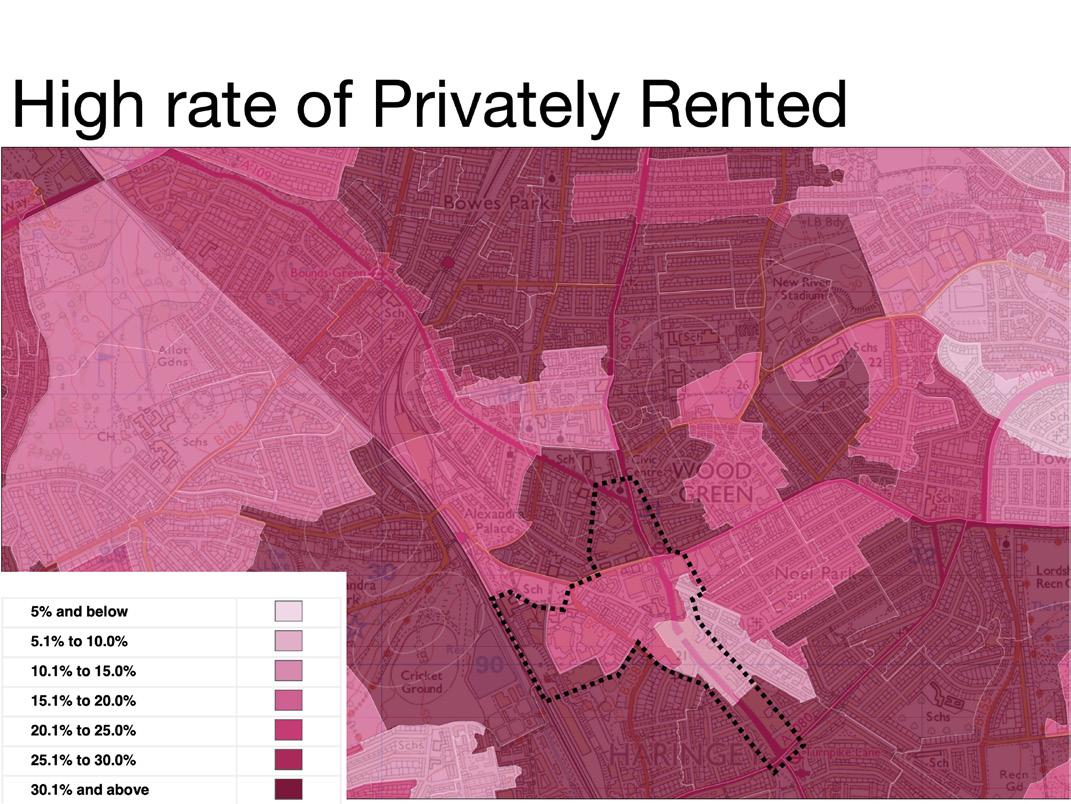
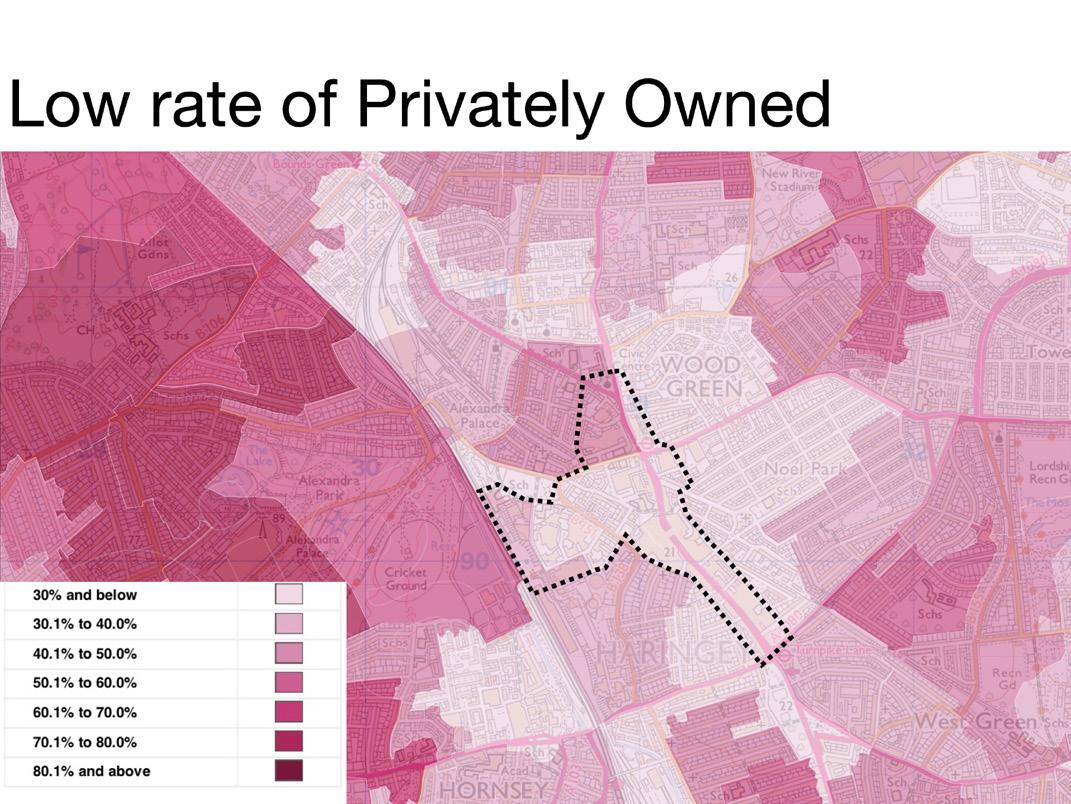
In the neighbourhoods surrounding the intervention area: 30% or less of households are privately owned, there is a high percentage of social renters ranging from 15 to above 25%, and there is a similar concentration of private renters ranging from 20 to above 30% in areas that are not socially renting (see figure 1.9.3). These trends persist in the surrounding neighbourhoods.
Haringey Council partially or fully own 13 properties within the intervention area (as shown in figure 1.9.4). These are located along the high road and in the industrial area and comprise the majority of commercially used land in Wood Green.
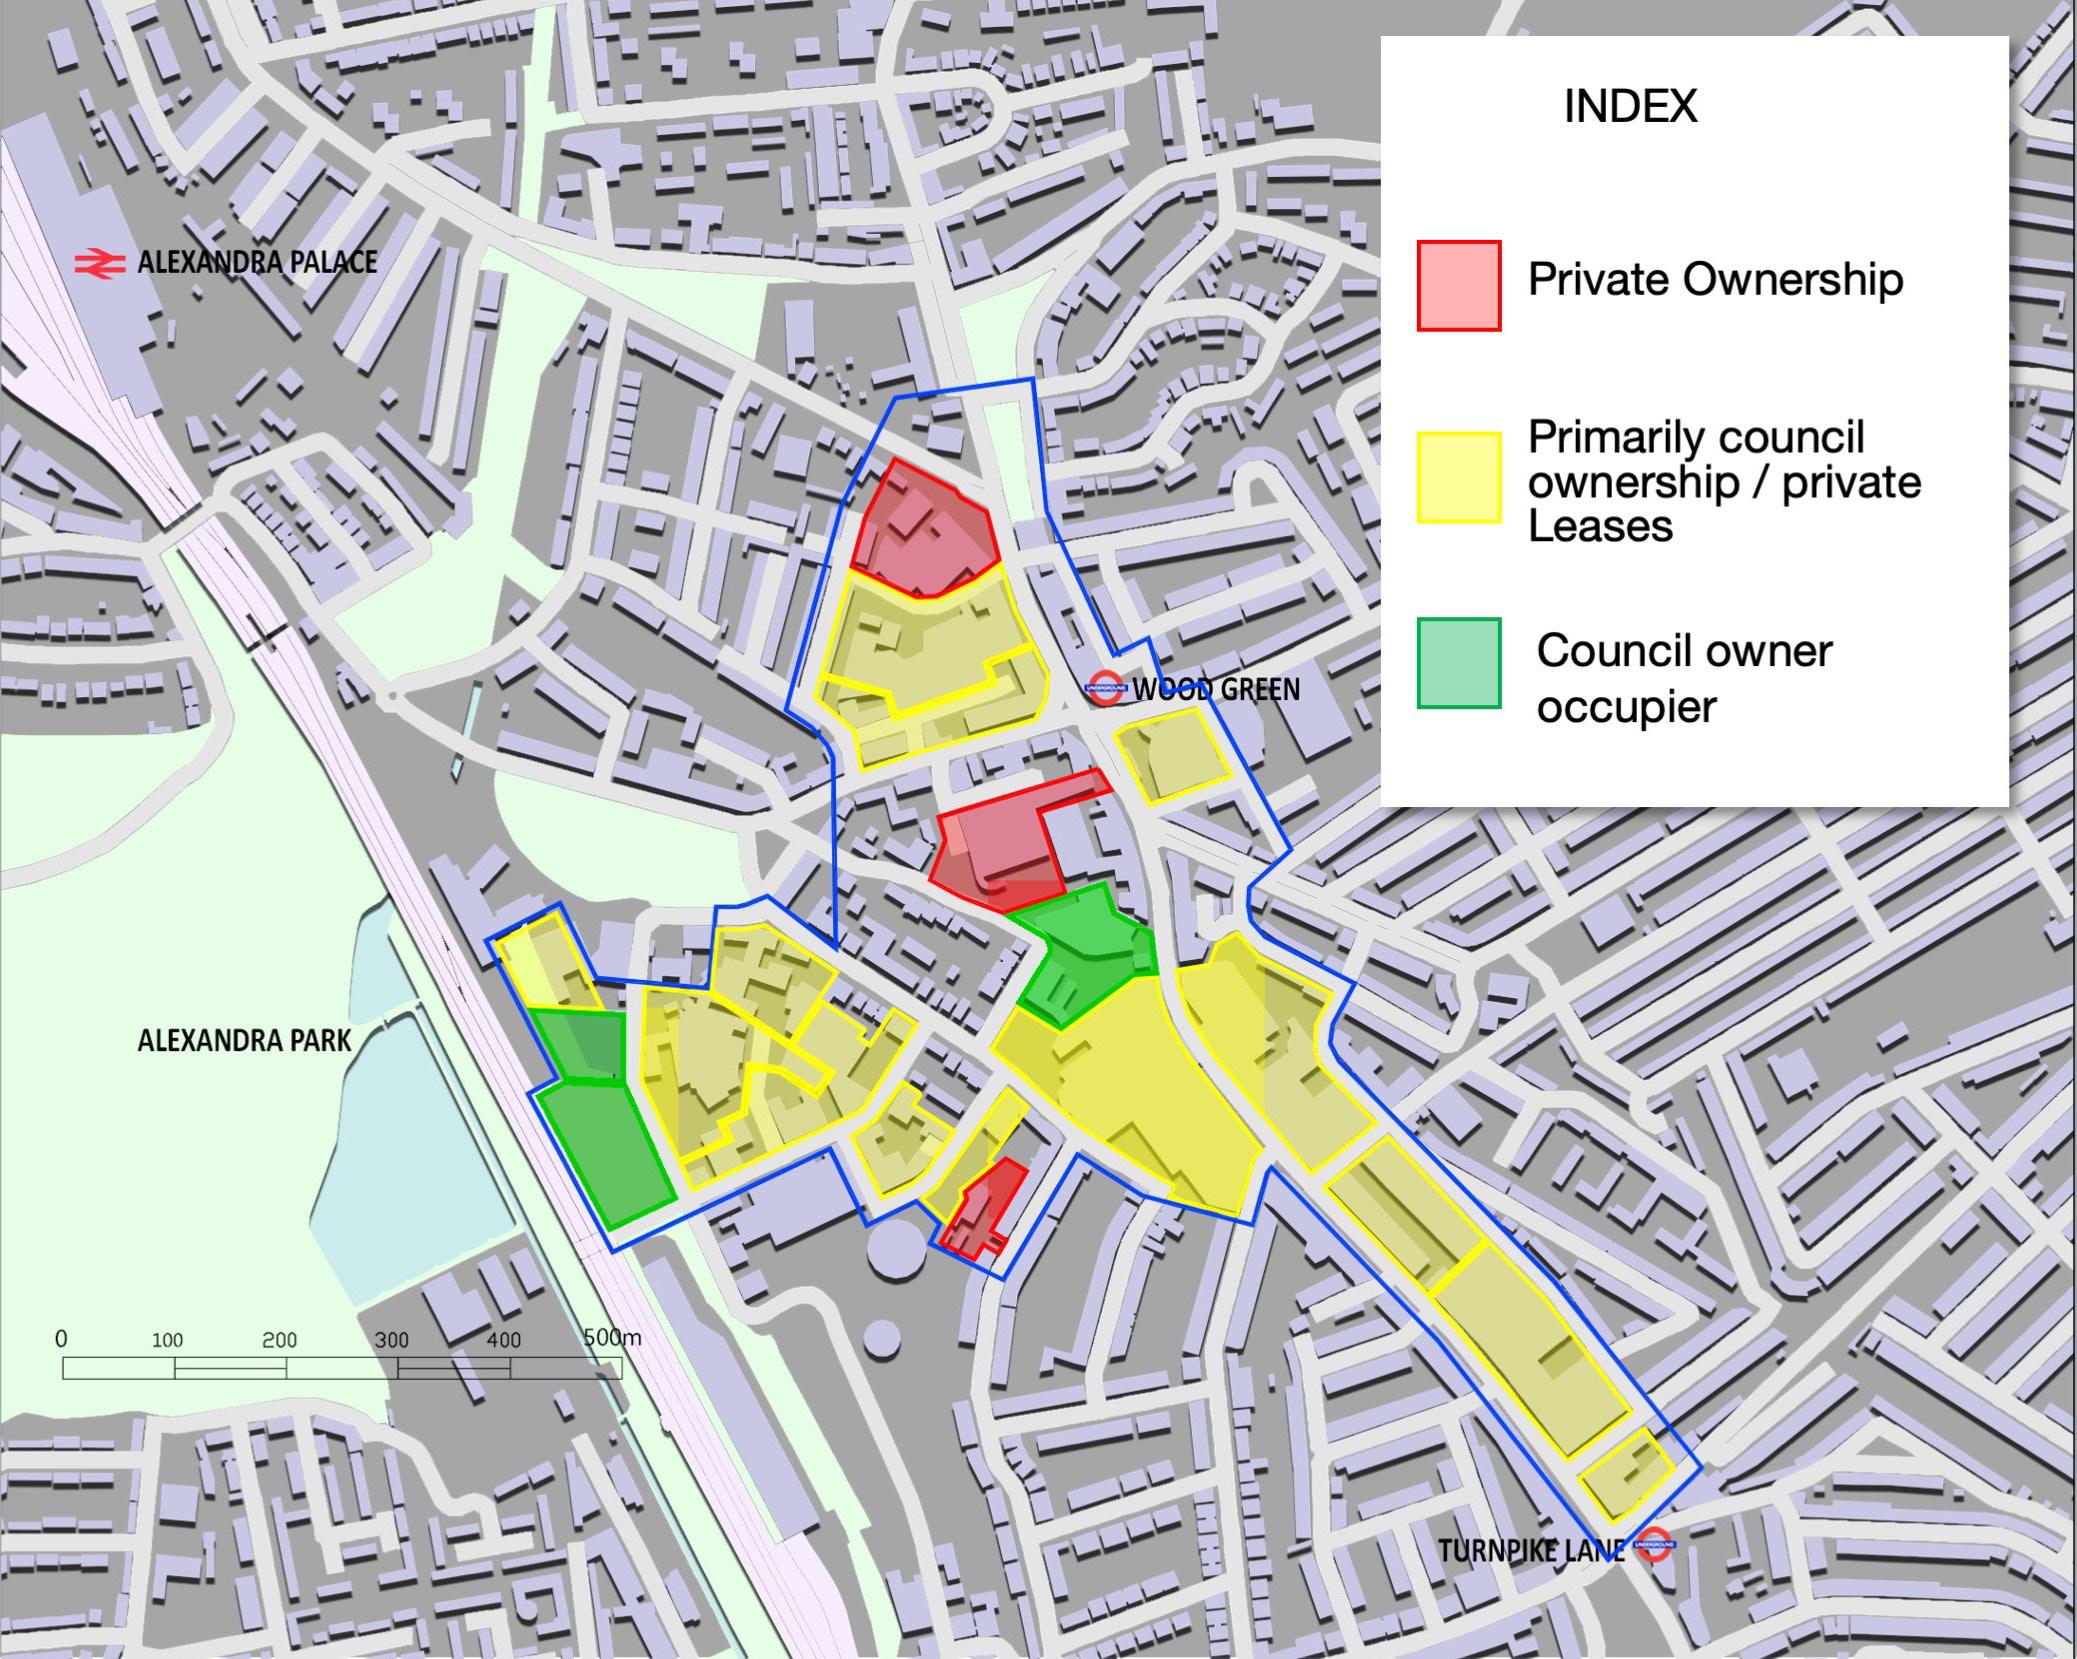
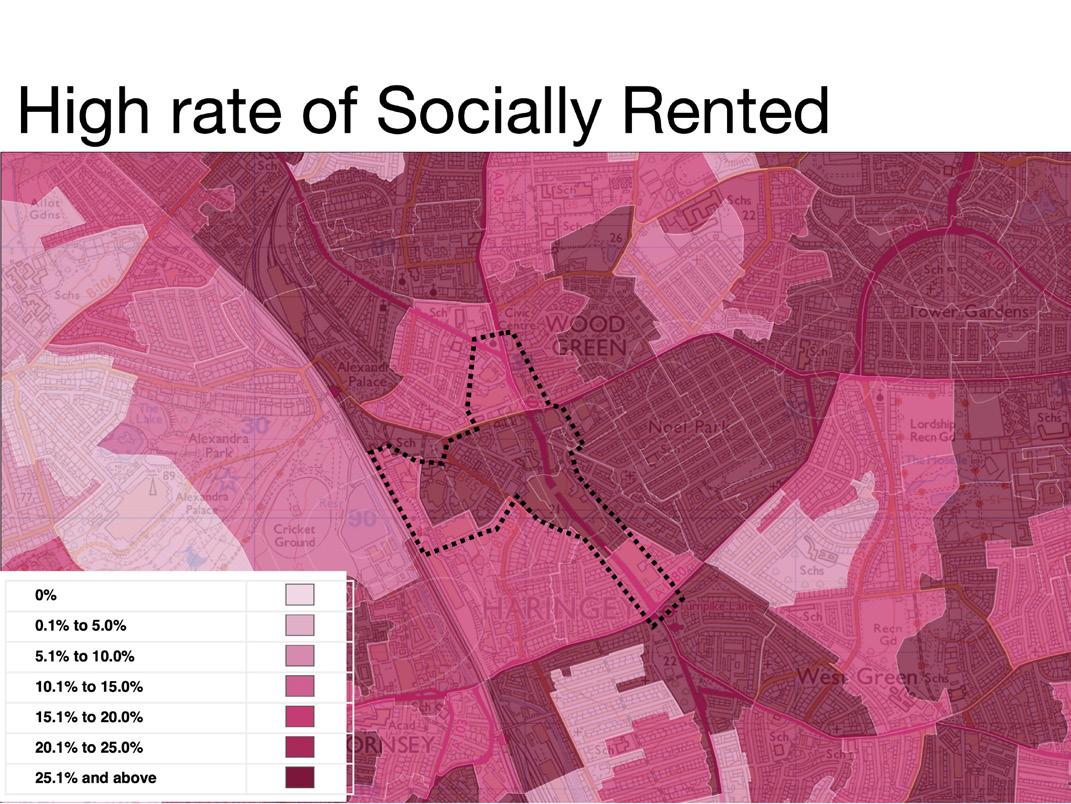
Figure 1.9.3: Residential tenure (EDINA, 2020) London comparison
Although there are vacant properties on the High Road, they are shown to only represented 3.3% of the entire stock of building which was well below the national average of 13.7% (Haringey Council, 2013). For this reason, despite the occurrence of sum level of vacancy on the high street, it is considered to be relatively well functioning, as demonstrated by the high levels of footfall (Haringey Council, 2013). Diagnosis
Figure 1.9.4: Land ownership (Haringey Council 2017)
From observations of the intervention area and an analysis of the relevant planning documents, it is apparent that there are both problems of under-utilised space and decaying property that need to be addressed (Haringey Council, 2017). These failings of the built environment are somewhat ameliorated by the vibrancy of the high-street. This vibrancy makes a clear case that these spaces are in demand and should be maximised to their full potential to meet the current and future needs of residents of Wood Green and others in Haringey and London who benefit from the commercial activity along the High Road. Due to the substantial amount of key commercial land owned by Haringey Council, the council is well placed to lead urban regeneration efforts in the area. However, any new development in Wood Green needs to be carefully planned to safeguard the high percentage of renters in the surrounding neighbourhoods from the threat of gentrification it may pose.
10. Public Spaces and Activities
Overview
Wood Green is the main retail and leisure centres of Haringey. This includes a mall with market, supermarkets, banks, cinemas, food & beverage outlets and other retail. Many of the Harringay local authority offices and civic buildings are situated within Wood Green and provide services such as a library, job seeker facilities and other civic support centres.
Current State
The High Road within Wood Green is a hive of activity and attracts visitors from the local area and further afield due to the many services available and leisure opportunities. To evaluate the current state of Wood Green’s public spaces and activities (the Cultural Quarter has not been included in this section as it is mainly used for industrial uses and not for general public use). The section below breaks down the current state of public spaces and activities into the current advantages and limitations of the Wood Green area:-.
Advantages • The area can be easily reached by public transport – 2 underground stations and main bus hub. • The area is well connected to the London Cycle Network (LCN). • Haringey has a number of large public nature spaces, including Alexandra Palace,
Finsbury Park, Wetlands and the River Lea. • There are two large cinemas. • There are three supermarkets. • There is a mall with an attached market. • There are two large spaces outside the Cinema and Library, these have been shown in figure 1.10.1 and 1.10.2. These spaces could be used to host small events.
Limitations • Although the high road can be classified as a public area, this space is limited to the pavements either side of the road. (as shown in figure 1.10.3), there could be opportunity to add benches and planting areas. • There are no public squares available beyond the buildings, on the High road, however traffic on the high road could be temporarily diverted for events. • Only 38% of homes within Wood Green have access to nature, lowest in Haringey (Haringey, 2019). This is due to the scarce amount of green spaces available close to the area. • A high proportion of space is allocated to road traffic and parking, this conflicts with the circulation of pedestrians. Wood Green has many services as well as retail and leisure opportunities which attracts a high volume of visitors. These findings suggest that even though Wood Green is a magnet for the public, the spaces allocated for public use are limited. This is particularly the case for nature based spaces for which residents in Wood Green have the least amount of availability and accessibility in Haringey. The area is heavily used by road traffic, it would seem priority is currently given to car users in the area. This is evident by the large amounts of traffic on the high road and abundance of car parking facilities. Outdoor space allocated for public uses and activities in Wood Green is below what would be expected for an area with such high footfall.
There is opportunity for the hosting of temporal events in the many shops which are vacant on the high road, particularly those that were previously tenanted by department stores tenants. In the absence of any large public squares, the high road itself could be used to events if it was temporarily pedestrianised. This would allow the hosting of several large seasonal events throughout the year using the vibrant High road area.
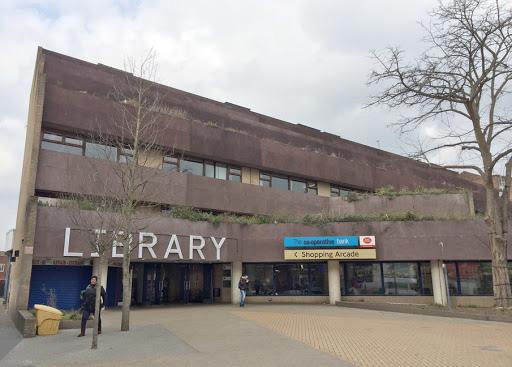
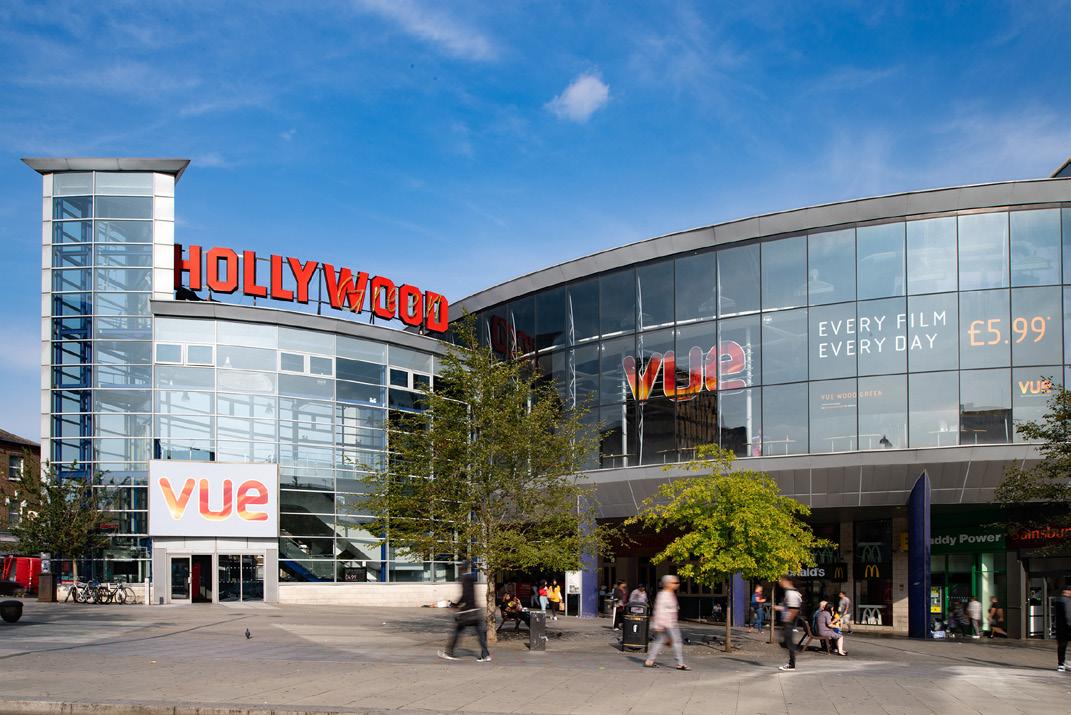
Figure 1.10.1: Space outside Vue Cinema (Vue Cinema Wood Green, n.d.)
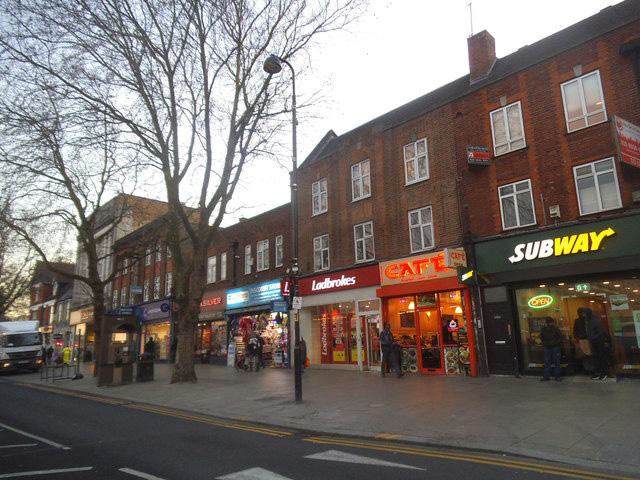
Figure 1.10.2: Space outside Wood Green Library (Wood Green Library, n.d.)
Figure 1.10.3: View of Wood Green High Road Circulation Space (Howard, 2016)
11. Planning and Policy Context
Planning and Policy Context
This sections sets out the most relevant planning and supplementary planning documents related to the regeneration of Wood Green. This is not a comprehensive list but serves to outline the primary documents setting the intentions for regeneration in the area, which are: • The New London Plan (GLA, 2019A), • The London Plan (GLA, 2016), • Haringey Local Plan (HC, 2020,) • Draft Wood Green Area Action Plan (HC, 2018B), and • Wood Green Strategic Regeneration Framework (HC, 2018C).
The New London Plan (GLA, 2019A)
While the London Plan (GLA, 2016) is the adopted Development Plan for London, the Draft London Plan is nearing its final adoption and has implications for regeneration and development (GLA, 2019B). The Secretary of State supplied a response to the plan in March 2020. The Mayor of London is currently considering how to respond and undertaking the statutory requirements to finalise the Plan (Ibid).
In the new Plan, Wood Green is recognised as a Metropolitan Centre with Regional and Sub-regional significance (GLA, 2019A, Annex 1 and Table A1.1 s. NT2). It is also classified as an Opportunity Area (GLA 2019A, s. 2.1.32-33). Opportunity Areas are significant locations with capacity to accommodate new development due to their existing conditions and connections to London. Wood Green is considered to have capacity for medium commercial growth, high residential growth, and regeneration and capable of supporting 4,500 and 2,500 new homes and jobs respectively (GLA, 2019A, Table 2.1).
London Plan (GLA, 2016)
Wood Green is identified as an Opportunity Area in the London Plan (GLA, 2016). In regard to the Wood Greet Town Centre, in the Plan which states, “[o]pportunities should be explored to redevelop parts of Wood Green town centre for high-density, mixed-use schemes and strengthen pedestrian connections to the town centre and library” and indicates that there in an indicative capacity for 2,000 additional jobs and a minimum on 1,000 new homes (GLA, 2016, Annex 1 s. 40).
Wood Green is also identified as a Metropolitan Centre along with only 13 other sites in London, which indicates its size and significance to the city (GLA, 2016, Annex 2). Additionally, the site is classified as being suitable for regeneration which indicates it has the correct capacity and characteristics to achieve regeneration objectives including physical, environmental and economic renewal (GLA, 2016, policy A2.6). Haringey’s Local Plan governs development in the borough and is currently made up of the “Strategic Policies, Development Management Policies, Site Allocations and Tottenham Area Action Plan, alongside the London Plan” (HC, 2018A, p. 1). As in the London Plan, Wood Green is allocated as a Growth Area in Haringey’s Local Plan Strategic Policies (HC, 2017, p. 43). Additionally, it is identified as a Metropolitan Town Centre and is recognised in this plan as an Area of Change which contains a Cultural Area, and Key Housing Sites (Ibid). These designations show the importance of Wood Green to the borough of Haringey as well as its potential for regeneration.
The intervention site fully or partially contains the following overlays of the Haringey Local Plan (HC, 2020):
Family Housing Protection Zone (fully), Tall Buildings Growth Area (fully), Article 4 direction – Warehouse to Residential (partially), Cultural Quarter (partially), Listed Building Locally Listed Building (partially), Local Employment Area: Regeneration Area (partially), Primary Shopping Areas (partially), Primary Frontage (partially), Secondary Frontage (partially), and Local Centres (partially).
The planning polices most relevant to these overlays have been analysed and attached as an appendix.
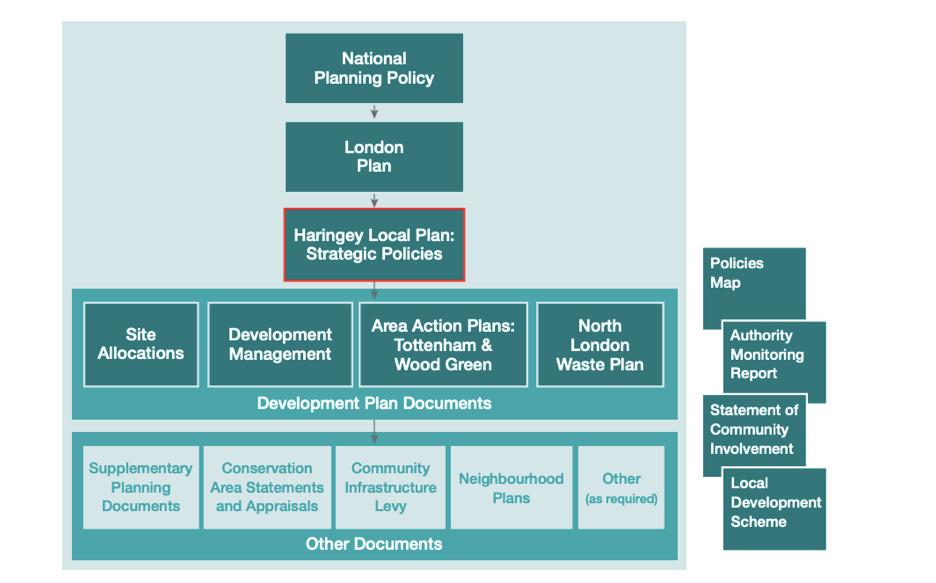
The Local Plan informs the successive plans and supplementary planning documents (SPDs) that have been prepared to support the regeneration of Wood Green (as shown in figure 1.11.1). The most relevance SPDs to the creation of this strategy are the Draft Wood Green Area Action Plan (HC, 2018B) and the Wood Green Strategic Regeneration Framework Appendix 1 (HC, 2018C) which are described next.
The WGAAP is intended to function as a “blueprint for the comprehensive, co-ordinated, regeneration of Wood Green” which will provide approximately 4,000 new jobs and 6,400 new homes (HC, 2018B, p. 3). The Site Allocations (see associated figure 2) in the WGAAP set out a spatial distribution for regeneration and new development in Wood Green, which comprise allocations for new residential units, employment floorspace, and town centre floorspace. The plan also provides for improved cycling and walking options, new open spaces and the potential for a leisure facility (HC, 2018B).
The intervention area central to this strategy contains 19 out of 28 of the site allocations in the WGAAP and therefore has the potential to deliver 70,553m2 and 3,788 of employment floor space and net residential units respectively (HC, 2018B p.102-168). The details of the site allocation and the anticipated yields of residential units, employment floor space, and other land uses are attached as an appendix to this strategy. Strong cultural offer with supplementary evening economy as well Sustainability in regeneration and drive to becoming a zero carbon borough by
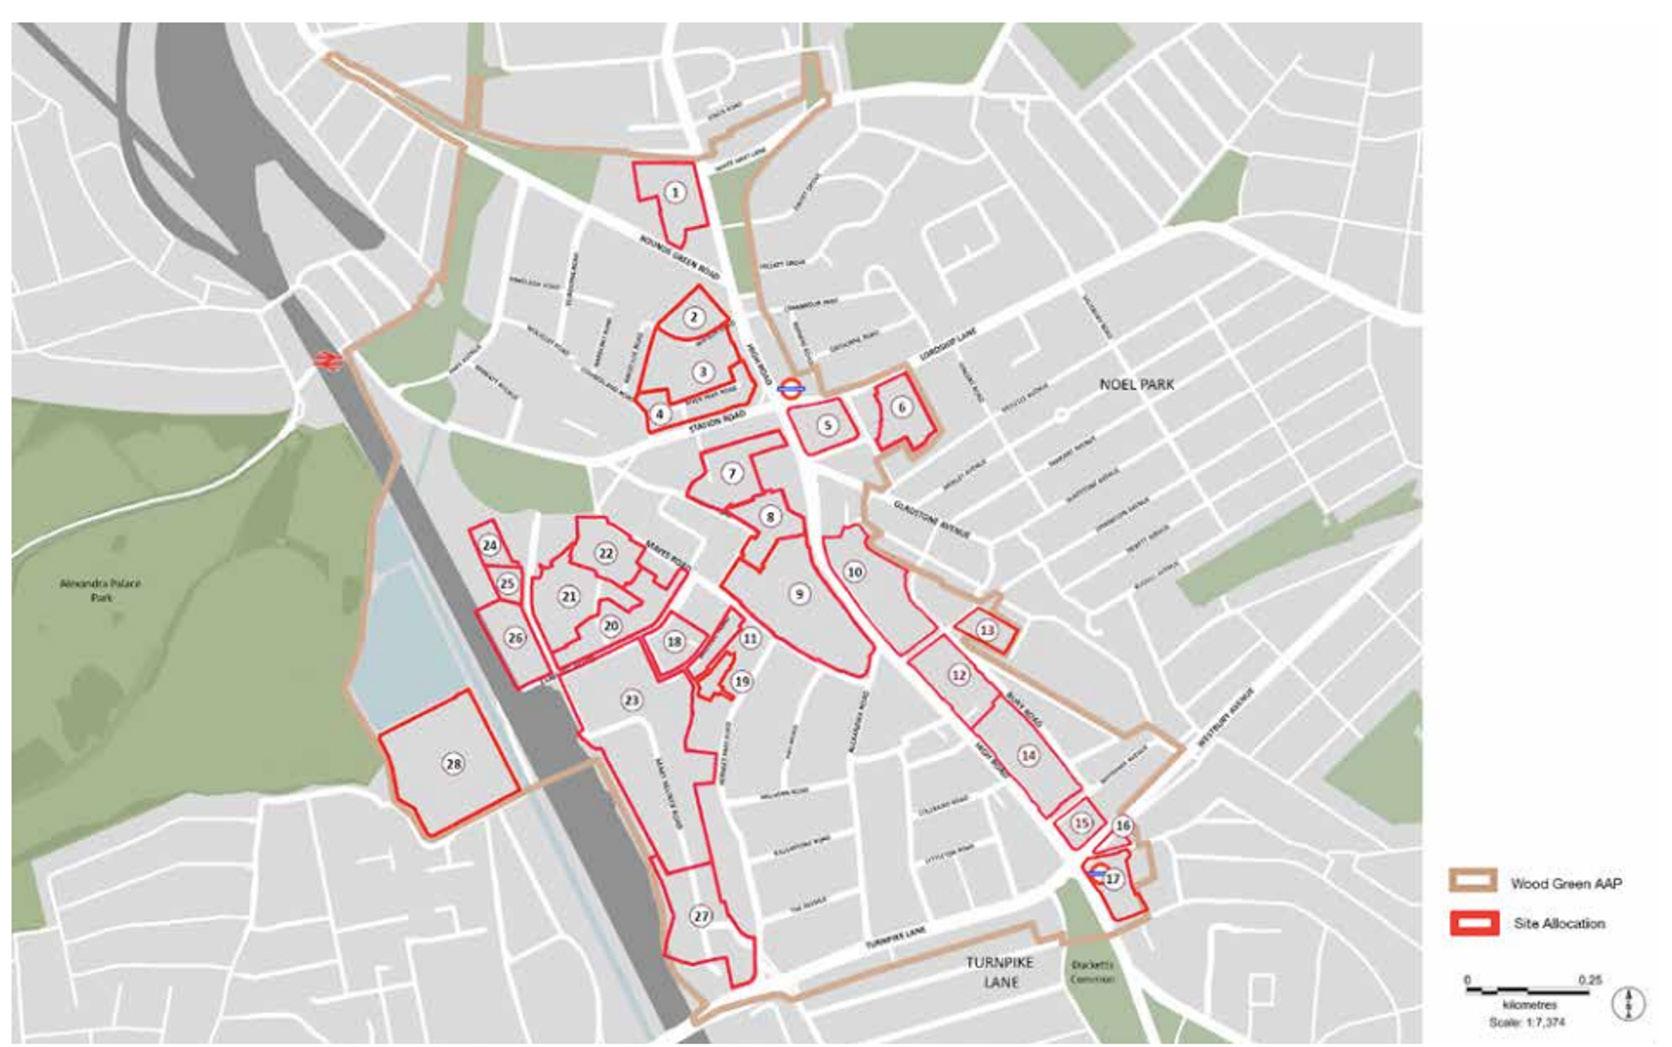
Figure 1.11.1: Haringey Council hierarchy of planning documents (HC, 2017, Figure 1.1)
Haringey Council have adopted a Strategic Regeneration Framework for Wood Green which sets out short term goals as well as the long term aspirations for the area. This document is intended to spur investment in the area and influence and integrating landowners’ plans for the area to ensure a high quality built environment is provided with a charter that benefits residents and businesses (HC, 2018C).
The key underpinning pillars of this strategy are restated below:
Better range of employment opportunities with educational offers aligned to this, to enable local residents to have the capacity to apply for a range of job opportunities. 2050” (HC, 2018D, p. 1).
Supporting Wood Green as a business destination. Revitalising the town centre to draw people from Haringey and beyond. Maintaining the authenticity of London in Wood Green.
Figure 1.11.2: Site allocations in the (HC, 2018C, Figure 8.1)
The vison contained in the Strategic Regeneration Framework is:
“Our vision is that Wood Green will become North London’s most prosperous and green town centre – a place where people can succeed and are proud to live and work. It will combine outstanding and sustainable places for people to shop, socialise and create, with a wide and varied range of businesses. It will be a focus for opportunity and growth, a productive economic capital for Haringey, where people can come together, exchange ideas and put them into action (HC, 2018C, p.6).”
Next steps
Wood Green is designated as an Opportunity Area in the London Plan (GLA, 2019A; GLA, 2016) and Haringey Local Plan (HC, 2020), and Wood Green is recognised as a Metropolitan Area which is suitable for urban regeneration. This is further recognised through the Local Plan and its SPDs.
To support this designation and put it into action, the WGAAP includes site allocations for specific plots of land which are suitable for regeneration (HC, 2018B). Of the 28 allocated site, 19 sites fall within the intervention area which is the subject of this document.
Council have specified the indicated yield of employment space (m2) and residential units for each allocated site (see Appendix). Although these sites have been allocated for regeneration, the WGAAP indicates that they should be developed only as part of a more comprehensive master plan or plans for the area (HC, 2018B).
This document provides a regeneration masterplan which realises the WGAAP site allocations, on behalf of Haringey Council and in a manner that is consistent with the underpinning pillars and vison contained in the Strategic Regeneration Framework.
12. Linkage analysis
To help provide a clearer image of what the major strengths and weaknesses of our regeneration area are, a linkage analysis is conducted to spot out the reoccurring linkages between points (see Figure 1.12.1 and Table 1.12.1). Different intervention principles are identified from previous sections, and they are followed by the suggestion of a variety of potential causes, consequences, merits, shortcomings, links, etc. These linkages are then categorised into 3 types – positive to positive (factors perceived as strengths), negative to negative (factors perceived as problems), and contradictions (factors that are in contrast with the previous strength/problem). Also, key pivot points are indicated. They are problems facing Wood Green which have more than four potential impacts. In public policy, pivot points are considered crucial locations where a small amount of change can give a large impact (Pettifor, 2019). An example is ‘road traffic’, as shown in Table 1.12.1. It shows linkages with pedestrian circulation, air quality, transportation links, efficiency of land use and quality of cycle network. By targeting pivot points, positive impacts to points could be maximised via a condensed number of interventions The linkage analysis assists the development of an overview of the strengths, weaknesses, opportunities and threats (SWOT) in two ways. First, the pivot points identified provide a foundation for us to define key dimensions for investigation. In fact, most of the ideas discussed in the pivot points reappear and are highlighted in the SWOT. Second, the linkages, especially ‘contradictions’, guide us to reflect on how the threats could be turned into opportunities. Furthermore, in our SWOT a spatial dimension is provided, which helps to visualise where the success is located and where improvement needs to happen.
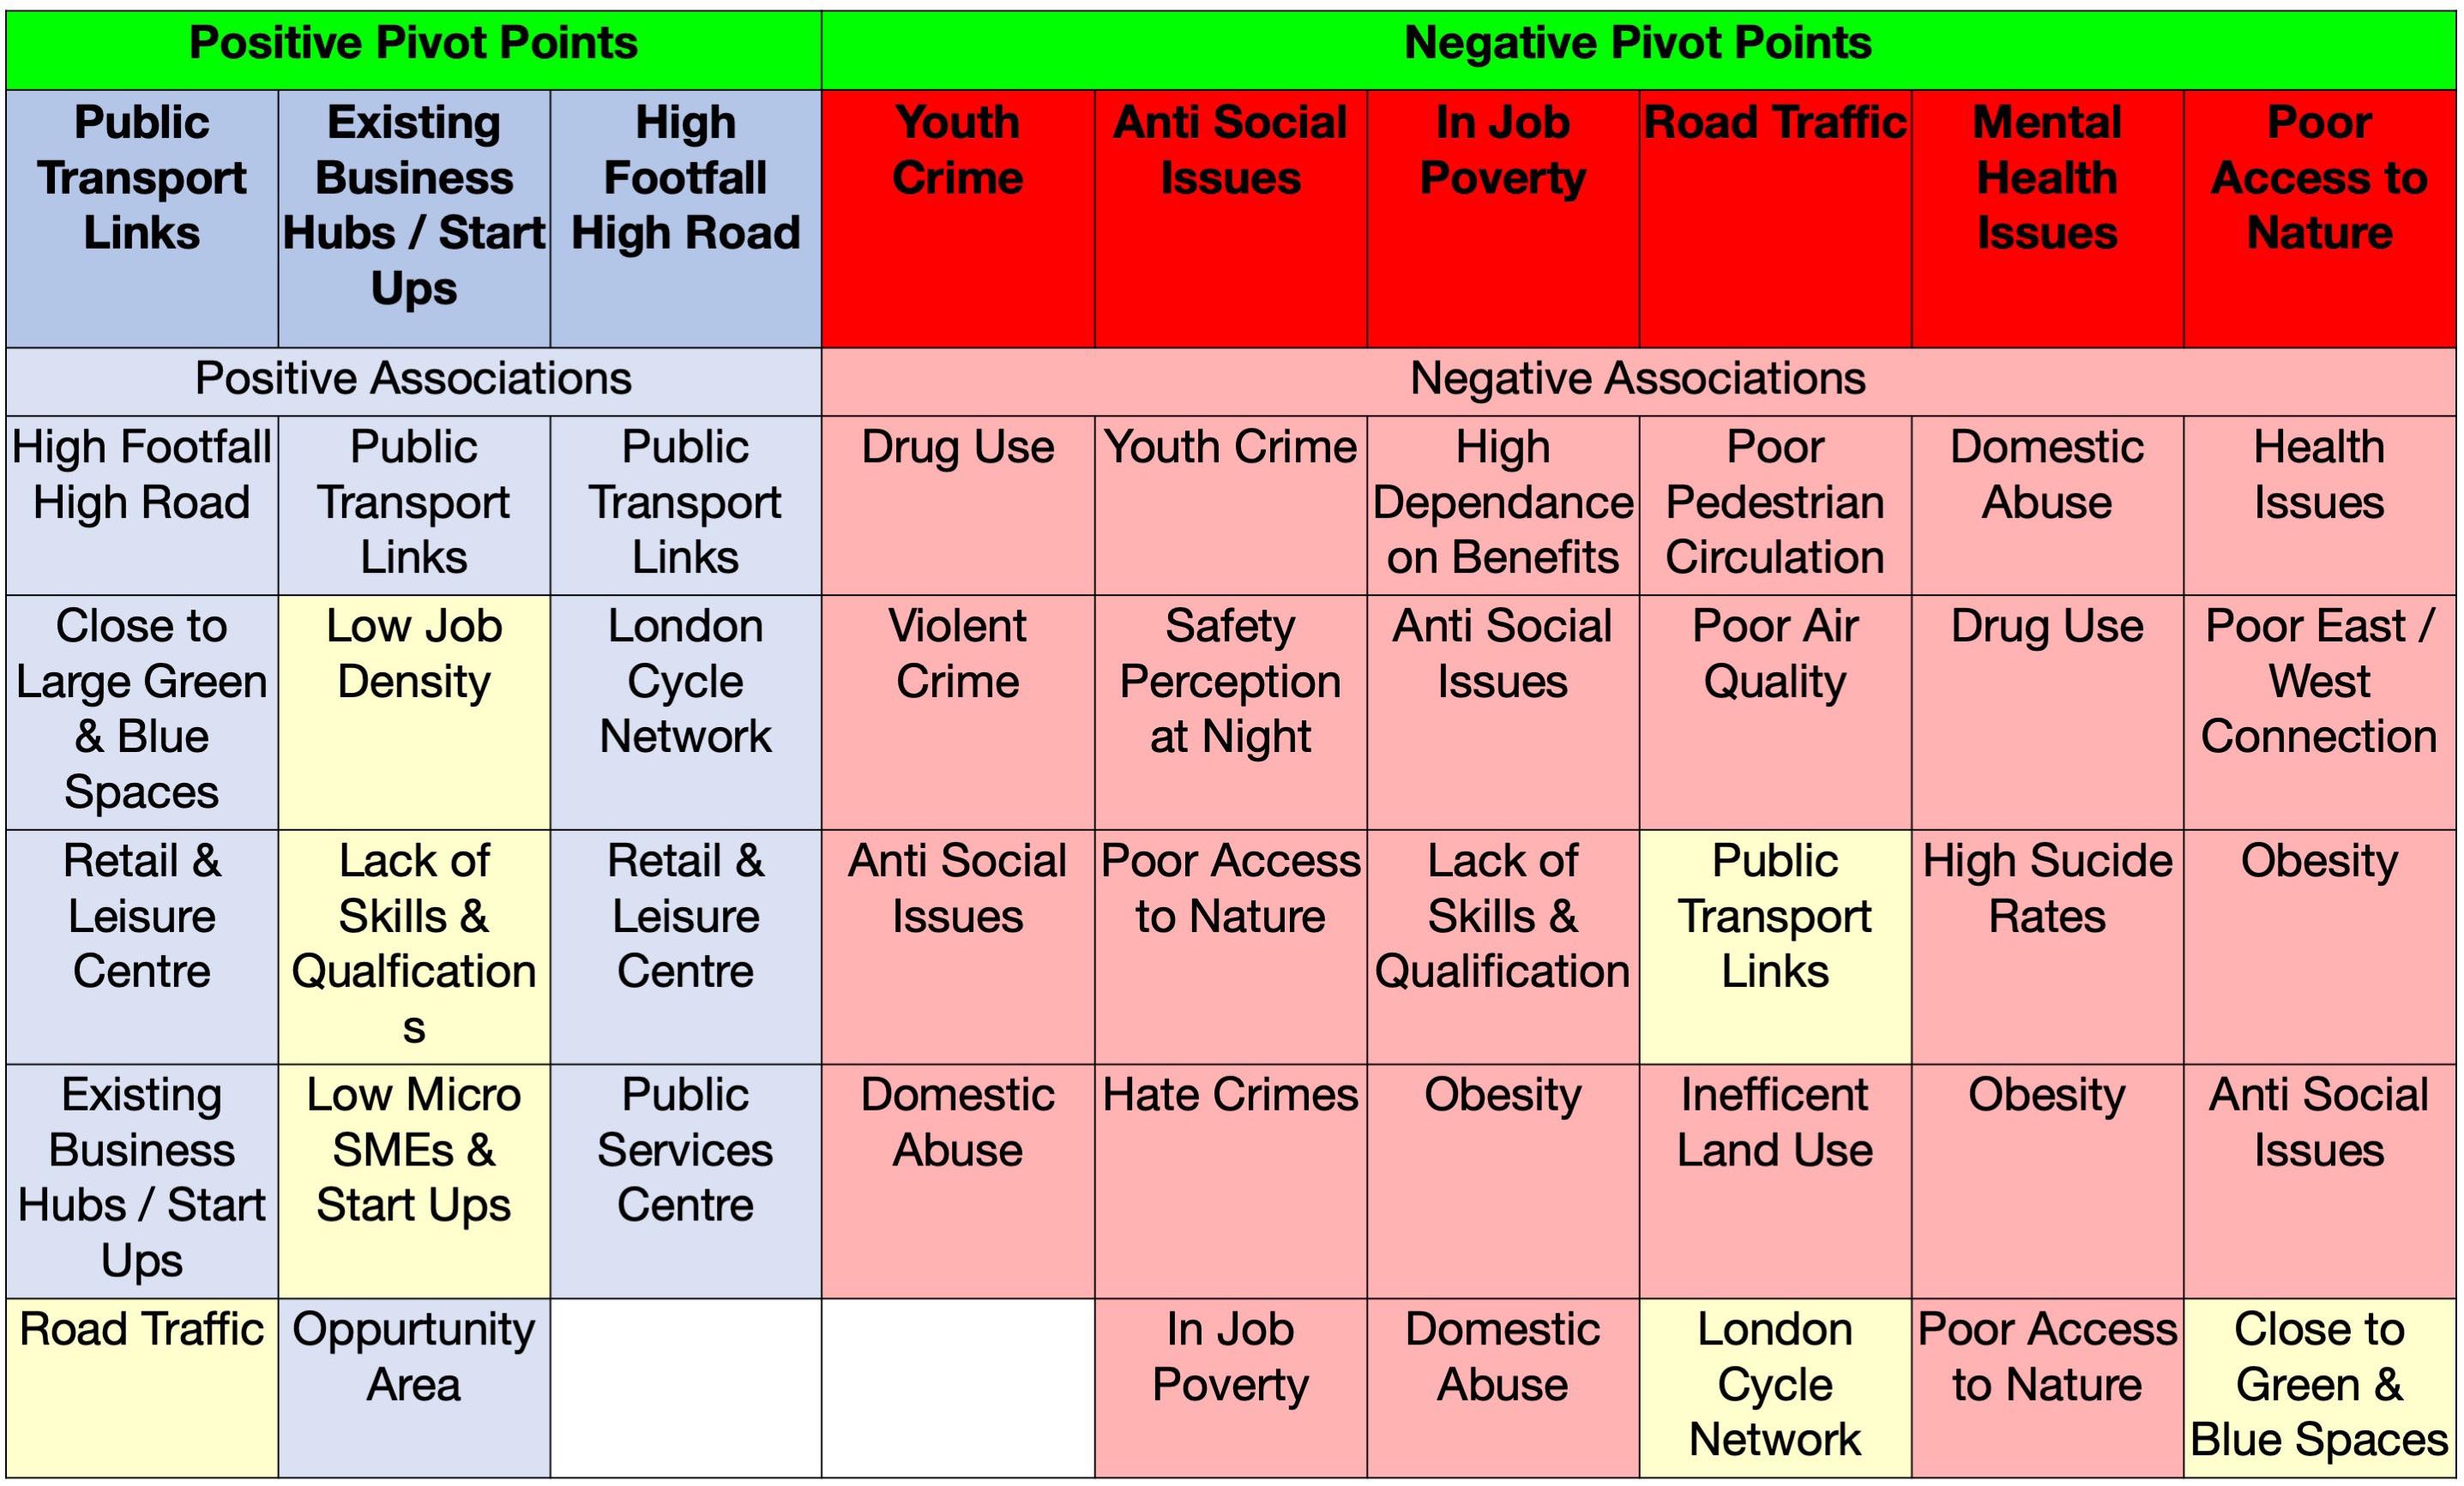
Figure 1.12.1: Linkage Diagram (Author, 2020)
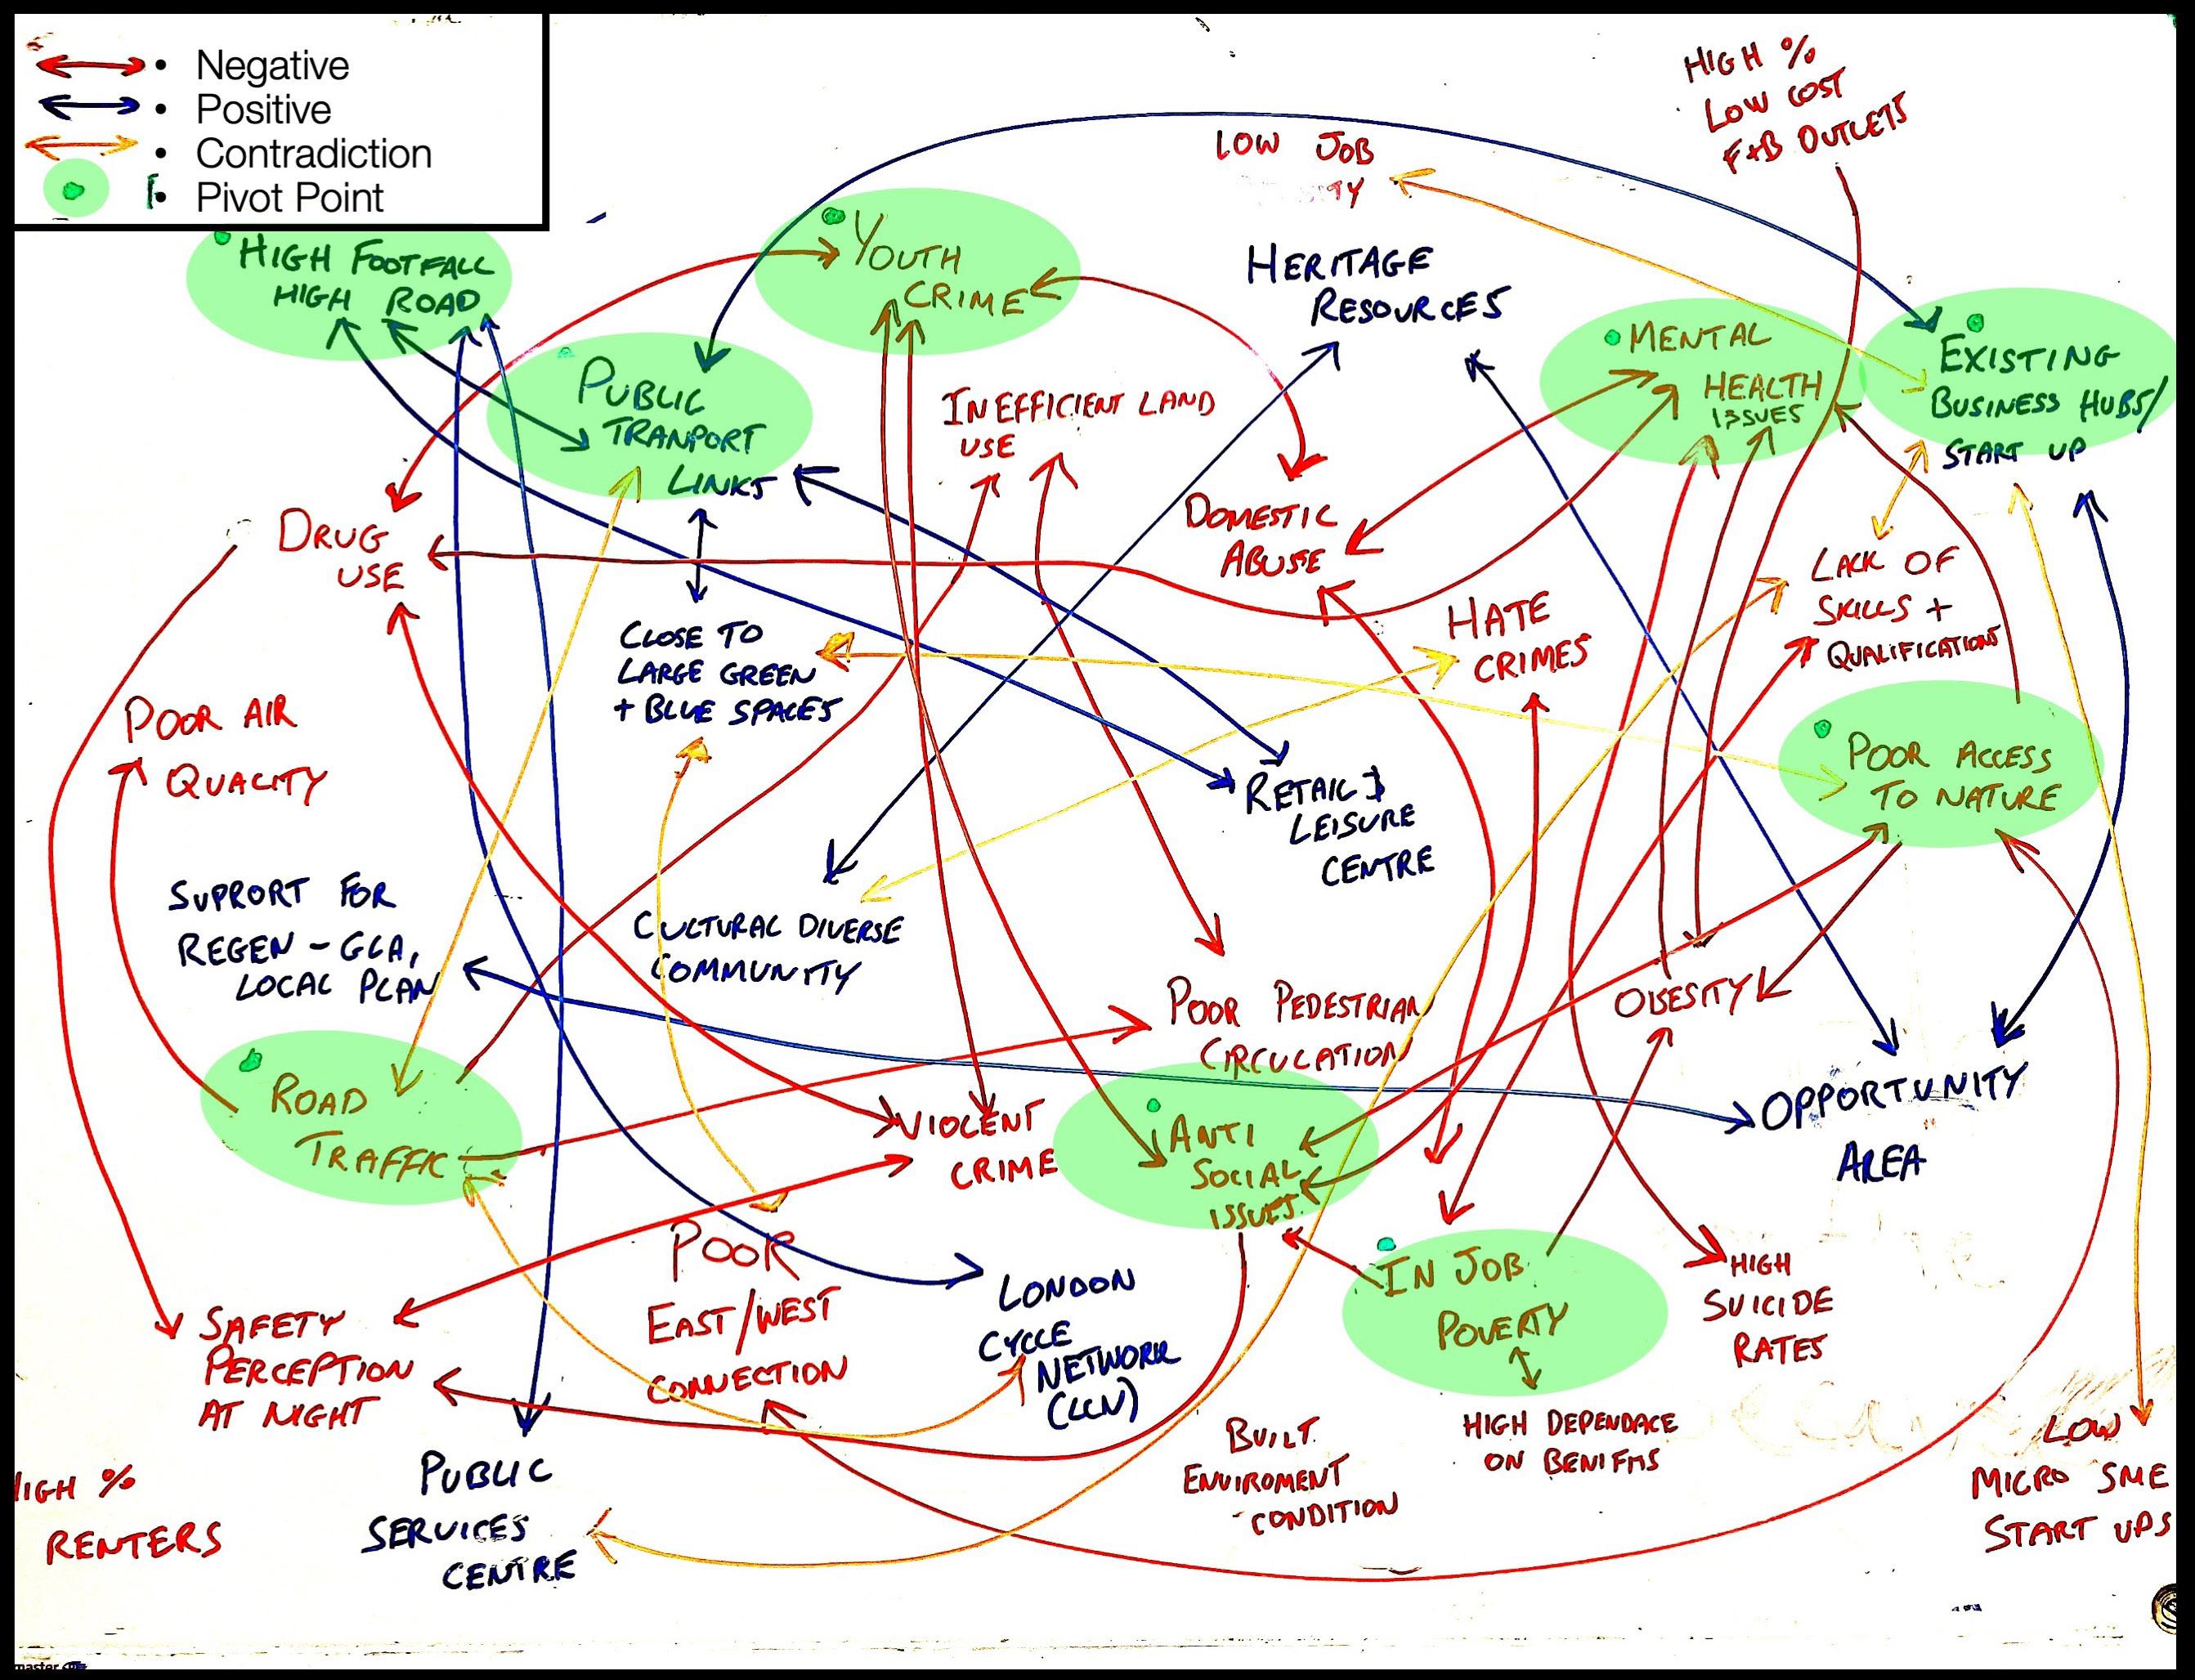
Table 1.12.1(T): Linkage Summary (Author, 2020)
In conclusion, the key strengths, weaknesses, opportunities, and threats identified in Wood Green are presented in figures 1.13.1 and 1.13.2 and a more detailed summary of these is attached in the appendix. These have been used to inform the design vision and objectives and the interventions contained is Section 2.
Strengths and Opportunities
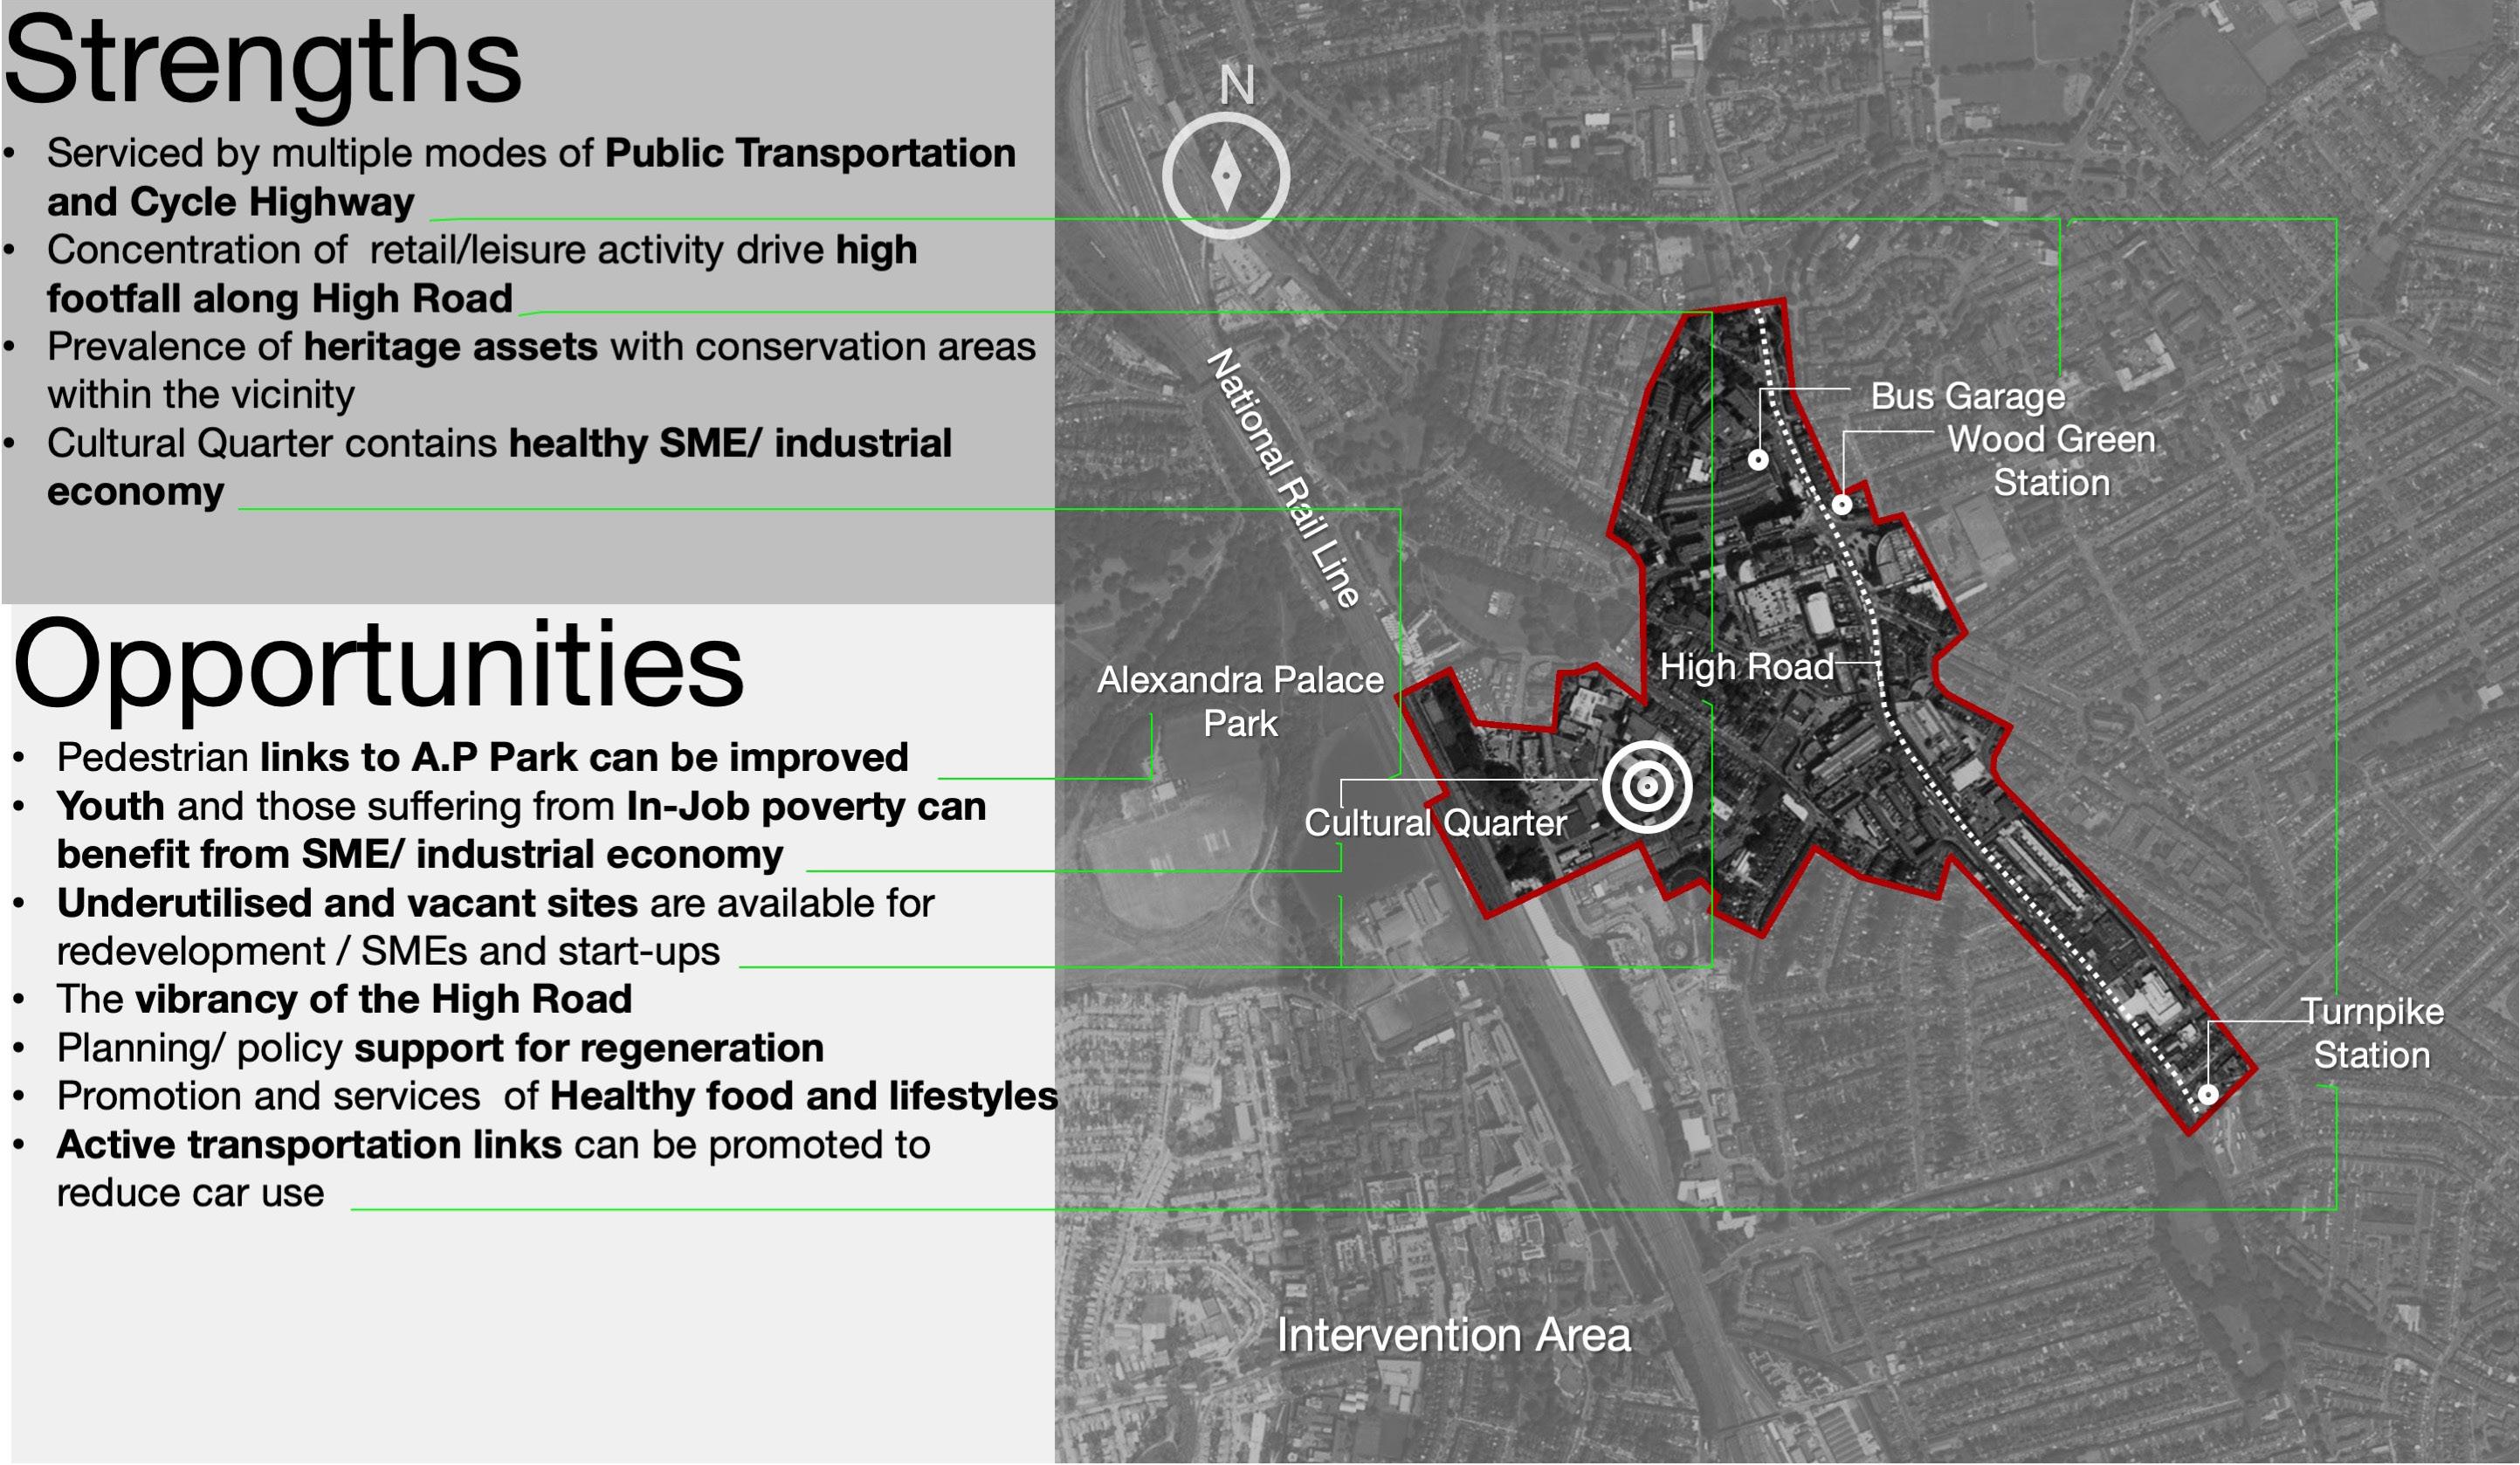
Figure 1.13.1 Strengths and Opportunities (Author, 2020)
Weaknesses and Threats
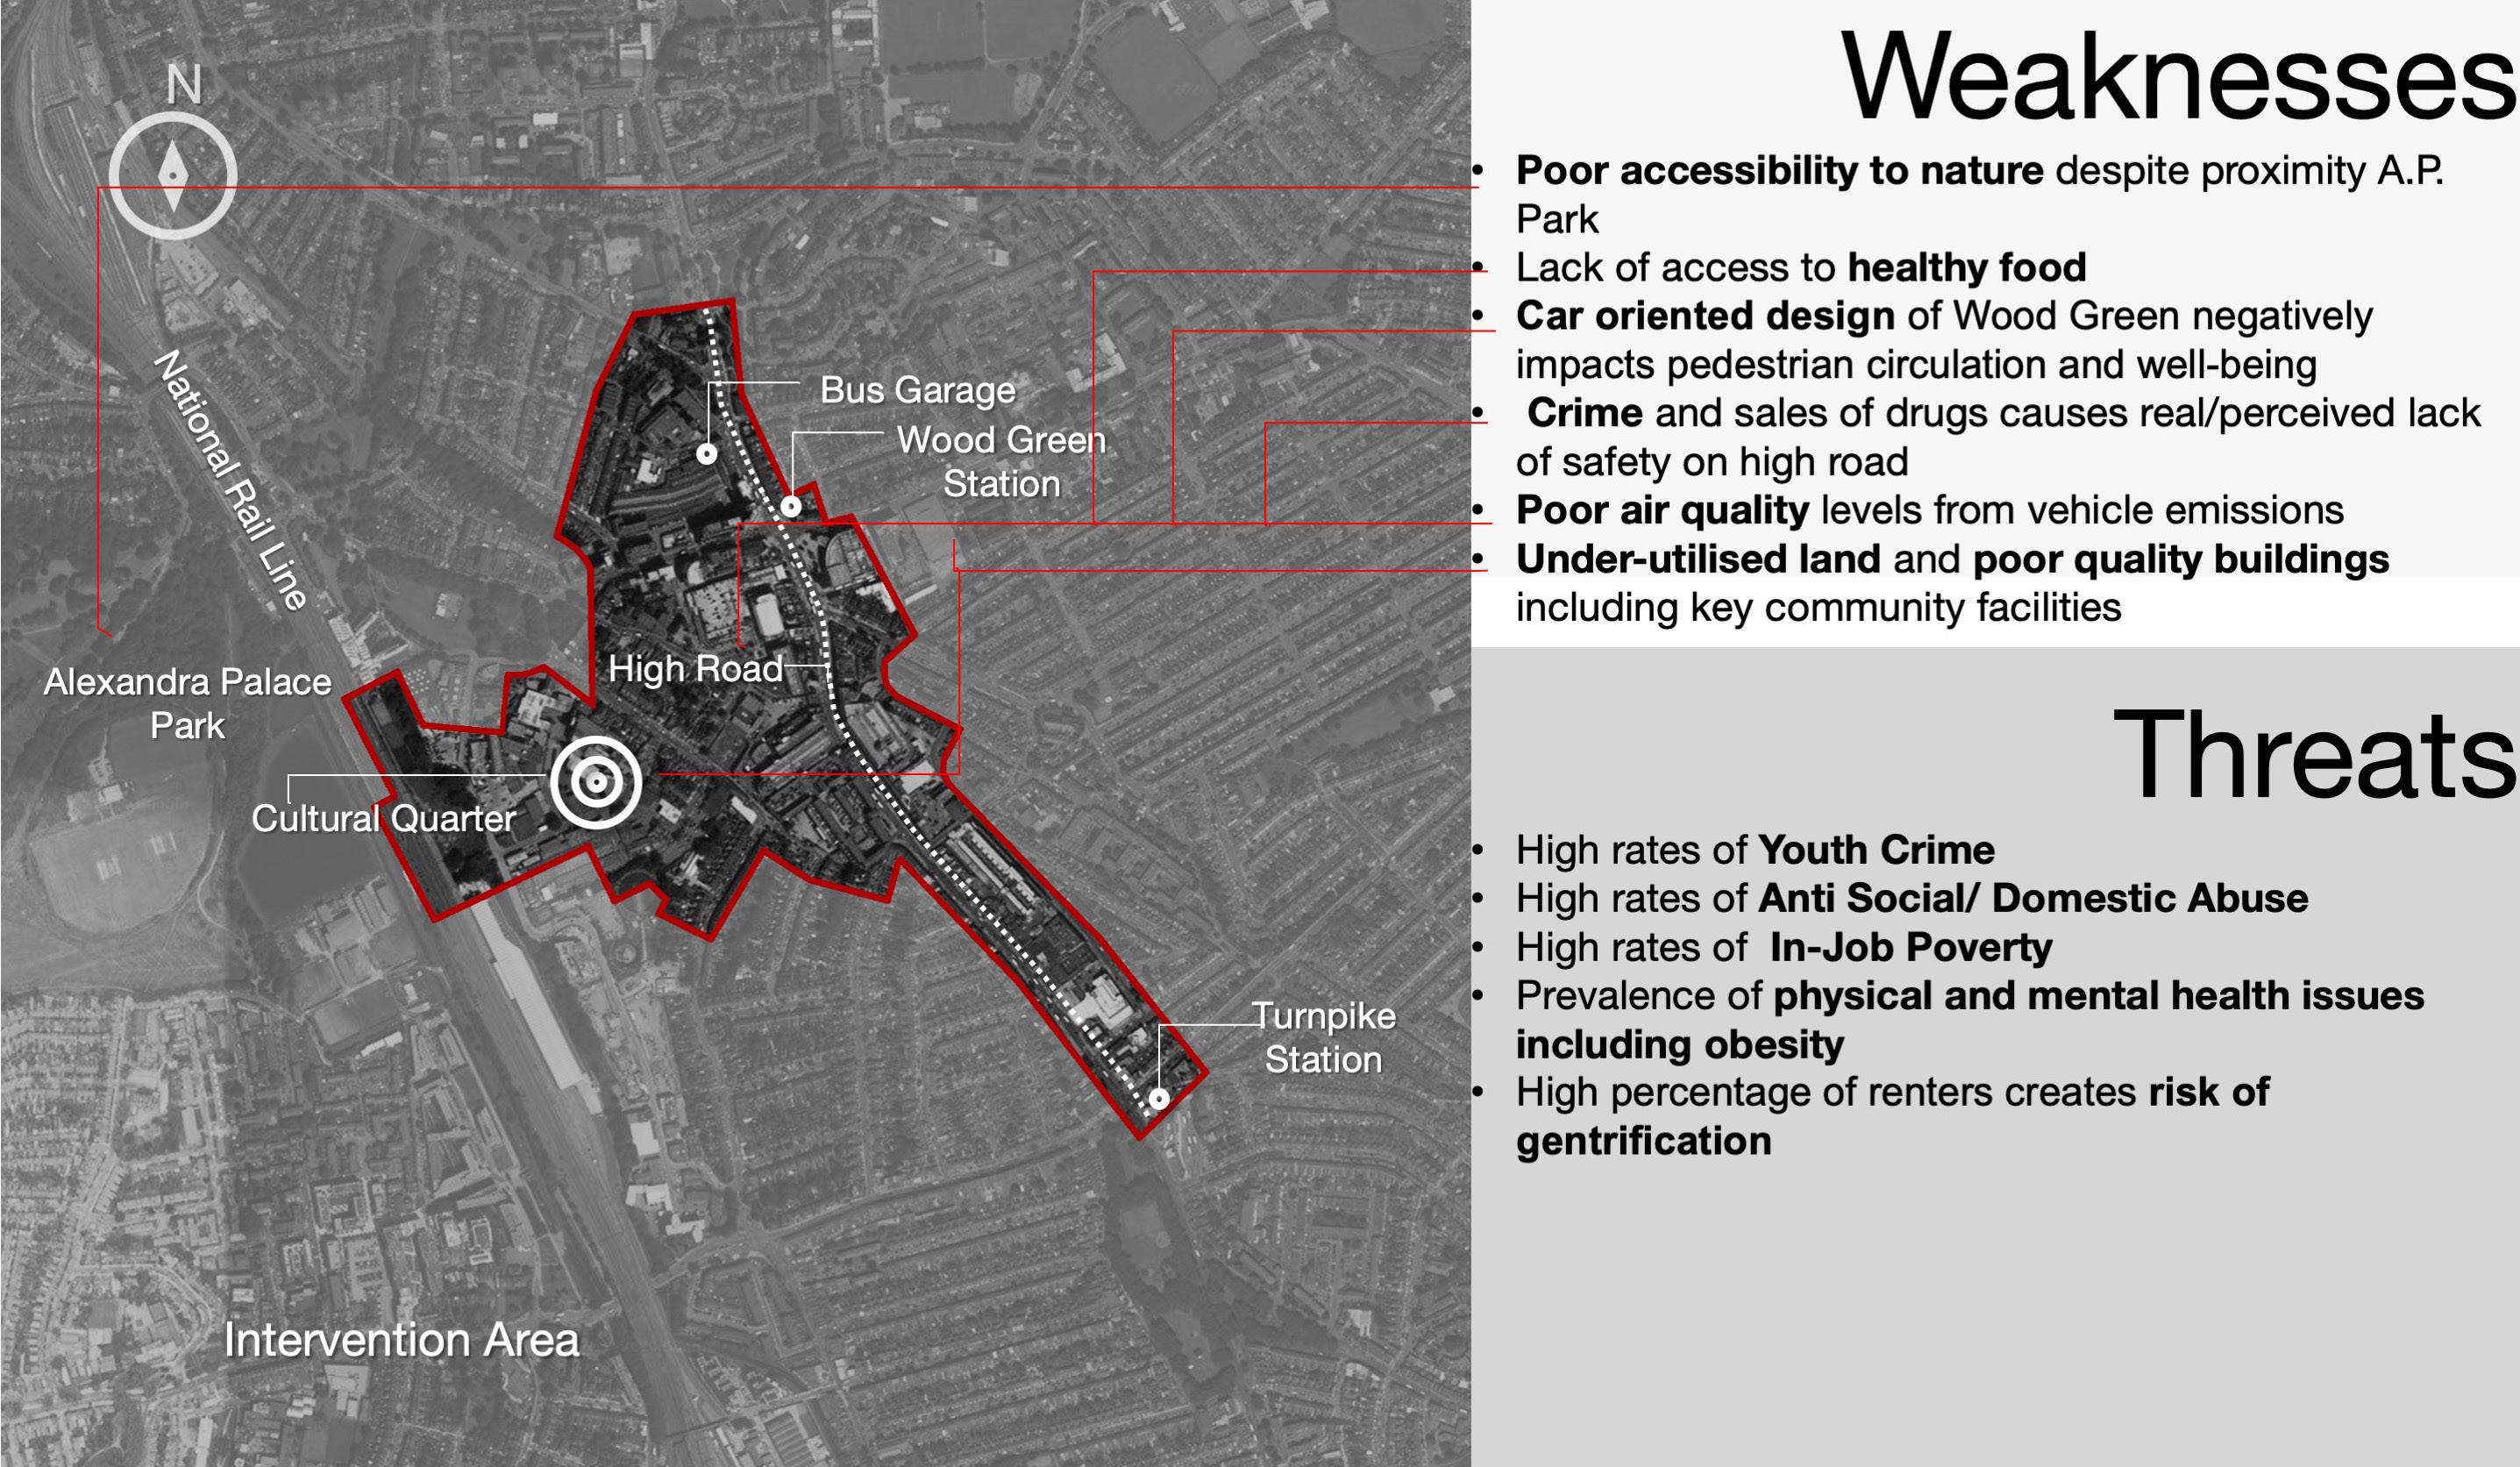
Figure 1.13.2 Weaknesses and Threats (Author, 2020)