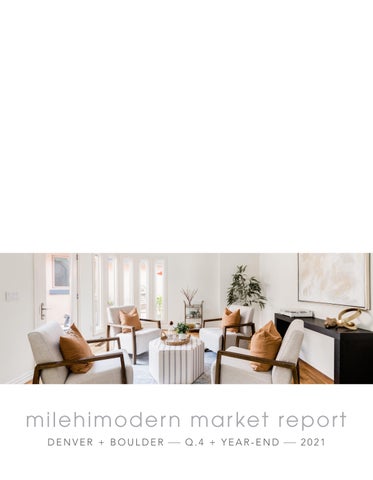
mi le h i m oder n mar ket report DENVER + BOULDER
Q.4 + YEAR-END
2021
a year of growth For the past three years, milehimodern has focused on artistry and human connection as the foundation of real estate. Now, as we enter into 2022, that informed approach, coupled with our expert brokers, has afforded us the privilege of growth as a brokerage. As the landscape of the market shifts, our brokers continue to guide our clients and offer the highest level of service. Through this report, buyers and sellers alike can begin to understand 2021’s market trends, allowing them to better prepare for another heated year ahead in Denver, Boulder and surrounding areas. In 2021 alone, our brokerage has grown to 150 brokers and has closed over 1,600 transactions, totaling roughly $1.4B in sales volume. It’s no coincidence that we have seen such explosive growth; since its inception, milehimodern has attracted accomplished brokers who command excellence. It has been a pleasure to serve our clients, and we look forward to many years of service to come as we continue to expand our footprint throughout Denver Metro and prepare to open our first office location in Boulder. Situated on iconic Pearl Street, our mhm Boulder office is set to open in February of 2022.
Thank you for allowing us to serve you!
Carmelo Paglialunga + Carla Thompson milehimodern owners
OCTOBER
Colorado Median Price $525,000
BEAMING BRILLIANCE SCULPTURAL ASCENSION
LUSTROUS ELEGANCE S TAT S
NOVEMBER
DECEMBER
$532,800
$529,995
The above Colorado data is based on counties statewide. The following Denver data is based on eleven counties in the Denver Metro Area: Adams, Arapahoe, Boulder, Broomfield, Clear Creek, Denver, Douglas, Elbert, Gilpin, Jefferson and Park. The following Boulder data is based on Boulder County.
OCTOBER
S TAT S
YOY
Active
2,351
11.0%
Sold
3,645
23.1%
$684,700
9.9%
14
39.1%
Average Sold Price Days on Market
NOVEMBER
S TAT S
YOY
Active
1,444
17.7%
Sold
3,513
7.9%
$703,847
15.0%
15
28.6%
Average Sold Price Days on Market
DECEMBER Active Sold Average Sold Price Days on Market
S TAT S
YOY
968
26.4%
3,155
12.3%
$705,753
15.6%
19
5.0%
denver
OCTOBER
S TAT S
YOY
Active
265
53.8%
Sold
350
14.2%
$1,020,934
19.0%
33
15.4%
Average Sold Price Days on Market
NOVEMBER
S TAT S
YOY
Active
176
60.4%
Sold
304
20.8%
$1,013,364
28.6%
36
7.7%
Average Sold Price Days on Market
DECEMBER
S TAT S
YOY
Active
120
26.8%
Sold
241
24.0%
$985,387
15.4%
41
14.6%
Average Sold Price Days on Market
boulder
U LT R A - L U X U R Y
$2M+
Active
426
27.29%
Under Contract
102
36.16%
Sold
118
15.01%
$3,161,087
5.58%
59
9.09%
Average Sold Price Days on Market
LUXURY
$1M-$2M 634
46.76%
Under Contract
398
38.44%
Sold
510
18.63%
$1,319,640
1.20%
28
32.94%
Days on Market
PREMIER
$500K-$1M
Q3 TO Q4
Active
2,396
42.37%
Under Contract
2,984
26.09%
Sold
3,583
12.61%
$657,534
0.36%
18
29.09%
Average Sold Price Days on Market
q4 average +
Q3 TO Q4
Active
Average Sold Price
DENVER
Q3 TO Q4
BOULDER
q4 summary Since Q3 2021, buyers have seen a gentle reprieve from the heated summer and fall months with increased days on market across the board, but it was still a competitive time to be searching for a home. The importance of working with an experienced, transaction-savvy broker has never been more prominent than within this historic moment of the industry. Sellers are still experiencing advantageous numbers with record-low inventory. Since last quarter, the Ultra-Luxury Market saw a 27.29% decrease in inventory. The Luxury Market and Premier Market followed suit with a 46.76% and 42.37% decrease, respectively.
year-end summary Ever since our humble beginnings in 2019, we have experienced a spectrum of formidable industry challenges from worldwide shutdowns to recordbreaking low inventories. This past year was no different, with low interest rates fueling buyer demand. Year-over-year, prices have increased across the board in the state of Colorado with a 17.25% jump since Q4 2020. Buyers may face additional challenges in 2022 with forecasted interest rate increases and competition fueled by Colorado’s coveted lifestyle. Since 2020, homes in the Premier, Luxury and UltraLuxury Markets spent 53.23%, 43.89% and 37.69% less time on market, respectively. Despite how favorable these numbers may seem to sellers, buyers equipped with a fierce broker advocate may succeed in this heated market with creative negotiation tactics and financing solutions.
ULTRA-LUXURY — $2M+
2020
2021
Active
7,425
5,246
29.35%
762
1,410
85.04%
$2,863,344
$3,002,337
4.85%
100
62
37.69%
L U XURY — $1M -2M
2020
2021
Active
15,563
8,014
48.51%
3,806
6,224
63.53%
$1,318,228
$1,332,381
1.07%
Average Days on Market
60
34
43.89%
PREMIER — $500K-1M
2020
2021
Active
50,785
26,583
47.66%
Sold
28,146
40,038
42.25%
$645,745
$657,673
1.85%
37
18
53.23%
Sold Average Sold Price Average Days on Market
Sold Average Sold Price
Average Sold Price Average Days on Market
YOY
YOY
YOY
year-end stats DENVER
+
BOULDER
who we are milehimodern (mhm) is Colorado’s premier real estate brokerage focused on the artistry of living. We believe in connection first; every home has a soul-filled story to tell. Our purpose is to bring this story to light by discovering the artistic sizzle, the iconic value, the extraordinary architecture, or simply the narrative of a beautiful life lived in each property. Let us tell your story.
This data is collected from the following sources: Colorado Association of Realtors®, Denver Metro Association of Realtors® + REcolorado®. This material is based upon information that we consider reliable, but because it has been supplied by third parties, we cannot represent that it is accurate or complete. ©MileHiModern All Rights Reserved | 303.876.1073 milehimodern.com | MileHiModern® is a licensed trademark | An Equal Opportunity Company | Equal Housing Opportunity .