
Like individual blossoms forming a resilient landscape, RIMI-funded research projects across California do not stand alone. They work in concert—across regions, disciplines, and the University of California Institute of Transportation Studies campuses (Berkeley, Davis, Irvine, and UCLA)—to accelerate innovation and move research into real-world policy and practice.
Together, these efforts generate systemlevel improvements. They advance mobility, strengthen resilience, and support sustainability and equitable outcomes, while helping to preserve California’s natural beauty, environmental quality, and long-term economic vitality.

Susan Shaheen, PhD
Resilient and Innovative Mobility Initiative (RIMI) Director University of California Institute of Transportation Studies (UC ITS)
The University of California Institute of Transportation Studies (UC ITS) is pleased to present the RIMI 10x Magazine, highlighting the Resilient and Innovative Mobility Initiative (RIMI)—a four-year, $10 million research effort launched in 2021 with one-time funding from the State of California. This initiative was designed to catalyze bold ideas, accelerate innovation, and translate research into actionable transportation policy and practice.
The magazine features 10 stories that highlight the breadth and impact of RIMI’s work across the UC ITS campuses— Berkeley, Davis, Irvine, and UCLA. It also draws on related research funded through the UC ITS SB1 program, established by California’s Road Repair and Accountability Act of 2017, along with additional studies by UC ITS scholars and the broader research literature. Together, these efforts demonstrate how targeted research can achieve a 10x impact— shaping policy, influencing practice, and scaling solutions to California’s complex transportation challenges, from decarbonization to bolstering public transit and road safety. For policymakers, planners, and agency leaders, this magazine provides a roadmap for translating research into long-lasting, system-level improvements.
California’s transportation system is at a critical juncture. Past assumptions—cheap driving, abundant road space, predictable travel, and resilient infrastructure— no longer hold. Climate change, technological disruption, inequality, and shifting travel patterns reveal the fragility of systems built for an earlier era. RIMI research underscores that transportation policy must move beyond innovation to implementation that delivers durable benefits, including affordability, safety, resilience, and emission reductions at scale. This takeaway maps to five stories: Making Public Transit Work Means Managing the Road (Page 16), What It Will Take to Put Public Transit on Solid Ground (Page 20), California’s Road to Electric Vehicles (Page 24), Plugged In: the Future of Electric Vehicles and the Electric Grid (Page 36), and Bridging the Gap: Ridehailing as Public Transit’s Partner and Competitor (Page 28).

Decarbonization
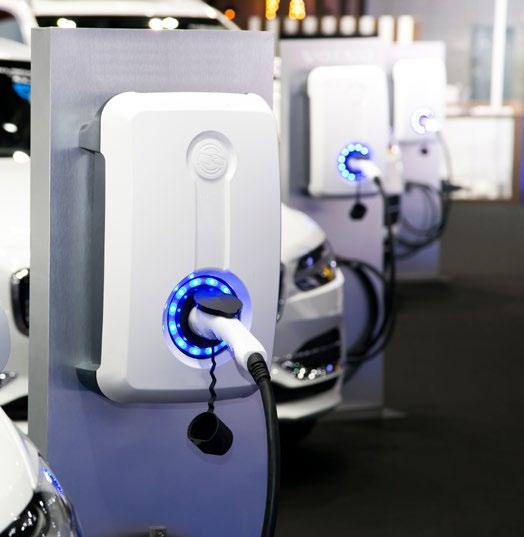
While low-carbon transportation is advancing, progress is uneven. Electric vehicles are growing in popularity, but barriers—limited charging access, high costs, and policy uncertainty—shape who benefits. Sectors like trucking, shipping, and aviation face even steeper challenges, requiring batteries, hydrogen, and lowcarbon fuels. Electrification also places new demands on California’s energy system. Coordinated planning and smart charging can ensure decarbonization supports reliability, affordability, and cleaner air, particularly for communities most exposed to pollution. This takeaway maps to three stories: California’s Road to Electric Vehicles (Page 24), Plugged In: The Future of Electric Vehicles and the Electric Grid (Page 36), and From Ports to Planes (Page 40).

Wildfires, earthquakes, and other disruptions show that resilience depends as much on coordination, communication, and trust as on engineering. Recovery outcomes—and who bears the burden—are determined by planning made long before disasters strike. Resilience requires treating disruption as a normal condition rather than an exception. This takeaway maps to one story: The State of Resilience: Preparing for Earthquakes & Wildfires (Page 12).
Traffic deaths continue to rise despite vehicle safety improvements. Slower speeds, lighter vehicles, and redesigned streets save lives. Expanding road capacity often worsens congestion and emissions. Pairing capacity limits with pricing, curb management, and public transit and housing investments can reduce congestion, improve public health, and reclaim street space for people. This takeaway maps to three stories: Can Building Fewer Roads Mean Less Traffic? (Page 8), Making Public Transit Work Means Managing the Road (Page 16), and Rethinking Road Safety: How California Can Reach Zero Deaths (Page 32).
Transit faces uneven ridership recovery, rising costs, and fiscal pressures. Strengthening transit requires aligning land use with service, simplifying fares, and reinvesting in reliability and quality. Public transit cannot thrive in an autocentric environment; pricing driving, coordinating land use, and limiting vehicle access in dense areas can complement transit, making it a more competitive, attractive option. This takeaway maps to three stories: Making Public Transit Work Means Managing the Road (Page 16), What It Will Take to Put Transit on Solid Ground (Page 20), and Bridging the Gap: Ridehailing as Public Transit’s Partner and Competitor (Page 28).
Ridehailing, microtransit, and shared micromobility add complexity. They can provide first- and last-mile connections, but they may draw riders from transit or increase congestion if not managed. Effective integration with existing public transit, guided by policy, pricing, and partnerships, can expand access, support transit agencies, and improve overall system performance, especially as automation reshapes mobility services. This takeaway maps to one story: Bridging the Gap: Ridehailing as Public Transit’s Partner and Competitor (Page 28).
Transportation workers—from public transit operators to gig workers—face staffing shortages, safety concerns, and unstable conditions. A reliable, equitable system depends on supporting these workers through training, protections, and pathways to adapt alongside emerging technologies, such as automation and artificial intelligence. This takeaway maps to two stories: What it Will Take to Put Transit on Solid Ground (Page 20) and What Comes After the Gig Drivers’ Latest Deal (Page 44).
California’s transportation challenges are deeply interconnected. Creating a cleaner, safer, and more equitable system requires coordinated action across technology, pricing, land use, labor, and governance. This magazine offers a roadmap—not a silver bullet—for managing uncertainty, implementing evidence-based policies, and applying research insights to real-world challenges. Partnerships across public agencies, private organizations, and communities will be essential to deliver transportation that serves the public good. This takeaway maps to all 10x stories.


On any given weekend, hundreds of walkers, cyclists, and skaters flock to San Francisco’s Sunset Dunes Park to walk, run, and cycle to the backdrop of crashing waves at Ocean Beach. Sunset Dunes was created by a 2024 local ballot initiative (Proposition K) that was particularly divisive because it closed a two-mile stretch of a major coastal thoroughfare—the Upper Great Highway. While the issue has divided locals in adjacent neighborhoods, both sides may soon notice some surprising benefits of the reduced road capacity.
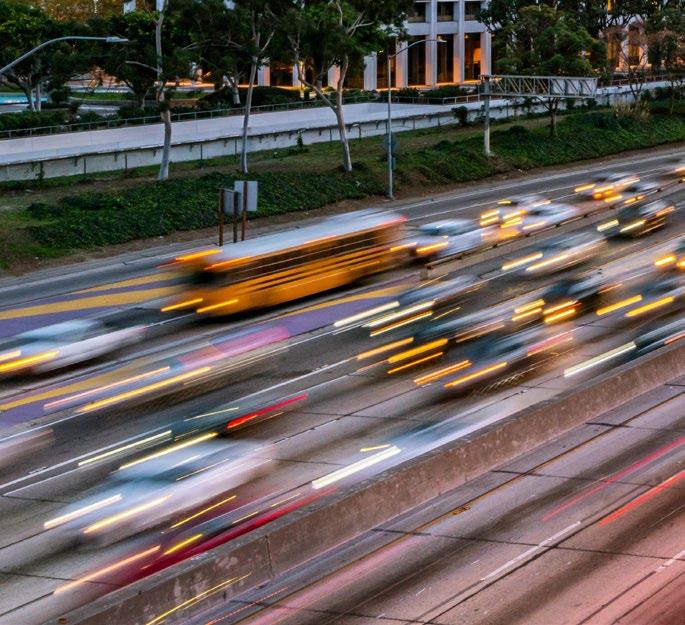
California has committed to reaching zero net greenhouse gas (GHG) emissions by 2045. Achieving that goal will depend on electric vehicle (EV) adoption but also on reducing total vehicle miles traveled (VMT), as highlighted in the California Air Resources Board’s AB 32 Scoping Plan, adopted in 2022. Researchers at the University of California’s Resilient Innovative Mobility Initiative (RIMI) find that the best ways to achieve these emission reductions are to limit roadway expansion, promote alternative transportation modes, and implement charges for drivers using congested roads.
“We often use congestion as an excuse to expand roadways, but it doesn’t alleviate the problem in the long term.”
Interstate 405 (I-405) in Los Angeles has long been among the busiest freeways in the United States. To ease congestion, decrease travel times, and improve air quality along I-405, the California Department of Transportation (Caltrans) and the Los Angeles County Metropolitan Authority (LA Metro) launched the I-405 Sepulveda Pass Widening Project in 2010. When completed in 2015, the project had substantially increased vehicle capacity by improving access ramps, widening lanes, and adding a high-occupancy vehicle (HOV) lane. Just a few years after the $1.6 billion project was completed, local data journalists reported1 that commute times had actually increased.
“We often use congestion as an excuse to expand roadways, but it doesn’t alleviate the problem in the long term,” says Jamey Volker, an assistant professional researcher with the UC Davis Institute of Transportation Studies.
Volker studies induced travel, a concept related to the economic principle of induced demand. His research shows when roadways are expanded, vehicle speeds increase and travel times decrease. This lowers the perceived cost of driving, making it more attractive, which in turn leads to more trips and ultimately greater congestion. Volker’s research synthesis found that for every 1% increase in road capacity, VMT often increases by a similar amount, particularly on interstate highways and other major roadways. Because the emission reductions from expansion projects rely mainly on higher vehicle speeds, Volker concludes that these projects consistently overestimate congestion relief and air quality benefits.
In a recent report,2 Volker presents the California Induced Travel Calculator, a publicly available tool that state transportation agencies and others can use to estimate how roadway expansions may increase VMT. In an earlier review of the environmental impact analyses for capacity expansion projects,3 he found that most did not fully account for induced travel. The calculator captures the feedback loop in which expanding road capacity leads to increased VMT.
Volker notes that limiting road expansion is one of the best ways to reduce overall VMT. However, in a review4 of multiple studies, he found that road pricing strategies, such as tolls and cordon pricing, can also significantly reduce urban congestion, but only if the pricing is set at the right level. Volker points to San Francisco, where vehicles entering the city via bridges are charged tolls. He notes that the current tolls, ranging between $8 to $10.75 for solo drivers, would need to be higher to meaningfully reduce congestion. The San Francisco County Transportation Authority has also studied implementing a downtown cordon fee, though that research is currently on hold.
Caltrans is already testing a road usage charge (RUC) that would apply to all drivers in the state based on the number of miles they drive. This program is intended to supplement gas tax revenue, which is gradually declining as EV adoption grows. However, it raises significant equity concerns: low-income drivers—many of whom work jobs that don’t allow them to change their driving behaviors— could end up paying gas taxes and road usage fees that they cannot afford.
Susan Shaheen, a professor of civil and environmental engineering at UC Berkeley and director of RIMI, studied5 the equity implications of road pricing. Her research suggests that RUC cannot be applied as a one-sizefits-all solution. RUC should vary based on factors such as urban versus rural locations and high-income versus low-income drivers. She also notes that private operators, such as ridehailing services like Uber and Lyft or robotaxis, should contribute their share, as they benefit from wellmaintained roads.
“A uniform road use fee cannot address the very different realities facing rural, urban, low-income, and high-income travelers,” says Shaheen. “And ensuring that ridehailing services invest in the infrastructure they rely on is critical to creating a more equitable transportation system.”
The California Environmental Quality Act (CEQA) requires cities, counties, and public agencies to assess the environmental impacts of all new projects. When evaluating transportation projects, assessments use the state’s VMT and GHG emission reduction goals as benchmarks. Projects expected to significantly increase
VMT must mitigate these effects when feasible, though onsite mitigation isn’t always possible. Research by Ethan Elkind, director of the climate program at the UC Berkeley Center for Law, Energy & the Environment, explored6 a possible solution. Projects unable to achieve onsite VMT reductions can instead contribute to VMT banks, which fund off-site mitigation projects.
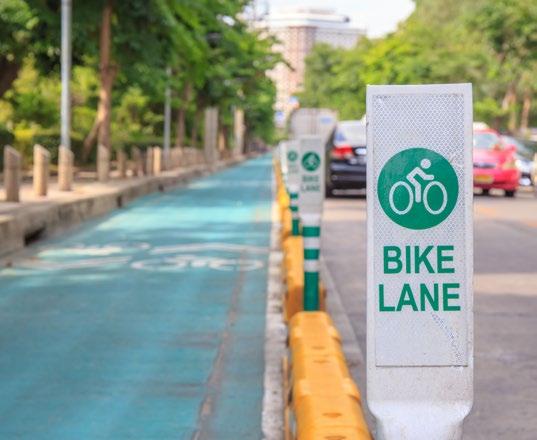
California’s AB 130, signed into law on June 30, 2025, established a statewide VMT mitigation bank to fund housing or related infrastructure projects. Since 2024, LA Metro has been experimenting with its own VMT bank pilot. Under this pilot, all new highway projects in Los Angeles County must calculate the expected increase in induced VMT and purchase corresponding VMT credits from LA Metro. Revenue from credit sales is used to fund projects that reduce VMT, such as public transit improvements in high-density, mixed-use neighborhoods, and affordable housing near transit hubs. Projects receiving mitigation funding must demonstrate measurable VMT reduction potential and meet LA Metro’s equity guidelines. Elkind says an equity focus is crucial for VMT banks to avoid highway expansion projects in low-income neighborhoods that then fund bike lanes in wealthy ones.
“We need VMT banks to fund tried-and-true VMTreducing projects like affordable housing near public transit—projects that wouldn’t otherwise be funded,” says Elkind.
Adam Millard-Ball, professor of urban planning at the UCLA Luskin School of Public Affairs, notes that while funding public transit provides countless social benefits, transit alone is unlikely to deliver sizable reductions in VMT. That’s especially true for services that run parallel to congested freeways because drivers who switch to public transit only make room for new drivers. MillardBall asserts that limiting roadway expansion must be the central strategy in any plan aimed at reducing VMT and GHG emissions.
In a recent study,7 Millard-Ball analyzed historic VMT trends in California and across the United States. He found that during the second half of the 20th century, VMT growth closely tracked rising incomes. Since the early 2000s, however, VMT has continued to grow in absolute terms while remaining stable on a per capita basis. This demonstrates that driving rates are no longer directly tied to income growth, but they are influenced by other factors such as induced demand.
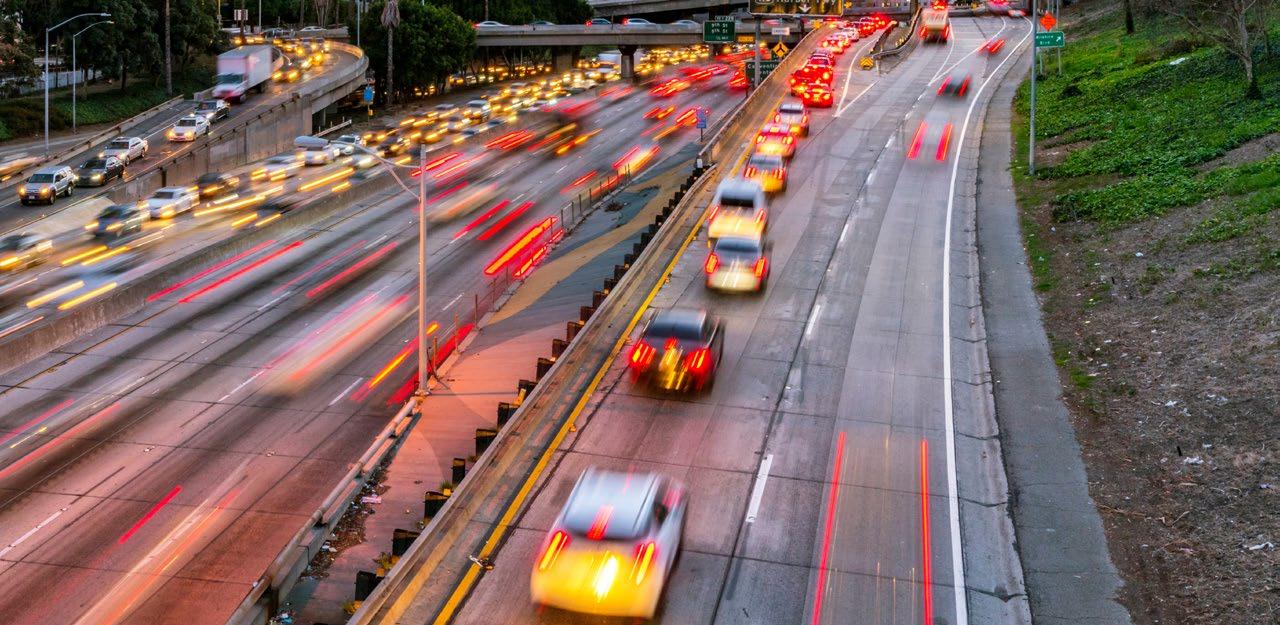
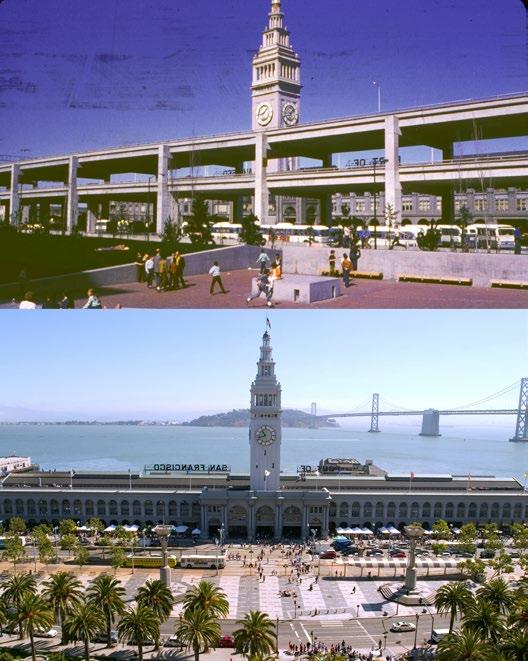
Millard-Ball doesn’t suggest that reducing roadway capacity should be the ultimate goal. Rather, he sees it as one component of broader strategies aimed at improving quality of life. He points to the removal of San Francisco’s double-decker Embarcadero Freeway, which ran along the city’s waterfront and blocked views of historic sites like the Ferry Building. After the freeway was extensively damaged in the 1989 Loma Prieta earthquake and subsequently removed, the Ferry Building was restored, and tourism and investment along the waterfront increased.
“Removing freeways allows communities to pursue other goals like building new housing and parks or reducing noise and air pollution.”
Adam
Millard-Ball, Ph.D., UCLA Institute of Transportation Studies
“Removing freeways allows communities to pursue other goals like building new housing and parks or reducing noise and air pollution,” says Millard-Ball.
Sunset Dunes illustrates a strategy of pursuing multiple goals while highlighting the need for communities to balance competing impacts when changes in capacity occur. Proposition K was approved with 54.73% of the vote, but the issue remained so divisive that the city supervisor who sponsored the ballot initiative was swiftly recalled by his constituents.
Despite ongoing controversy, San Francisco Recreation and Parks reported8 that visitation to Sunset Dunes
continues to rise. The San Francisco Municipal Transportation Agency found9 that while traffic had increased on some roads, it has decreased on others and has not caused gridlock on the city’s west side. Like the removal of the Embarcadero Freeway, residents and visitors appear to be adjusting to life without the Upper Great Highway.
1 Kahn, G. (2019, May 2). The Sepulveda Pass’s failing grade. Crosstown. https://xtown.la/2019/05/02/the-sepulveda-passs-failing-grade/
2 Volker, J. M. B., & Handy, S. L. (2022). Updating the Induced Travel Calculator (Research Report No. NCST-UCD-RR-22-34). National Center for Sustainable Transportation. https://doi.org/10.7922/G2P55KTX
3 Volker, J. M. B., Lee, A. E., & Handy, S. (2020). Induced Vehicle Travel in the Environmental Review Process. Transportation Research Record, 2674(7), 468–479. https://doi.org/10.1177/0361198120923365
4 Handy, S. L., Volker, J. M. B., & Hosseinzade, R. (2024). Assessing the Effectiveness of Potential Vehicle-Miles-Traveled (VMT) Mitigation Measures (Research Report No. PSR-23-21-01). https://escholarship.org/uc/item/1pf307sp
5 Bayen, A., Shaheen, S., Forscher, E., & Lazarus, J. (2019). An Equitable and Integrated Approach to Paying for Roads in a Time of Rapid Change (Research Report No. UC-ITS-2017-18). The University of California Institute of Transportation Studies. https://doi.org/10.7922/G2PR7T5X
6 Elkind, E., & Lamm, T. (2018). Considerations for Mitigating Vehicle Miles Traveled under SB 743 (Policy Brief No. UC-ITS-2018-40). The University of California Institute of Transportation Studies. https://doi.org/10.7922/G2V40SFS
7 Millard-Ball, A., & Rosen, M. (2025). Road Capacity as a Fundamental Determinant of Vehicle Travel (Research Report No. UC-ITS-RIMI-3R). The University of California Institute of Transportation Studies. https://doi.org/10.7922/G2Q52N05
8 Sunset Dunes April 12-June 30, 2025 Fact Sheet. (2025). San Francisco Recreation and Parks. https://sfrecpark.org/DocumentCenter/View/27075/ Sunset-Dunes-Fact-Sheet_Q2_2025?bidId=
9 Outer Sunset Traffic Report, Spring 2025. (2025, July 25). https://www.sfmta.com/reports/outer-sunset-traffic-report-spring-2025

COORDINATED PLANNING AND EMERGENT TECHNOLOGIES ARE ESSENTIAL TO SAFEGUARD COMMUNITIES DURING DISASTER RECOVERY
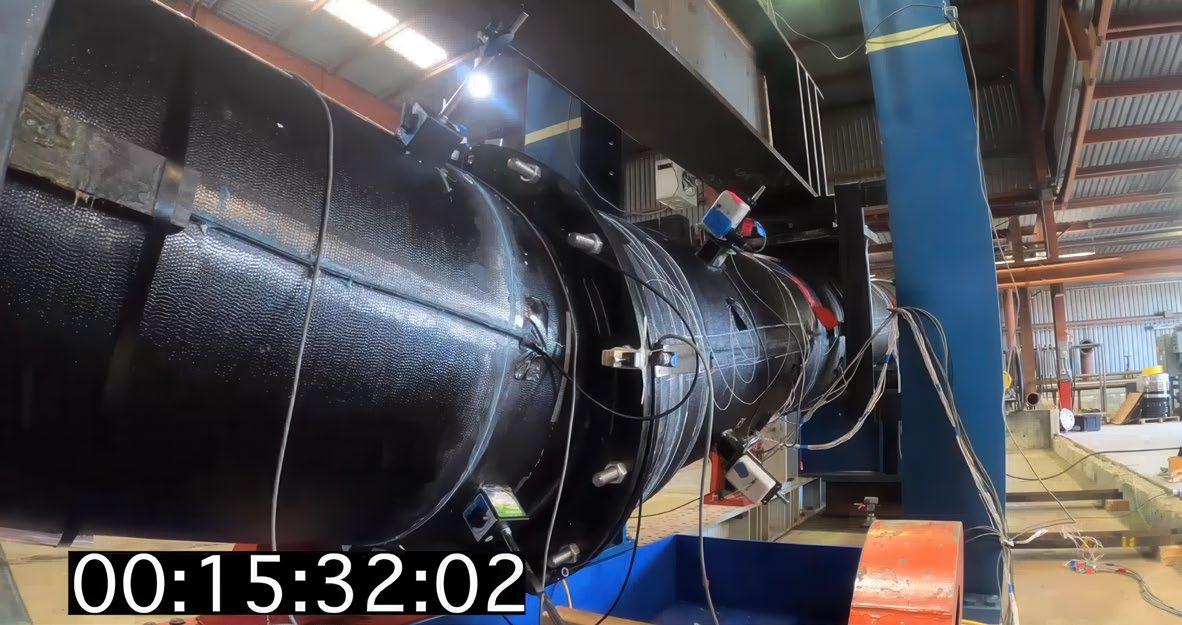
The Center for Smart Infrastructure (CSI) at UC Berkeley’s Richmond Field Station—a large, warehouse-like facility— feels almost like a giant’s playground. Inside, there’s a 42-foot sandbox, a wave pool that runs the length of the building, and a massive steel frame equipped with actuators capable of exerting 1.5 million pounds of force. This frame, known as a four-point bending test apparatus, is used by Kenichi Soga, a UC Berkeley professor of civil and environmental engineering and CSI director, to break massive pipes.
One afternoon in September 2025, Soga guided a group of Japanese investors and researchers through the facility, explaining that pipeline buyers hire CSI to test the connection joints. The 48-inch ductile iron pipe currently in the apparatus had recently been tested as a demonstration for the Los Angeles Department of Water and Power. Using this apparatus along with several other colossal machines, CSI can measure how much bending, compression, shearing, and rotation a pipe joint system can endure before failing. The joint on display ruptured
at around 10 degrees of rotation, though Soga has tested some pipes that can withstand up to 20 degrees.
“Manufacturers conduct simulations, but purchasers always want large-scale experiments like this to prove that the joints work,” says Soga. “We want to make sure that these pipes will last for 100 years or more.”
Perhaps more than any other state in the U.S., California faces unprecedented threats to its infrastructure. Earthquakes, liquefaction, sea-level rise, and wildfires have already pushed many communities to the breaking point. The human and economic costs provide strong incentives to replace damaged pipes and transmission lines with more durable alternatives and to develop better contingency plans to reduce the impact of future disasters. Researchers at the University of California’s Resilient and Innovative Mobility Initiative (RIMI) are studying the most effective ways to build resiliency into California’s transportation infrastructure and enhance safety and survivability in the face of catastrophe.
After touring the bending test facility, Soga led his visitors to the soil-pipeline-fault testing apparatus—a 42-foot sandbox. Several pipes can be placed inside the box, which is then filled with sand. The box is split into two halves, one of which can be pushed up to 70 inches to simulate the lateral movement of a strike-slip fault. Fiber optic cables are attached to the pipes and embedded in the soil, enabling the detection of strain and leaks without removing the sand. Soga explained that pipelines equipped with these fiber optic sensors can be continuously monitored, allowing for rapid detection of failures and leaks. In the field, such a sensor system provides invaluable data for repair crews. However, immediately following an earthquake, transportation disruptions can delay access to damaged pipes, hindering repair efforts.
Apart from conducting experimental studies of infrastructure performance during earthquakes, Soga’s team has developed a simulation program to model post-earthquake transportation scenarios. Working with colleagues at the UCLA Institute of Transportation Studies, they integrated a traffic simulator with a metro simulator to create a multimodal transportation tool capable of testing the impacts of various post-disaster scenarios. Using this simulator, Soga assessed the earthquake preparedness of public transit agencies in the San Francisco Bay Area. He reported his findings in a recent report1 in which he simulated the complete shutdown of the MacArthur Bay Area Rapid Transit (BART) station in Oakland, California.
Soga’s simulations predicted that commute times for BART riders would increase by about 15%, while overall regional travel times—regardless of mode—would rise by roughly 1%. Even in this relatively low-damage scenario, low-income BART commuters whose jobs cannot accommodate lateness would be hit the hardest, as some would likely have to rely on ridehailing services like Uber or Lyft, potentially paying twice the typical BART fare to get to work. Building on this study as a proof of concept, Soga is enhancing the simulator to incorporate streetlevel road data, ridehailing availability, and traveler behavior. He plans to use the upgraded tool to evaluate a wider range of post-disaster scenarios.
Soga says that the first key takeaway from this study is the need for coordinated action among public agencies and municipalities following a major earthquake. For instance,
if the MacArthur BART station was so badly damaged that trains could no longer pass through, shuttles would need to transport commuters from the Richmond and Antioch lines to a station closer to downtown Oakland. As some riders would likely turn to ridehailing, taxis, or personal vehicles, the shuttles would need to take alternate routes to avoid worsening congestion at a time when crews must move quickly to repair damaged utilities. In such a scenario, BART, the California Department of Transportation (Caltrans), and utility agencies would all need to operate under the same coordinated plan. Soga found, however, that while some public transit and utility agencies have posted public post-disaster plans, most focus only on the immediate response rather than the months or work required for full recovery.
The second takeaway is that communities must prepare for coordinated action before an earthquake occurs. Residents should stock supplies to manage extended periods of uncertainty, check in with neighbors, and be ready to adapt. Public transit services could be disrupted for months or even years, and some workers may need to work from home or organize local carpools to reduce congestion from single-occupant vehicles. Soga notes that the shelter-in-place orders during the COVID-19 pandemic demonstrated that people can adjust their habits more readily than he had initially expected.
“People need to be aware that the situation will be quite complex. Anything could happen, and so communities need to work collectively, make the right decisions quickly, and comply with emergency orders,” says Soga.
Wildfire preparedness requires even more coordination and community buy-in
Rapid communication in at-risk communities may be even more critical during wildfires than earthquakes, especially on rural roads. Soga explains that the most dangerous scenario occurs when people delay evacuation, creating gridlock as too many vehicles try to escape all at once. To address this, he conducted traffic simulations of wildfire evacuations in Marin County to develop improved guidance for municipalities. His recommendations are detailed in a recent report. 2
Soga offers three key recommendations for communities in Marin County to make evacuations more orderly and improve survivability. The first is to reduce the number of vehicles on the roads by organizing evacuation carpools. The second recommendation is to avoid issuing evacuation orders for entire municipalities at once. Instead, they should divide the area into geographic
zones and stagger evacuation orders in phases. Third, during periods of extreme wildfire risk, prohibit street parking on key thoroughfares. This measure can increase road capacity during an evacuation by up to 30% and reduce the risk of abandoned cars blocking escape routes for those still on the road behind.
Susan Shaheen, a professor of civil and environmental engineering at UC Berkeley and director of RIMI, reviewed 11 major wildfire evacuations in California between 2017 and 2019 and surveyed evacuees. In a report3 on this study, Shaheen proposed employing ridehailing companies to support carpooling efforts. During several major wildfires during the study period, ridehailing companies offered some “no-fee” rides, and the analysis found that such services could help reduce congestion.
Shaheen also recommends that municipalities address “defending” behaviors, where people stay in their homes after receiving evacuation orders in an attempt to protect their property. Since most property owners are not professional firefighters, these efforts typically only delay evacuation and worsen last-minute road congestion. Preventing this sort of behavior requires clear and early communication with the community well before evacuation orders are issued.
“Local homeowners associations could be a key resource to prevent defending behavior—neighbors watching out for one another and saying, ‘it’s time to get out,’” notes Shaheen.
Soga also emphasizes the importance of advanced communication through multiple channels, including text messages, social media, radio announcements, and even door-to-door notifications from local representatives. In a policy brief4 on wildfire planning, he notes that cellular networks are often disrupted by wildfires, yet this is frequently overlooked in evacuation plans. His analysis
found that a 50% reduction in cellular capacity can delay notifications by an additional 150 minutes, while a complete loss of service could add as much as 330 minutes.
Both Soga and Shaheen say that trust is in ever shorter supply, so more localized and human-centered approaches may be needed to get the word out. For example, Soga’s collaborators are developing an evacuation board game and an associated video game. These games are already being tested in small communities in Marin and Alameda counties, and early results suggest they help residents rethink their assumptions and come up with new evacuation strategies.
Soga concluded his tour of CSI on a recently paved road outside the building. He explained that the road is embedded with a grid of fiber-optic cables. While fiber optics are already used to detect earthquakes, Soga hopes to adapt the technology to sense smaller vibrations, such as those caused by vehicles and footsteps. He likens the concept to turning a road into a touchscreen that records everything that passes over it. Since cameras have limited range and perform poorly in darkness or bad weather, this system could complement existing surveillance tools. In an emergency, it could provide municipalities with real-time information, helping them quickly share life-saving guidance about which routes to avoid.
“Everybody has their own perception of risk and trustworthy sources,” said Soga. “We need to use emergent technologies to identify the sources that people trust in each community.”
1 Soga, K., Comfort, L., Zhao, B., Tang, Y. (Kelly), & Han, T. (2024). Assessing the Functionality of Transit and Shared Mobility Systems after Earthquakes (Research Report No. UC-ITS-RIMI-4K). The University of California Institute of Transportation Studies. https://doi.org/10.7922/G2NZ860C
2 Soga, K., Comfort, L., Li, P., Zhao, B., & Lorusso, P. (2024). Testing Wildfire Evacuation Strategies and Coordination Plans for Wildland-Urban Interface (WUI) Communities in California (Research Report No. UC-ITS-2022-34). The University of California Institute of Transportation Studies. https:// doi.org/10.7922/G2XK8CX7
3 Wong, S. D., Broader, J. C., & Shaheen, S. A. (2020). Review of California Wildfire Evacuations from 2017 to 2019 (Research Report No. UC-ITS-201919-b). The University of California Institute of Transportation Studies. https://doi.org/10.7922/G29G5K2R
4 Soga, K., Comfort, L., Zhao, B., Lorusso, P., & Soysal, S. (2021). Wildfire Evacuation Planning Can Be Greatly Enhanced by Considering Fire Progression, Communication Systems, and Other Dynamic Factors (Policy Brief No. UC-ITS-2020-29). https://doi.org/10.7922/G23T9FJG
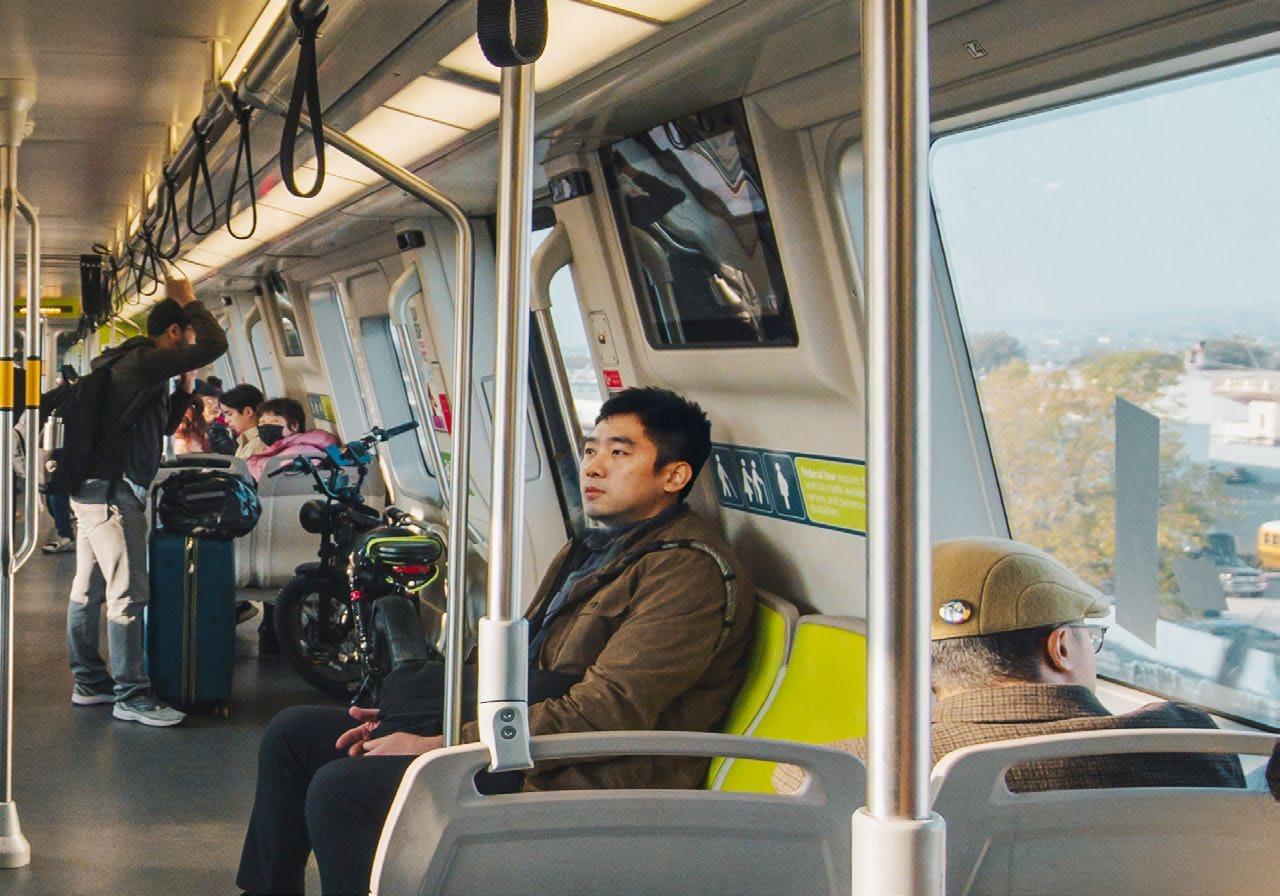
Drivers commuting from Oakland to San Francisco faced long delays back in February 2019. Traveling the eight miles from the Bay Bridge toll plaza to the first San Francisco freeway exit could have taken hours during the morning peak. According to the Metropolitan Transportation Commission (MTC), this congestion was caused by an average of some 128,000 vehicles crossing the bridge each weekday.
Many commuters opted to avoid the Bay Bridge and take a Bay Area Rapid Transit (BART) train into the city instead, exchanging traffic delays for crowded trains. According to the MTC, about 400,000 people packed into BART each weekday, with some cars reaching “crush load” capacity of around 200 passengers, depending on the car type. In 2020, however, COVID-19 shelter-in-place orders dramatically reduced ridership and fare revenue, plunging the BART District into a deep fiscal deficit.
Today, average vehicle traffic on the Bay Bridge has nearly returned to pre-pandemic levels, but BART ridership remains below half of its pre-pandemic peak, according to BART reports. Federal pandemic stimulus funds that kept BART afloat have run out, leaving the agency—and many other public transit systems—with a bleak financial outlook. Researchers with the University of California’s Resilient and Innovative Mobility Initiative (RIMI) note that COVID-19 was not the sole cause of transit’s struggles but accelerated preexisting declines in ridership. To make public transit a viable alternative to
sitting in traffic, Californians will need to move beyond a car-first mindset.
“We can’t keep building for cars and expect transit to be successful,” says Kari Watkins, a professor of civil and environmental engineering at UC Davis.
Watkins led a study of public transit ridership trends in over 200 U.S. cities,1 finding that between 2012 and 2018, bus and rail use declined by as much as 15%. She found that these declines often coincided with periods of lower gasoline prices, and ridehailing services like Uber and Lyft contributed significantly to ridership drops in midsized cities. Additional research by RIMI found that in San Francisco and Los Angeles, ridehailing largely substitutes for transit use.2 The COVID-19 pandemic added another layer. As work-from-home arrangements became more common, people were more willing to tolerate the cost and congestion of driving when they didn’t have to travel to the office every day.
Brian D. Taylor, professor of urban planning and public policy at the UCLA Luskin School of Public Affairs, and Jacob L. Wasserman, a research program manager at the UCLA Institute of Transportation Studies, identified trends similar to Watkins’ in their study of California public transit ridership.3 They found that from 2010 to 2020, ridership fell 11%, primarily due to increased private vehicle use from
both higher car and truck ownership and more ridehailing trips. Although the number of public transit riders generally held steady, those riders took fewer trips. Intriguingly, overall transit service in the state increased, but it failed to attract enough new riders to replace those lost to private vehicles. Taylor attributes this shift largely to low-income commuters gradually acquiring the means to buy cars and use ridehailing services.
“It used to be that 5% of California households accounted for 45% of all transit trips, but those formerly heavy transit users were riding much less leading up to the pandemic,” says Taylor. “That script has flipped since the pandemic, as more affluent downtown commuters are riding transit less and working at home more.”
Most public transit routes continue to focus on traditional downtown commutes during morning and evening peak hours. Taylor and Wasserman studied the impact of “peaking”—large concentrations of riders traveling to and from urban centers—on BART.4 Before COVID-19, peak-hour trips into and out of downtown San Francisco grew so much that losses elsewhere in the system were often overlooked. Similar trends occurred across Bay Area transit systems and many operators statewide. In fact, trips into and out of downtown San Francisco accounted for nearly two-thirds of all transit ridership in the nine-county region, which helped mask overall ridership declines.
Although peak-hour ridership on BART generated significant fare revenue, these gains were offset by declines in off-peak and non-downtown trips. Taylor and Wasserman found that off-peak ridership steadily fell as peaking intensified. Surveys from several Bay Area public transit agencies indicated that riders were concerned about crowding, safety, reliability, and cleanliness, with BART’s customer satisfaction dropping 28 percentage points between 2012 and 2018. Running emptier trains during off-peak hours also pushed BART’s operating costs higher,
increasing the per-passenger, per-mile expense by 12% in 2017.
The BART board recently approved advancing the Link 21 program,5 which would build a second transbay tunnel connecting San Francisco and Oakland. MTC estimates the project would cost around $29 billion and increase BART’s capacity. While it could help ease crowding if ridership returns to pre-pandemic levels, Taylor and Wasserman caution that such costly projects may worsen BART’s peaking problem by dramatically raising operational costs—and likely fares—for a shrinking pool of riders.
Other RIMI researchers have found that modest improvements like cleaning, lighting, and reliability upgrades can have an outsized impact on rider satisfaction. Watkins studied the use of apps providing real-time bus arrival updates and found that riders who used them reported a greater sense of service reliability.6
Taylor and Wasserman’s study of public transit ridership examined how neighborhoods around transit corridors have changed over time. They found that some lowincome households left the dense urban areas they had traditionally occupied. Rising housing costs have reduced the number of Californians able to live and work in the same city. Between 2002 and 2015, the average commute increased by 15%. Low-income workers—once regular transit riders in urban areas—have increasingly relocated to suburbs and exurbs, where transit service is limited, infrequent, and lightly used.
“We can’t keep building for cars and expect transit to be successful.”
Kari Watkins, Ph.D., UC Davis Institute of Transportation Studies
With shifting neighborhood demographics, public transit agencies might be tempted to expand service into suburbs and exurbs to reach new riders or the low-income riders who once accounted for nearly half of all transit trips. Watkins warns that this would be a mistake. Her study of declining transit ridership found that transit use is closely linked to population density—denser cities see much higher ridership per capita. Leading up to COVID-19, declines in transit were largely driven by people moving
to less dense areas. As housing costs rose, more lowincome households relocated to the exurbs than before, while the relatively wealthier households that moved into dense urban centers relied less on public transit.
Watkins identifies California’s land-use patterns as a major barrier to more effective transit. She cites Japan as an example. The Tokyo Metro owns valuable land near its stations, developing housing and commercial spaces that increase density, generate rental revenue to support the rail system, and encourage public transit use. While such strategies may be difficult for California transit agencies to implement, Watkins notes that state and local governments can help by incentivizing dense housing in urban centers and discouraging sprawling parking lots. Taylor adds that California faces a catastrophic lack of housing, particularly in urban areas, and that plenty of people who fled to the suburbs would happily move back into urban centers if increased housing supply led to lower prices.
“If we significantly increase the amount of multi-unit housing in central places like the 15-mile stretch between Santa Monica and downtown Los Angeles, demand for and use of public transit would also increase significantly,” Taylor says.
San Francisco already manages driving to some extent. Both the Golden Gate and Bay Bridges charge tolls for inbound vehicles, and downtown parking is limited and expensive. According to RIMI researchers, these measures do little to reduce congestion because they are uncoordinated and incomplete. For example, while the city’s busiest streets have paid parking meters, drivers can still park for free on nearby, less-traveled streets. According to Susan Shaheen, professor of civil and environmental engineering at UC Berkeley and director of RIMI, reducing congestion and emissions requires clearer limits in the densest areas.
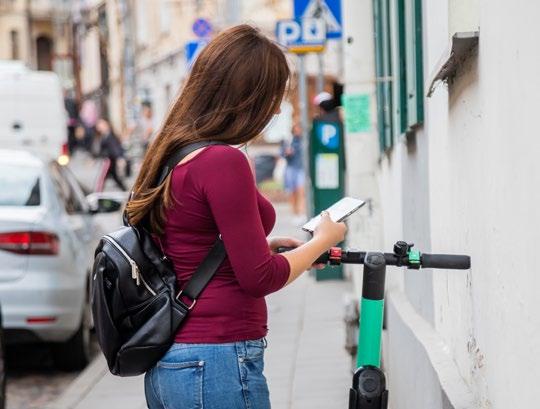
Shaheen suggests that municipalities create lowemission zones in dense urban centers that restrict access for private and commercial vehicles. All-electric taxis and ridehailing vehicles could still enter, but travel within the zone would mainly rely on public transit, micromobility (bicycles and scooters), and walking. Cities could also use curb controls to manage where taxis and ridehailing services pick up and drop off passengers. In suburban and exurban areas, she recommends subsidizing firstand last-mile ridehailing trips to public transit hubs to encourage greater transit use. She emphasizes that these
programs require careful implementation with locationverifying technologies, since past pilots have not always applied such requirements.
To assess whether shared micromobility trips connect to public transit, Shaheen developed a method that micromobility companies and other stakeholders can use to identify and analyze these linkages.7 Based on data from several California cities, she found that 5% to 20% of micromobility trips serve as transit connections. In dense urban areas, her research8 shows that micromobility can compete with transit, although many cities regard it as a form of public transportation.
“In dense urban centers, both ridehailing and micromobility often compete with public transit,” says Shaheen. “But in suburban areas, these services tend to complement transit by making it easier for people to access stations, increasing the likelihood they’ll use transit for longer trips into the city.”
Implementing this type of regional strategy would require strong collaboration among multiple stakeholders and municipalities, and it could be challenging to persuade suburban politicians to support measures that have little impact on their local streets. But dense cities can pursue effective policies on their own, such as cordon pricing, which charges private vehicles for access to the busiest areas. In July 2025, New York Governor Kathy Hochul reported that the city’s cordon pricing program reduced traffic in the Lower and Midtown
Manhattan congestion zones by 11%—about 67,000 fewer vehicles per day. While road pricing often raises equity concerns, a study by researchers at the UC Institute of Transportation Studies found that cordon pricing can be implemented equitably.9 Their analysis showed that such charges generally impose far less burden on low-income residents than the transportation sales taxes common in nearly every California county.10
“Road pricing makes driving better and can significantly increase transit use,” says Taylor. “The main things are to ensure that prices are high enough to clear congestion, that provisions are in place to protect low-income drivers, and that some of the revenue is used to support public transit.”
1 Watkins, K., Berrebi, S., Erhardt, G., Hoque, J., Goyal, V., Brakewood, C., Ziedan, A., Darling, W., Hemily, B., Kressner, J., Transit Cooperative Research Program, Transportation Research Board, & National Academies of Sciences, Engineering, and Medicine. (2021). Recent Decline in Public Transportation Ridership: Analysis, Causes, and Responses (p. 26320). Transportation Research Board. https://doi.org/10.17226/26320
2 Martin, E., Shaheen, S., & Stocker, A. (2021). Impacts of Transportation Network Companies on Vehicle Miles Traveled, Greenhouse Gas Emissions, and Travel Behavior Analysis from the Washington D.C., Los Angeles, and San Francisco Markets [Research Report]. Transportation Sustainability Research Center. https://doi.org/10.7922/G2BC3WV9
3 Taylor, B. D., Blumenberg, E., Wasserman, J. L., Garrett, M., Schouten, A., King, H., Paul, J., & Ruvolo, M. (2020). Transit Blues in the Golden State: Analyzing Recent California Ridership Trends (Research Report No. UC ITS-LA1908). The University of California Institute of Transportation Studies. https://doi. org/10.17610/T67W2Z
4 Wasserman, J. L., & Taylor, B. D. (2023). State of the BART: Analyzing the Determinants of Bay Area Rapid Transit Use in the 2010s. Transportation Research Part A: Policy and Practice, 172, 103663. https://doi.org/10.1016/j.tra.2023.103663
5 Bay Area Rapid Transit. (2025, June 12). Link21 reaches new milestones for technology selection and inclusion in the state’s rail plan | Bay Area Rapid Transit. https://www.bart.gov/news/articles/2025/news20250612-1
6 Watkins, K. E., Ferris, B., Borning, A., Rutherford, G. S., & Layton, D. (2011). Where Is My Bus? Impact of mobile real-time information on the perceived and actual wait time of transit riders. Transportation Research Part A: Policy and Practice, 45(8), 839–848. https://doi.org/10.1016/j.tra.2011.06.010
7 Ju, M., Martin, E., & Shaheen, S. (2024). What Is the Connection? Understanding Shared Micromobility Links to Rail Public Transit Systems in Major California Cities. Sustainability, 16(2), 555. https://doi.org/10.3390/su16020555
8 Martin, E. W., & Shaheen, S. A. (2014). Evaluating public transit modal shift dynamics in response to bikesharing: A tale of two U.S. cities. Journal of Transport Geography, 41, 315–324. https://doi.org/10.1016/j.jtrangeo.2014.06.026
9 D’Agostino, M. C., Pellaton, P., & White, B. (2020). Equitable Congestion Pricing (Research Report No. UC-ITS-2020-21a). The University of California Institute of Transportation Studies. https://doi.org/10.7922/G2RF5S92
10 Schweitzer, L., & Taylor, B. D. (2008). Just pricing: The distributional effects of congestion pricing and sales taxes. Transportation, 35(6), 797–812. https:// doi.org/10.1007/s11116-008-9165-9
In October 2025, California Governor Gavin Newsom signed Senate Bill 79 (SB 79), which overrides local zoning restrictions within a half mile of major public transit stations and permits multifamily housing developments of roughly four to nine stories. The law is expected to increase housing supply and bolster public transit ridership and revenue by placing more potential riders near transit stops and stations. Researchers with the University of California’s Resilient and Innovative Mobility Initiative (RIMI) note that SB 79 is just one of many changes needed to stabilize public transit finances.
“The state of public transit finance is not great,” says Jacob L. Wasserman, the public transit research program
manager with the UCLA Institute of Transportation Studies. “Ridership recovery post-COVID has been uneven, so without reform, many systems will need to cut service.”
California’s cities thrive when their public transit systems operate efficiently and effectively. High-quality transit connects travelers to places, reduces greenhouse gas emissions by shifting cars away from roads, supports the economy by improving job accessibility and increasing property values, and ensures mobility for people who cannot drive or do not have access to a car.
RIMI researchers emphasize that fostering robust, wellfinanced transit systems in the state’s largest cities can also support efforts to address California’s affordable
housing crisis and boost public transit ridership, especially if transit agencies modernize and improve their operations.
Michael Manville, a professor of urban planning at the UCLA Luskin School of Public Affairs, studied land-use challenges in Los Angeles long before SB 79. In a 2023 paper1 that analyzed multifamily developments near transit hubs in Los Angeles, he found that a key barrier was local governments’ reliance on discretionary permitting
processes, which often delay project approvals. Manville argues that adopting “by-right” approvals—a more predictable and streamlined permitting approach— could help encourage the development of more multifamily housing.
John Gahbauer, a research consultant with the UCLA Institute of Transportation Studies, was part of a research team that surveyed and facilitated multiple discussions with a panel of 18 experts on transportation and land-use policy. He co-authored two reports2,3 on the panel’s findings. The panel identified a lack of public trust as a major barrier to land-use reforms that support public transit, noting that past transportation projects
often displaced housing in historically Black and Latino neighborhoods. To rebuild trust, the panel recommended that state agencies and local governments invest in repairing and restoring harmed communities and make the permitting process more transparent and inclusive of public input.
Gahbauer also contributed to a report on the future of transportation and urban planning in California,4 which found that public transit subsidies often favor large capital projects that expand service rather than maintaining and improving existing systems. While new stations and rail lines are easy to promote, this emphasis on the latest project can gradually erode the value of current public transit investments. The report concludes that improving existing service and encouraging denser development near transit hubs would be far more effective in enhancing service quality, boosting ridership, and strengthening public support for transit.
“If I had a magic wand to fix all of our urban problems, I’d make many dense clusters where people can live and work and then connect them with robust transit services,” says Gahbauer.
“The shining stars of transit before the pandemic are often the systems that are really hurting now,” says Brian D. Taylor, a professor of urban planning and public policy at the UCLA Luskin School.
Taylor studied6,7 ridership trends from 2010 to 2020 and found that the outlook for public transit was already troubling even before the pandemic. Heavy use of BART during peak commute hours made it easy to overlook deepening ridership declines and rising costs during offpeak periods, both on BART and across most other transit systems in California. Operating costs—driven largely by labor expenses—continued to increase, while higher fare revenues from peak-hour travel couldn’t keep pace with total operating expenses.
Yet cutting labor costs to balance transit agency budgets could be disastrous for the long-term sustainability of the transit workforce. In recent years, agencies have already had to raise pay to address severe worker shortages that worsened after the pandemic. For over a decade prior, inflation-adjusted wages for California’s frontline transit workers—such as bus drivers and train operators—had remained largely stagnant.
“The shining stars of transit before the pandemic are often the systems that are really hurting now.”
Brian Taylor, Ph.D., UCLA Institute of Transportation Studies
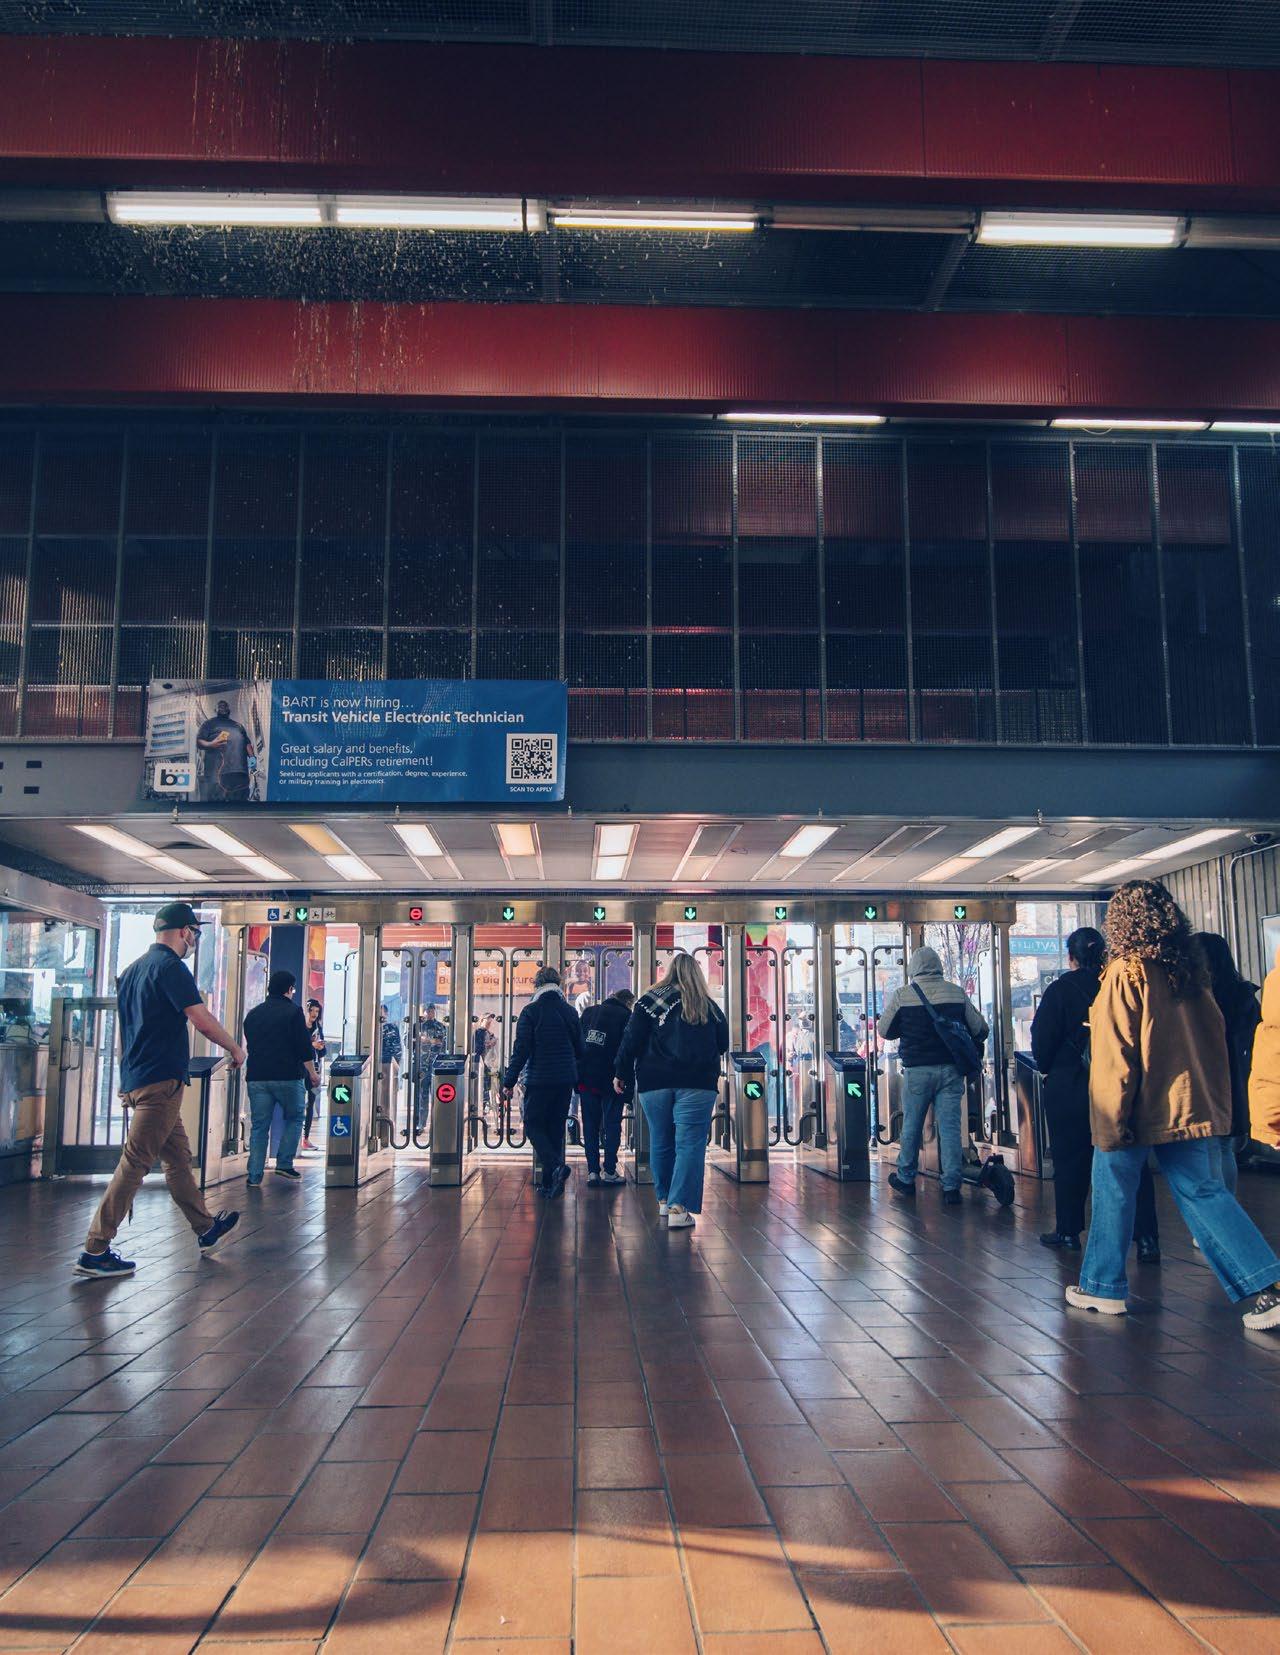
In 2019, the Bay Area Rapid Transit (BART) system was among the most financially self-sufficient public transit agencies in the United States. Data submitted to the Federal Transit Administration (FTA) show that fares covered some 72% of BART’s operating expenses in the final fiscal year before the pandemic. The following year, shelter-in-place orders and the widespread shift to remote work sharply reduced ridership and fare revenue. BART’s ridership has only partially recovered since then. BART’s monthly ridership report shows that average weekday ridership in 2025 was around 180,000—less than half of pre-pandemic levels. As a result, public transit systems like BART, which once relied less on operating subsidies, now struggle to balance their books. A 2023 RIMI study5 found that federal pandemic stimulus funds were a critical lifeline to keep transit agencies financially afloat.
Recruiting and retaining workers is further complicated by the demanding nature of the job. As part of a statewide study of the transit workforce, Wasserman interviewed a wide range of stakeholders, including drivers.8 Public transit workers described high stress levels driven by long hours and increasing safety concerns, as well as the growing expectation that they serve as social workers, first responders, and rule enforcers while simultaneously operating their vehicles.
With many California public transit agencies facing both fiscal cliffs and labor shortages, exploring new fare and funding models has become increasingly urgent. Taylor studied programs offering free or reduced transit passes and found that, while they can boost ridership, they also raise operational costs.9 These discussions often blur the distinction between commuter-focused transit systems, which rely heavily on fares and smaller, social-service-oriented systems that generally do not. Taylor concludes that implementing a universal free-fare policy would require rethinking public transit as a basic
public service—similar to schools or parks—which may be difficult to justify in terms of effectiveness.
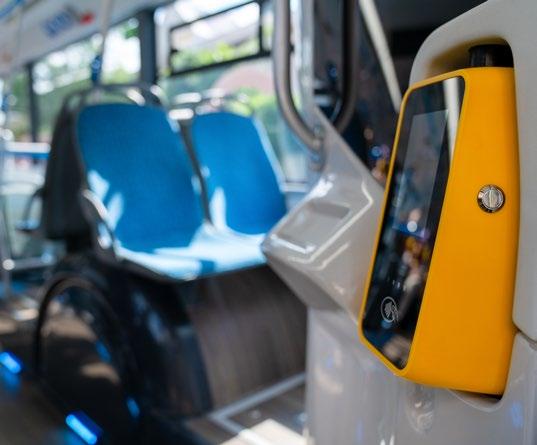
Gahbauer notes that large gains in ridership do not require sweeping changes. He says that most transit services discourage casual and first-time riders by requiring them to decipher confusing fare tables and navigate complicated pass purchases. Gahbauer recommends that public transit agencies coordinate their fare systems and allow riders to pay using mobile apps, credit cards, and proof of payment systems that make it easy to bundle tickets or allow groups to travel together on a single fare. Most current fare structures are designed for solo commuters, he says, and this one-sizefits-all approach can make transit fares relatively high and less appealing for groups traveling together.
“A family of four that would otherwise take public transit might find that it’s cheaper to take a ridehailing service,” says Gahbauer.
Kari Watkins, a professor of civil and environmental engineering at UC Davis, says the formula for increasing public transit ridership is straightforward. Based on her global studies of transit use, she finds that higher driving costs lead to higher transit ridership. Watkins points out that a major reason U.S. transit agencies remain chronically underfunded is the widespread practice of
hiding or shifting the true costs of driving. This occurs through underpriced parking and a per-gallon gasoline tax that is supposed to cover road maintenance but is often supplemented with additional state and federal funding.
“We heavily subsidize driving, so we can’t be against subsidizing transit as well,” says Watkins.
A major RIMI analysis of hundreds of studies on housing availability, travel behavior, and land use policy10 found that road pricing could offer multiple benefits. Applying dynamic fees—higher during peak congestion and lower during off-peak periods—to heavily trafficked roads could help them operate more smoothly and efficiently. Road pricing could also generate revenue for public transit agencies or rider subsidy programs and, importantly, make public transit a more attractive option for travelers.
Road pricing could gradually replace the gasoline tax, which will generate less revenue for road maintenance as more people switch to electric vehicles. It would also reduce overall vehicle miles traveled and lower greenhouse gas emissions, with more affluent households paying a larger share due to their higher driving rates. Additionally, road pricing could help shift public perceptions by reinforcing the idea that using roads is not free.
“We spend so much money on freeways in California,” says Wasserman. “Nobody ever asks if they make any money.”
1 Manville, M., Monkkonen, P., Gray, N., & Phillips, S. (2023). Does Discretion Delay Development?: The Impact of Approval Pathways on Multifamily Housing’s Time to Permit. Journal of the American Planning Association, 89(3), 336–347. https://doi.org/10.1080/01944363.2022.2106291
2 Gahbauer, J., Matute, J., Jacob L. Wasserman, Rios, A., & Taylor, B. D. (2022). Steering California’s Transportation Future: A Report on Possible Scenarios and Recommendations (Research Report No. UC-ITS-RIMI-4B-03). The University of California Institute of Transportation Studies. https://doi.org/10.17610/T6M89T
3 Gahbauer, J., Wasserman, J. L., Matute, J., Rios Gutierrez, A., & Taylor, B. D. (2022). Employing a Modified Delphi Approach to Explore Scenarios for California’s Transportation and Land Use Future (Research Report No. UC-ITS-RIMI-4B-02). The University of California Institute of Transportation Studies. https://doi.org/10.17610/T6R018
4 Wasserman, J. L., Taylor, B. D., Gahbauer, J., Matute, J., Garrett, M., Ding, H., Pinski, M., Rios Gutierrez, N., Rios Gutierrez, A., & California 100. (2022). The Future of Transportation and Urban Planning: A California 100 Report on Policies and Future Scenarios. https://escholarship.org/uc/ item/47v8d23j
5 Wasserman, J. L., Gahbauer, J., Siddiq, F., King, H., Ding, H., & Taylor, B. D. (2023). Financing the Future: Examining the Fiscal Landscape of California Public Transit in the Wake of the Pandemic (Research Report No. UC-ITS-2022-15). The University of California Institute of Transportation Studies. https://doi.org/10.17610/T6CC9P
6 Taylor, B. D., Blumenberg, E., Wasserman, J. L., Garrett, M., Schouten, A., King, H., Paul, J., & Ruvolo, M. (2020). Transit Blues in the Golden State: Analyzing Recent California Ridership Trends (Research Report No. UC ITS-LA1908). The University of California Institute of Transportation Studies. https://doi.org/10.17610/T67W2Z
7 Wasserman, J. L., & Taylor, B. D. (2023). State of the BART: Analyzing the Determinants of Bay Area Rapid Transit Use in the 2010s. Transportation Research Part A: Policy and Practice, 172, 103663. https://doi.org/10.1016/j.tra.2023.103663
8 Wasserman, J. L., Padgett, A., & Do, K. K.-A. (2024). Transit, Belabored: Issues and Futures for California’s Frontline Transit Workforce (Research Report No. UC-ITS-RIMI-4F-01). The University of California Institute of Transportation Studies. https://doi.org/10.7922/G2S180TK
9 King, H., & Taylor, B. D. (2023). Considering Fare-Free Transit in The Context of Research on Transit Service and Pricing: A Research Synthesis (Research Report No. UC-ITS-2022-08). The University of California Institute of Transportation Studies. https://doi.org/10.17610/T6161T
10 Chatman, D. G., Barbour, E., Kerzhner, T., Manville, M., & Reid, C. (2023). Policies to Improve Transportation Sustainability, Accessibility, and Housing Affordability in the State of California (Research Report No. UC-ITS-2020-30). The University of California Institute of Transportation Studies. https://doi.org/10.7922/G22F7KRZ
dealer refused to take the bZ4X back, and Jonassen is so happy they didn’t. Over time, she’s grown to love the car— mostly.
“I love 80% of it, and I could never see myself going back to a gas-powered car. The way I think about driving has completely changed—for better and for worse,” says Jonassen.
In California, the common explanation for EV hesitancy is simple: electric cars are too expensive, and public charging is too limited. This story makes sense to people who don’t own EVs. But owners like Jonassen often have more complex experiences. Their attitudes toward their vehicles can depend on whether they own a home, how long charging takes—30 minutes or three days—and how much it costs. These practical considerations will soon affect thousands more Californians. In June 2025, Governor Gavin Newsom signed Executive Order N-27-25, reaffirming the state’s goal that all new vehicles sold in California be zero-emission vehicles (ZEVs) by 2035. The next phase of EV adoption is well underway.
Wendi Jonassen hadn’t planned on buying an electric vehicle (EV). In February 2023, while driving to the mountains, her Subaru Impreza broke down halfway to Tahoe. She went to an East Bay Toyota dealership intending to buy a RAV4 hybrid, but the dealer pushed her to choose a fully electric SUV instead. Jonassen recalled that the dealer described gasoline plug-in hybrids as riskier, since having both an electric motor and a combustion engine meant “twice as much could go wrong.”
Jonassen was swayed. She ended up spending about $10,000 more than she had planned and drove off with a fully electric 2023 Toyota bZ4X. Soon after, she reconsidered and tried to return it. Without a dedicated home charger and after encountering several broken direct current (DC) fast chargers at public stations, she questioned the practicality of owning an EV. However, the
Because Jonassen doesn’t drive every day, she doesn’t need a dedicated home charger. She uses an adapter that allows her bZ4X to plug into a standard electrical outlet, which can take 50 to 60 hours to charge a typical battery from 0% to 80%. Living in a duplex with solar panels that offset the extra electricity costs, her EV has gradually become a money-saver. But not everyone can afford to wait several days for a wall-socket charge. Daily drivers need to invest in faster charging options. Dedicated home EV chargers vary in speed, but even the slowest can fully charge a typical EV battery overnight—the most affordable time to power up.
Home electricity rates change throughout the day, with the lowest prices during off-peak hours when demand is lowest. In the San Francisco Bay Area, Pacific Gas and Electric (PG&E) offers several rate plans. One plan designed for EV owners, EV2-A, charges about $0.30 per kilowatt-hour (kWh) during off-peak hours (12 AM to 3 PM). Charging a 60 kWh battery from 0% to 80%— enough for roughly 170 to 240 miles of driving—costs about $18. Charging during peak hours may cost twice as much, but both options are still far cheaper than filling a comparable gas-powered sedan. In 2025, ten gallons of gasoline in the Bay Area cost an average of about $45.

Dedicated home chargers are a great option for EV drivers who own single-family homes, but they pose challenges for those living in multi-family homes (MFHs). Unlike a simple plug-in, home chargers must be hardwired into the building’s electrical panel. Purchasing the charger and having it professionally installed can cost some $2000. For many residents of MFHs, who often rent, installing a charger on their own is not an option.
Landlords may hesitate to install chargers because many MFHs in California already draw as much electricity as single-family homes. Running a home charger at the same time as several large appliances could easily trip a breaker or blow fuses. Landlords can address this by adding a dedicated electrical line or installing energy management devices—both of which present another big expense on top of the cost of buying and installing the charger.
Alan Jenn, an associate professor of civil and environmental engineering at UC Davis and affiliate at
the UC Davis Institute of Transportation Studies Electric Vehicle Research Center, researches California’s energy grid and found that some of the state’s energy providers are addressing the challenges for MFHs installing home chargers. Jenn points to the Sacramento Municipal Utility District (SMUD), which offers substantial rebates (up to $2,500 for charger installation and $5,000 for electric line upgrades) for qualifying landlords who install EV chargers and energy management devices that allow multiple EVs to share a charger.
Jenn says that this sort of program helps landlords absorb the cost of installation and allows them to view the chargers as an amenity to be advertised to potential renters. He describes the program as exactly what’s needed throughout the state to meet the needs of the impending surge of EVs on the road.
“People are buying these cars, and we’ll soon see the trickle down of EVs to the used car market, which is where 70% of people buy their cars,” says Jenn.
Undoubtedly, some EV drivers who live in MFHs will never have access to a home charger, and even those who do won’t be able to charge at home all the time. An affordable, reliable public charging network has never been more important.
Like home chargers, DC fast chargers have variable charging times; however, most can charge a 60 kWh battery from 0% to 80% in 30 to 45 minutes. The federal Infrastructure Investment and Jobs Act of 2021 provided $5 billion to the U.S. Department of Transportation’s National Electric Vehicle Infrastructure (NEVI) Formula Program, covering up to 80% of eligible costs for installing and maintaining EV chargers. California was allocated $384 million over several years, which the state plans to use to deploy 500 new DC fast chargers across 70 different sites.
Jenn served as an advisor for the NEVI program. He explains that while charging stations are being deployed across California, some EV drivers may not notice them because the program prioritizes locations that are less frequently traveled. NEVI’s goal is to support EV ownership in rural communities and make longer-distance travel in EVs easier.
“In areas with lots of EVs, charging providers mostly deploy stations where people want to go because that’s where they can make the most money,” says Jenn.
Charging providers like Electrify America, EVgo, and ChargePoint are privately held companies seeking to turn a profit—a challenging task in this market. Jenn analyzed data from EV charging networks and found1 that building and operating a station can be financially precarious, as the competitive rates charged to customers rarely cover the $30,000 to $150,000 of the deployment cost within three years. Jenn notes that without subsidies—such as Target’s partnership with Electrify America or Whole Foods’ partnership with EVgo—these installation and maintenance costs might never be fully recouped.
It’s not surprising that network charging rates can vary widely depending on the time and location of use. Timothy Lipman, co-director of UC Berkeley’s Transportation Sustainability Research Center, studied the costs of using EVgo chargers supplied by three different electricity providers in California—SMUD, PG&E, and San Diego Gas & Electric—and summarized his findings in a policy brief. 2 He found that, because charging rates are largely unregulated, EV drivers living in MFHs often pay upwards of $2,000 per year extra compared with those who have access to home chargers.
“The state is moving in the right direction, but additional resources and stronger policy signals are needed.”
“Often, lower-income people get talked into spending a bit more on an EV with the idea that they’ll save money on fuel, but these prices can bring the cost of charging very close to that of gasoline.”
Timothy Lipman,
Ph.D., UC Berkeley Institute of Transportation Studies
“Often, lower-income people get talked into spending a bit more on an EV with the idea that they’ll save money on fuel, but costs of charging away from home can be as high or higher than the cost of gasoline,” says Lipman.
Lipman notes the state can support low-income EV drivers by extending existing energy assistance programs to help cover charging costs. Programs such as the California Alternate Rates for Energy (CARE) and the Family Electric Rate Assistance (FERA) offer 18% to 35% rate discounts on electricity for low-income customers. Lipman suggests that these programs should partner with charging networks to provide codes or other authentication methods, allowing low-income drivers to access discounted charging rates.
Of all the challenges facing California’s 2035 goal of achieving 100% zero-emission vehicle (ZEV) sales— including battery electric vehicles, fuel cell vehicles, and plug-in hybrids—none may be more daunting than the rollback of previous federal climate and energy policies.
President Trump recently signed a bill that eliminated EV tax credits established by the Inflation Reduction Act. Jenn described this bill, along with efforts to rescind California’s authority to set its own clean air standards, as significant blows to California’s EV adoption goals.
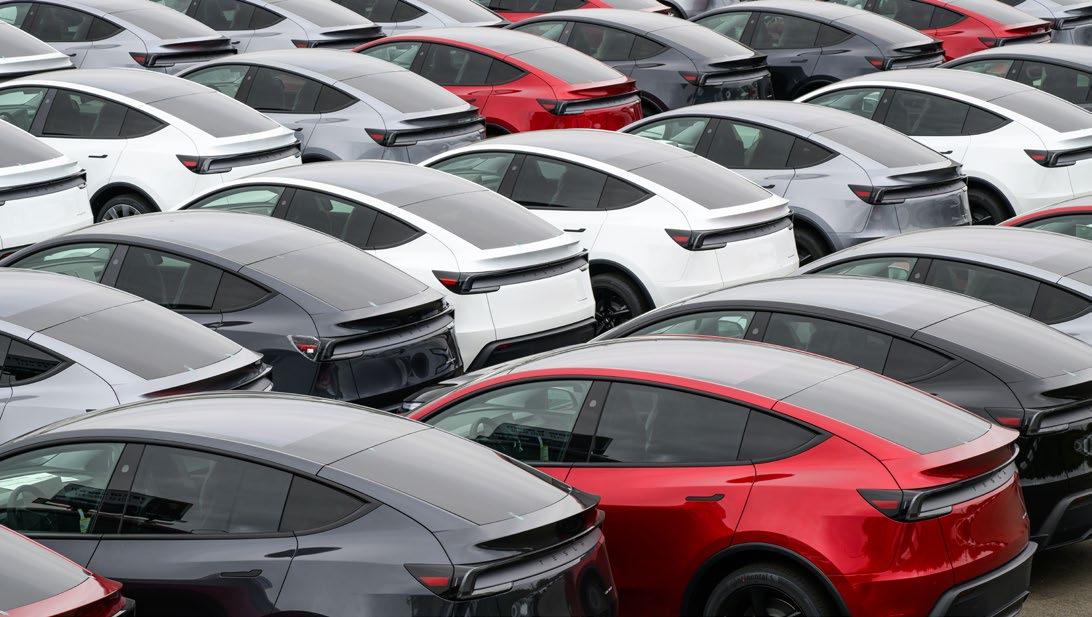
Despite these challenges, Gil Tal, Director of the EV Research Center at UC Davis, says California is still on track to grow its EV market in line with the 2035 ZEV sales goals—provided that policy support remains predictable. He cites California Energy Commission3 statistics showing that 25.3% of all new vehicles sold in the state in 2024 were ZEVs, with third-quarter 2025 sales even higher at 29.1%. Despite this progress, long-term growth could be limited by constrained supply, as major automakers scale back production in response to federal and state regulatory rollbacks and as new tariffs reduce the profitability of foreign-made EVs.
In 2024, Governor Gavin Newsom promised to revive the state’s Clean Vehicle Rebate Program (CVRP), which was phased out in 2023. CVRP provided tax rebates to qualifying EV purchases, and Newsom promised that a revived program could help fill the void left by canceled federal tax credits. Tal says that at the end of 2025, this promise is still not yet fully supported by an adequate budget, and given the state’s budget deficit, it may be challenging to deliver.
“The state is moving in the right direction, but additional resources and stronger policy signals are needed,” says Tal. “Without supply-side regulation and consistent state and federal incentives, California will struggle to meet its climate and ZEV adoption goals.”
1 Jenn, A. (2023, June 11). What is the business case for public electric vehicle chargers? 36th International Electric Vehicle Symposium and Exhibition (EVS36), Sacramento, CA. https://evs36.com/wp-content/uploads/finalpapers/FinalPaper_Jenn_Alan%20(1).pdf
2 Kandhra, D., MacCurdy, D., & Lipman, T. (2024). Multifamily Households Across California are Paying a Lot More to Charge Their Electric Vehicle (Policy Brief No. UC-ITS-RIMI-3C). The University of California Institute of Transportation Studies. https://doi.org/10.7922/G2D798SG
3 California Energy Commission. (2025). New ZEV Sales in California. California Energy Commission. https://www.energy.ca.gov/data-reports/ energy-almanac/zero-emission-vehicle-and-infrastructure-statistics-collection/new-zev
6x Bridging the Gap: Ridehailing as Public Transit’s Partner and Competitor
INTEGRATING RIDEHAILING, MICROTRANSIT, AND AUTOMATION INTO PUBLIC TRANSIT SYSTEMS REQUIRES
DELIBERATE POLICY—NOT TECH ALONE
by
In today’s post-pandemic world of widespread remote work, it’s hard to imagine what San Francisco was like in 2011. Some 330,000 cars crossed the Bay Bridge each day, and congestion routinely pushed trips to an hour or more. Not surprisingly, even more people turned to the Bay Area Rapid Transit (BART) system. Roughly 360,000 people per day skipped the bridge traffic by taking the train. Yet for those whose final destination was a place like the Presidio of San Francisco, any time saved on BART might easily be lost while waiting for an infrequent connecting bus service.
Susan Shaheen was one of those Presidio travelers. Today, Shaheen is a professor of civil and environmental engineering at UC Berkeley and director of the University of California’s Resilient and Innovative Mobility Initiative (RIMI). Earlier in her career, she lived in Washington DC, where the extensive Washington Metro meant she did not need to rely on a personal car. In San Francisco, the BART service was less ubiquitous than the Metro, and taxis were often difficult to find downtown. To reach the Presidio, Shaheen would walk to one of the big downtown hotels and hope to catch a taxi waiting to take tourists around. That changed in 2012, when new services, such as Lyft and Sidecar, emerged—transforming urban travel.
“We want to better understand the guardrails that are needed to help ridehailing and microtransit complement public transit and make their networks more resilient.”
Susan Shaheen, Ph.D., UC Berkeley Institute of Transportation Studies
Transportation network companies (ridehailing services), like Uber and Lyft—both of which started in San Francisco—rapidly spread across the United States. For many, they filled a gap that made public transit service a more appealing option by providing first- and lastmile connections. Over time, they’ve become serious competitors to public transit. RIMI researchers have spent years studying the rise of ridehailing and microtransit (a technology-enabled mobility service with vehicles
operating on fixed or flexible routes). Their work shows that, when thoughtfully integrated, ridehailing and microtransit can strengthen public transit systems and generate revenue by serving as a first- and last-mile solution.
“We want to better understand the guardrails that are needed to help ridehailing and microtransit complement public transit and make their networks more resilient,” says Shaheen.
Though the COVID-19 pandemic and associated shelterin-place orders led to historic drops in bus and rail ridership, public transit use had already been falling in most California cities since 2014. The San Francisco Bay Area had the most transit rides in California in 2018, yet it was also losing riders as high housing costs pushed many residents farther into exurban areas with limited transit access. At the same time, San Francisco’s young and affluent were also moving away from public transit in favor of ridehailing services.
“Many people turned to Uber and Lyft because of the apps. Early on, they proved to be more seamless than taxis and provided more reliable wait times,” says Shaheen.
In a 2024 paper published in the journal Sustainability, 1 Shaheen and Elliot Martin of ITS Berkeley’s Transportation Sustainability Research Center found that increased ridehailing use in San Francisco and Los Angeles was associated with lower personal automobile ownership but also higher vehicle miles traveled (VMT). The increase in VMT reflects changes in travel behavior among ridehailing users. Across San Francisco, Los Angeles, and DC, so-called “deadhead” miles (those accumulated while drivers wait for riders or travel to pick them up) accounted for 34% of total ridehailing VMT. In this study, VMT per passenger increased in San Francisco and Los Angeles but decreased in DC.
Recent research by RIMI investigators indicates that balancing affordability with convenience is essential for creating a mutually beneficial relationship between public transit and ridehailing. A policy brief2 and related study3 by Michael Cassidy, a professor of civil and environmental engineering at UC Berkeley, examined how rail service usage varies by socioeconomic status. The findings showed clear patterns: high-income
commuters often drove instead of using rail, middleincome commuters drove to rail stations and paid for parking, and low-income commuters typically walked or used feeder buses to access rail stations.
Cassidy found that subsidizing ridehailing trips to rail stations, combined with modest increases in parking fees, could encourage middle-income commuters to leave their cars at home. This shift would generate additional revenue and free up space for more buses and other feeder services, improving public transit access for lowincome commuters.
Susie Pike, director of the Transit Research Center at UC Davis, found that despite the potential benefits, few transit agencies have partnered with ridehailing companies. In a survey4 of 32 public transit agencies across the United States, Pike identified liability concerns and questions about the cost-effectiveness of subsidies as the main sticking point. With ridership still significantly below pre-pandemic levels and many agencies reducing service due to revenue shortfalls, public transit agencies may need to reconsider public–private partnerships, though ridehailing companies are not their only potential partners.
Richmond, California, has the second-highest poverty rate in Contra Costa County, and a large share of its residents rely on public transit for commuting. While the city is served by multiple regional transit options— including BART, Alameda County Transit buses, and a ferry—connections to these services within Richmond are limited. The on-demand service Richmond Moves is showing how microtransit can increase transit ridership by making it easier for residents to access these regional transportation options.
Richmond Moves offers rides within the city for a flat fare of $2, Monday through Friday, from 7 AM to 7 PM. The program is funded by the California Climate Investments’ Clean Mobility Options program, which generates revenue through the state’s Cap-and-Invest initiative. The Richmond Moves fleet consists entirely of plug-in hybrid and all-electric vehicles, and the service is fully compliant with the Americans with Disabilities Act, checking the necessary boxes for public–private transit partnerships. Although wait times are longer than for Uber and Lyft, Via Transportation’s app offers real-time tracking of rides.
Kari Watkins, associate professor of civil and environmental engineering at UC Davis, published a paper5 in 2011 examining how real-time arrival information affects transit rider perceptions of service reliability. According to Watkins, successful public transit agencies and microtransit operators not only provide frequent, dependable service but also keep riders regularly updated. In a 2024 study, 6 she modeled the characteristics of transit users who may be open to using microtransit, but she cautions that microtransit is not a “cure-all” for the challenges facing public transit.
“Microtransit is the obvious choice in low-density or rural areas where fixed route transit doesn’t work or runs infrequently, but the operational costs are never going to be as low as fixed transit,” says Watkins.
In a typical fixed-route transit system, operational costs average around $4 per ride. Michael Hyland, assistant professor of civil and environmental engineering at UC Irvine, is currently modeling fare levels and structures for partnerships between microtransit and fixedroute transit to identify the most economically viable operational strategies. His research has shown that some microtransit services can have costs of some $40 per ride.
“I think we need to find locations where these services are really providing a lot of benefits to community members and only operate them there,” says Hyland.
“Human drivers are unreliable. You don’t know when they’re going to drop a ride. Robotaxis could increase operational efficiency by 12% to 15%.”
Michael Hyland, Ph.D., UC Irvine Institute of Transportation Studies
Like Uber and Lyft before them, San Francisco served as the launch site for commercial autonomous taxi (robotaxi) services. Cruise,* a General Motors company,
* As of December 2024, GM ceased funding its robotaxi operations and consolidated it into its broader autonomous and driver assist efforts.
began offering public rides in 2022; followed by Waymo, a subsidiary of Google’s company, Alphabet, in 2024; and Zoox, an Amazon company, in 2025. Unlike traditional ridehailing, robotaxis were not as frequently touted as a solution for transportation gaps. Shaheen notes that, whether people embrace them or not, robotaxis are expanding throughout California, the U.S., and around the world.
While robotaxis will almost certainly be limited to large metropolitan areas, they have the potential to reshape how on-demand mobility services are integrated with public transit. Hyland said that robotaxis could improve access to public transit by providing more efficient firstand last-mile connections.
“Human drivers are unreliable. You don’t know when they’re going to drop a ride. Robotaxis could increase operational efficiency by 12% to 15%,” notes Hyland.
However, that’s far from a sure thing. Hyland explained that it depends on whether personal ownership of driverless vehicles becomes widespread. His modeling indicates that a system of driverless minibuses utilizing express lanes on LA freeways to serve commuters working in DTLA (downtown LA), could decrease congestion by 5% in the urban core.7 Conversely, if people primarily commute in personally owned driverless vehicles, 40% of VMT could stem from deadheading to parking locations.8
RIMI researchers agree that automation represents a transformative shift for pooled ridehailing and microtransit. With the right policies, it could enable full integration of on-demand mobility services with public transit while also reducing VMT. Conversely, poorly designed policies could cause traffic gridlock in city centers and significantly increase emissions.
“We need to keep our eyes on what is happening with automation,” says Shaheen. “Because technology can take on a life of its own.”

1 Martin, E., Shaheen, S., & Wolfe, B. (2024). Environmental Impacts of Transportation Network Company (TNC)/Ride-Hailing Services: Evaluating Net Vehicle Miles Traveled and Greenhouse Gas Emission Impacts within San Francisco, Los Angeles, and Washington, D.C. Using Survey and Activity Data. Sustainability, 16(17), 7454. https://doi.org/10.3390/su16177454
2 Darling, W., & Cassidy, M. J. (2024a). Could Transportation Network Companies help Improve Rail Commuting? [Policy Brief]. The University of California Institute of Transportation Studies. https://doi.org/10.7922/G2GH9G8M
3 Darling, W., & Cassidy, M. J. (2024b). Subsidizing Transportation Network Companies to Support Commutes by Rail (Research Report No. UCITS-2022-24). The University of California Institute of Transportation Studies. https://doi.org/10.7922/G2BR8QHF
4 Pike, S., & Kazemian, S. (2020). Influential Factors in the Formation of Partnerships Between Ridehail Companies and Public Transportation (Research Report No. UC-ITS-2019-08). The University of California Institute of Transportation Studies. https://doi.org/10.7922/G2BK19NW
5 Watkins, K. E., Ferris, B., Borning, A., Rutherford, G. S., & Layton, D. (2011). Where Is My Bus? Impact of mobile real-time information on the perceived and actual wait time of transit riders. Transportation Research Part A: Policy and Practice, 45(8), 839–848. https://doi.org/10.1016/j.tra.2011.06.010
6 Drake, J., & Watkins, K. (2024). An evaluation of on-demand transit user and interested-non-user characteristics and the factors that attract the transit-curious to using on-demand transit. Travel Behaviour and Society, 37, 100868. https://doi.org/10.1016/j.tbs.2024.100868
7 Bahk, Y., Hyland, M., & An, S. (2024). Re-envisioning the Park-and-Ride concept for the automated vehicle (AV) era with Private-to-Shared AV transfer stations. Transportation Research Part A: Policy and Practice, 181, 104009. https://doi.org/10.1016/j.tra.2024.104009
8 Bahk, Y., & Hyland, M. (2025). Household activity pattern problem with automated vehicle-enabled intermodal trips. Transportation Research Part C: Emerging Technologies, 170, 104930. https://doi.org/10.1016/j.trc.2024.104930
In 2022, the California Department of Transportation (Caltrans) adopted the so-called Safe System Approach to road safety as its framework for achieving the State’s goal of zero transportation-related fatalities and serious injuries by 2050. Earlier policies assumed that a certain number of roadway fatalities were unavoidable in a complex transportation system. In contrast, the Safe System Approach centers on saving lives and aims to modify the transportation system so that inevitable human errors don’t have fatal outcomes. A related policy, Vision Zero, was introduced in San Francisco in 2014 to eliminate traffic deaths within the city in ten years. It has fallen short of that objective.
According to the California Statewide Integrated Traffic Records System, San Francisco saw 26 pedestrian fatalities in 2024—five more than the year Vision Zero was
launched. California as a whole hasn’t fared much better. Figures compiled by the National Highway Traffic Safety Administration (NHTSA) indicate that traffic fatalities rose from about 3,100 in 2013 to just over 4,000 a decade later in California. Although fatalities declined from the postpandemic peaks of 2021 and 2022, they are well above earlier levels.
To support California’s Safe System goals, researchers with the University of California’s Institute of Transportation Studies (UC ITS) compiled and analyzed decades of road-crash research. Their findings show that reducing vehicle speeds, redesigning roads, and encouraging shifts to transportation modes are critical to eliminating traffic-related fatalities and serious injuries.
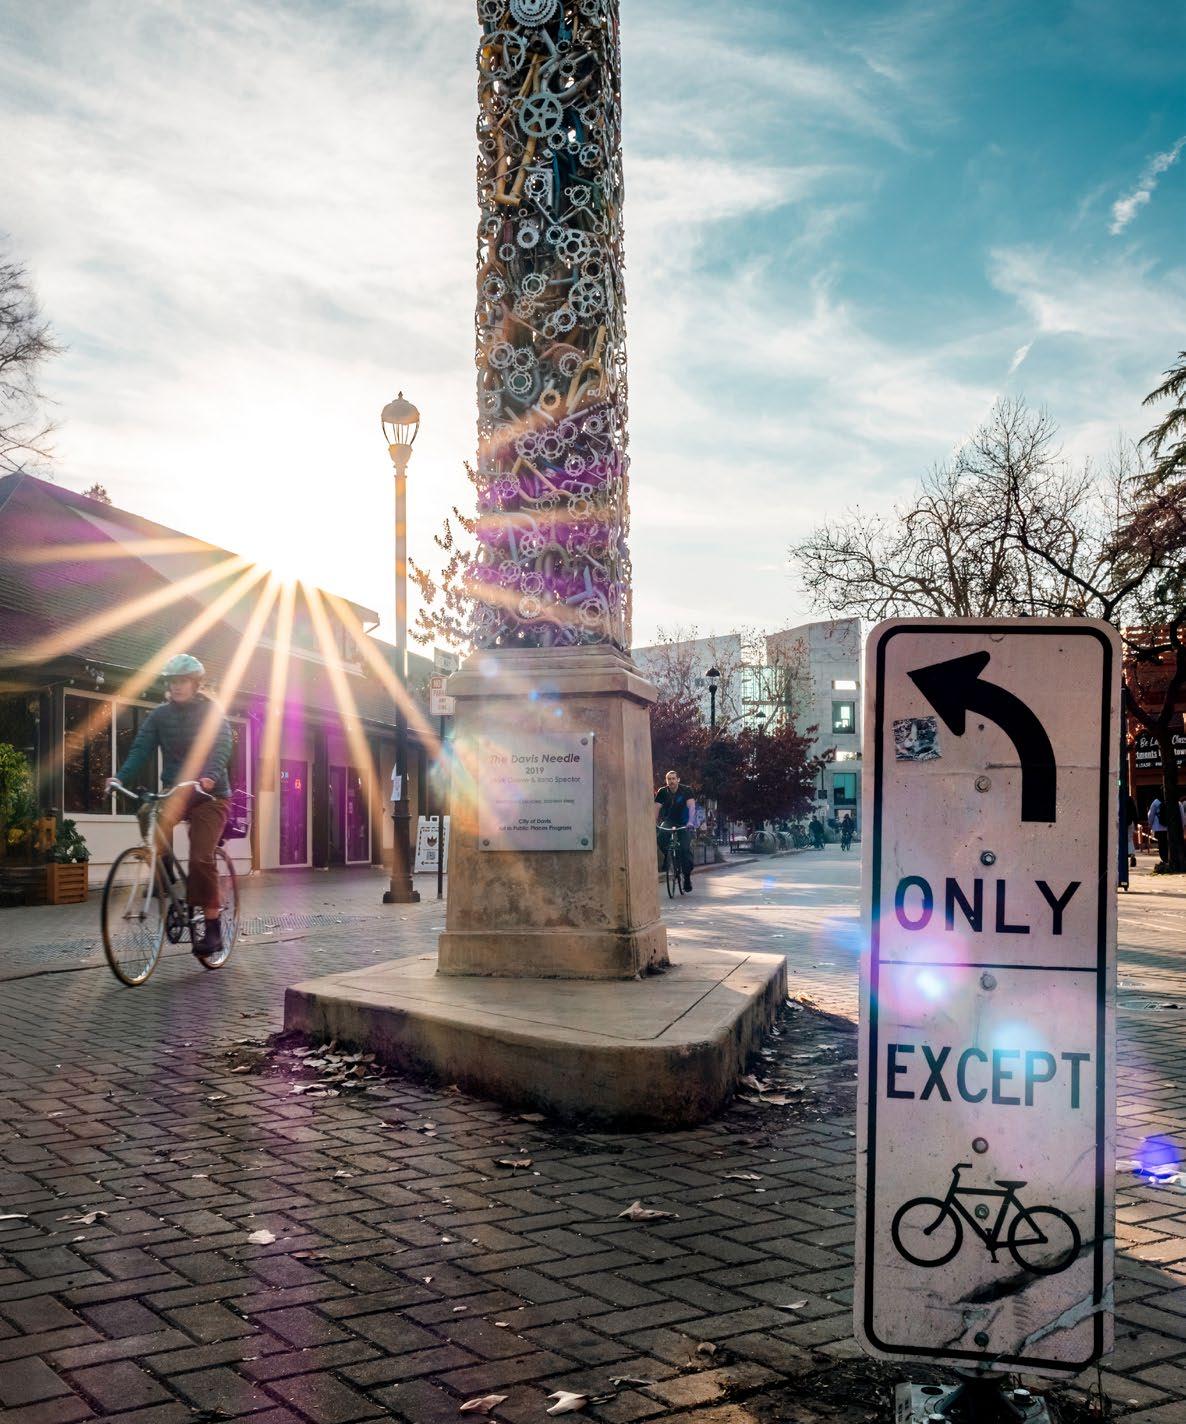
The California Vehicle Code sets default speed limits for certain road types and conditions. If an agency or municipality wants to post a lower speed limit on a specific road, it must conduct an engineering and traffic survey that measures the speed of vehicles. Under state law, the posted speed limit generally must be set within 5 miles per hour (mph) of the speed at or below which 85% of drivers travel on that road (the “85th percentile” rule). In urban settings, this approach is problematic because many drivers may not fully perceive surrounding safety risks, leading them to travel at higher speeds.
A 2020 UC ITS research synthesis paper for the state’s Zero Traffic Fatalities Task Force1 found that the amount of energy transferred in a collision increases with a vehicle’s speed. Beyond certain speed thresholds, the risk of death for drivers, bicyclists, and pedestrians rises sharply— and the 85th percentile speed limit often exceeds those thresholds. In a related study,2 Julia Griswold, director of the UC Berkeley Safe Transportation Research and Education Center, compared speed limit policies in the United States with those in several other countries. She found that speed limits based on driver behavior, such as the 85th percentile rule, consistently result in higher traffic speeds.
The study also laid out a framework for setting safer speed limits based on contextual factors, including pedestrians and bicyclist activity and adjacent land uses. For instance, a divided freeway outside of a major city, with no pedestrian or bicycle traffic, can safely support a higher speed limit. By contrast, a major urban arterial running through a downtown or retail district should have a lower speed limit than other arterials because of the high volume of pedestrians and bicyclists. Residential streets should have moderate speeds, reflecting their role in balancing local access and safety rather than prioritizing high-speed travel or placemaking activities.
“We need to acknowledge that the design of our roads is encouraging speeding behavior.”
“We need to acknowledge that the design of our roads is encouraging speeding behavior,” says Griswold. “Most people intend to drive safely, and the transportation system should be designed to help them do so.”
UC Berkeley research on vehicle mass shows that while heavier vehicles provide greater protection for drivers and passengers inside, they pose significantly higher risks to pedestrians and occupants of other vehicles.3 Each additional 1,000 pounds in a striking vehicle’s weight increases the likelihood of fatality for those struck by 47%. Since 1988, vehicle weights in the United States have risen by an average of 20%, a trend that likely contributes to the growing number of traffic-related fatalities. Because state regulators have limited tools to discourage the purchase of heavier vehicles (such as registration fees on heavier vehicles), roadway design changes that reduce traffic speeds are especially important for improving safety.
The UC ITS research synthesis for the Zero Traffic Fatalities Task Force aggregated multiple studies on traffic calming measures that successfully decrease roadway fatalities. The findings show that narrower travel lanes can reduce average vehicle speeds by up to 4.9 mph. Road diets—such as converting four-lane arterials into two travel lanes with a center turn lane and bicycle lanes—can reduce speeds by up to 5 mph. Speed bumps and chicanes (roadway curves) reduce speeds by some 3 mph in their immediate vicinity. In addition, median barriers separating opposing traffic lanes reduce collision fatalities by as much as 80%, and roundabouts reduce collisions up to 76%.
Julia Griswold, Ph.D., UC Berkeley Institute of Transportation Studies
Modifying the built environment through road design is an effective way to improve safety, but according to Kari Watkins, a professor of civil and environmental engineering at UC Davis, the most impactful interventions may occur at the socioeconomic level. Watkins coauthored a paper4 that proposes a new safety framework for traffic safety. Earlier frameworks, like “the Three Es” (engineering, education, and enforcement), place much of the responsibility for safety on individual drivers. This is problematic because, as noted earlier, drivers are often unaware of all the factors at play.
Watkin’s Safe Systems Pyramid framework (see figure on page 35) identifies five intervention areas and ranks
them by their population-level effectiveness and the level of individual effort they require. Driver education sits at the top of the pyramid, reflecting its high reliance on individual effort and its relatively small impact at the population level. The built environment—including road design and modifications—appears at the fourth level. At the base of the pyramid are socioeconomic factors, which require the least individual effort and have the greatest population-level effect.
These include policies that reduce the need for driving, such as promoting dense housing near public transit.
Watkins notes that these measures offer multiple benefits: increasing housing supply, supporting public transit, and enhancing quality of life through safer, more walkable, and less polluted neighborhoods.
“We have to solve housing problems in California, and we have to support public transit,” said Watkins. “If we only focus on safety policies that continue to promote singleoccupant automobile transportation, our progress on safety will continue to be slow.”
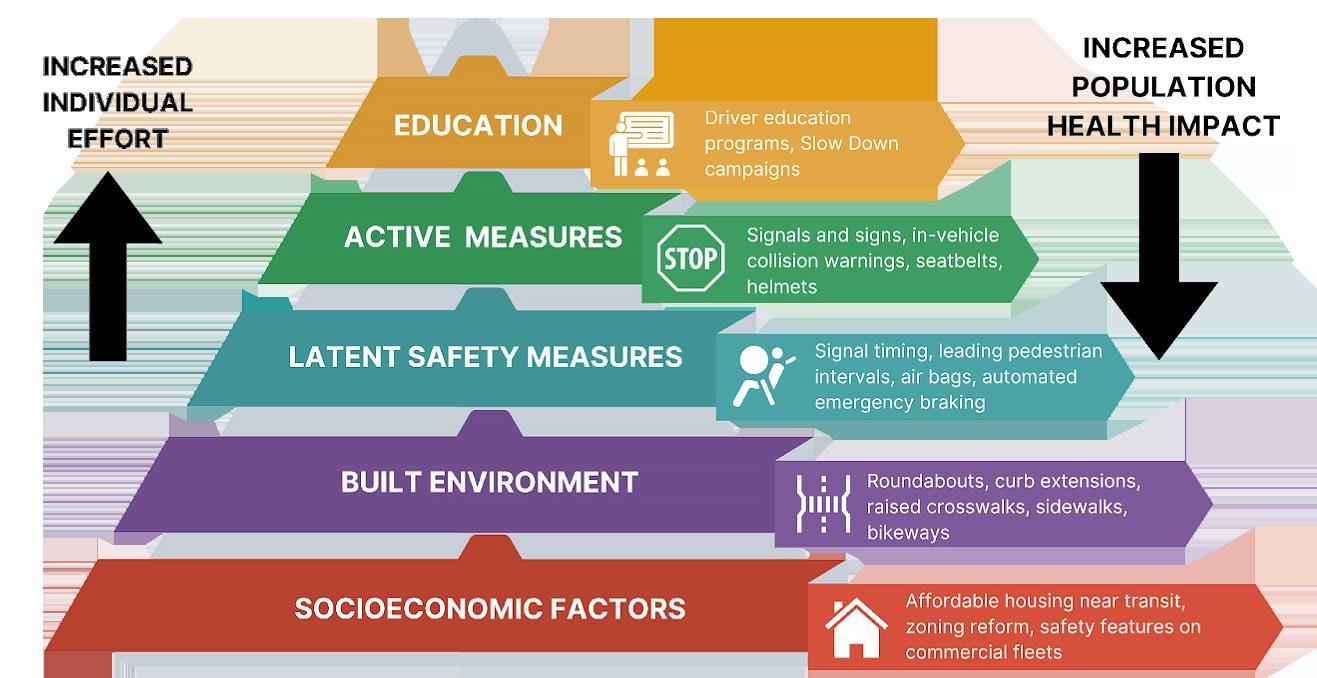
1 Grembek, O., Chen, K., Taylor, B. D., Hwang, Y. H., Fitch, D., Anthoine, S., Chen, B., & Grover, S. (2020). Research Synthesis for the California Zero Traffic Fatalities Task Force (Research Report No. UC-ITS-2020-01). The University of California Institute of Transportation Studies. https://doi.org/10.7922/ G2KP80DW
2 Hsu, C.-K., Tsao, M., Moran, M. E., Griswold, J. B., Schneider, R. J., & Bigham, J. M. (2025). A context-sensitive roadway classification framework for speed limit setting in the US. Transportation Research Interdisciplinary Perspectives, 33, 101621. https://doi.org/10.1016/j.trip.2025.101621
3 Anderson, M. L., & Auffhammer, M. (2014). Pounds That Kill: The External Costs of Vehicle Weight The Review of Economic Studies, 81(2), 535–571. https://doi.org/10.1093/restud/rdt035
4 Ederer, D. J., Panik, R. T., Botchwey, N., & Watkins, K. (2023). The Safe Systems Pyramid: A new framework for traffic safety. Transportation Research Interdisciplinary Perspectives, 21, 100905. https://doi.org/10.1016/j.trip.2023.100905
Timothy Lipman’s family has a Tesla Powerwall in their garage. With reduced energy use, the home battery can provide electricity for two to three days during a power outage, but it has other benefits as well. Lipman participates in California’s Emergency Load Reduction Program (ELRP), which allows him to sell his stored electricity back to the grid during peak summer electricity use periods. Lipman says that his electricity provider, Pacific Gas and Electric (PG&E), paid him about $150 in each of the past few summers to discharge the Powerwall to meet electricity demand elsewhere.
Lipman, co-director of ITS Berkeley’s Transportation Sustainability Research Center, knows that at about $15,000 for purchase and installation (before incentives), a Powerwall might never be a top priority for many homeowners, but he thinks there may be a better solution for most people. Parked just beside the Powerwall in Lipman’s garage is an electric vehicle (EV) that can store six times as much electricity. Achieving California’s clean energy goals will require that excess renewable energy be stored for later use, and Lipman sees an opportunity to store that electricity in EVs.
“If we think of EVs as better, more flexible energy storage, then saving renewable energy for later use becomes much more manageable,” says Lipman.
California set a bold goal for all new cars and trucks sold in the state to be zero emission by 2035, but federal action has put the plan on hold, and the state is now challenging it in court. By 2035, there could be an estimated 15.2 million EVs in the state. Whether those EVs are drawing power to charge their batteries or discharging power for use elsewhere, they’ll be transferring an immense amount of energy through the grid. Accommodating that transfer will require infrastructure changes and a paradigm shift for EV drivers. They’ll no longer be passive receivers of fixedrate energy but collaborators in California’s smart grid.
California generates nearly a quarter of its total electricity from solar power facilities, which serve the grid’s needs very well during daylight hours but generate next to no electricity as people are returning home from work and increasing their energy use. In recent years, daytime electricity demand has often been lower

than the output from solar power, resulting in wasted renewable energy.
To correct this problem, California is building giant batteries, including the world’s largest solar generation and battery storage development, which will store enough electricity to power some 850,000 homes for four hours. With increasing demand for electricity from the data centers used by artificial intelligence, even those massive batteries may not provide all the storage needed in the future. Lipman sees the millions of EV batteries set to hit the roads as a potential source of extra energy storage.
Lipman conducted several studies1 2 3 to help California prepare for the growing number of EVs and ensure they support, rather than strain, the electric grid. His research highlights the importance of enhancing vehicle-to-grid (V2G) capabilities. Every EV is equipped with a builtin inverter that converts the battery’s direct current (DC) into alternating current (AC) to power the electric motor. This same inverter can also be used in reverse to send electricity back into the grid, a feature enabled by bidirectional inverters.
In 2024, California passed legislation requiring that all new EVs sold in the state include bidirectional inverter capability, with the implementation timing set by state
agencies. Lipman, however, would like to see the state go further. He recommends allowing EV owners to participate in demand reduction programs like ELRP and the Self-Generation Incentive Program (SGIP), which offers $7,500 incentives for low-income households that install paired solar and battery storage systems.
Lipman also recommends that the state set targets for the number of EVs participating in managed charging programs. These programs use algorithms to determine the best time to charge, balancing electricity costs, greenhouse gas (GHG) emissions, and grid stability—a strategy known as smart charging. At full capacity, Lipman says smart charging would partially charge EV batteries overnight and complete the remaining charge during the day, potentially while the driver is at work.
“All those EV batteries are a perfect place to put excess daytime solar energy, which could help decrease the need for massive stationary batteries,” says Lipman.
Alan Jenn, an associate professor of civil and environmental engineering at UC Davis, compared the effects of smart charging with conventional charging.
“EVs and renewables could make electricity cheaper for everyone.”
Alan Jenn, Ph.D., UC Davis Institute of Transportation Studies
He found4 that smart charging could significantly reduce GHG emissions and save the state $30 billion in avoided electricity generation and storage costs over 20 years.
This approach of integrating EVs into the electric grid–through smart charging, requiring bidirectional inverter capability, and using batteries to store excess electricity–is called vehicle-grid integration (VGI). However, realizing the benefits of VGI is not as simple as incentivizing new charging schedules. According to Jenn, the electric grid will need major upgrades.
“Bulk power generation is not a big problem,” says Jenn. “Local distribution and infrastructure are where the story gets more interesting.”
Jenn used PG&E data to model5 the electricity demand of six million EVs in Northern California and found that 20% of the utility’s circuits would need upgrades to handle the increased electricity demand. Jenn said that much of the stress occurs at local transformer stations, which heat up to meet daytime demand and then cool at night when demand drops.
If half the people in a given neighborhood switch to EVs— even with managed charging—the local transformer may never get sufficient time to cool down, and this could substantially reduce its lifespan.
Jenn estimates that upgrading the distribution infrastructure will cost between $10 and $20 billion. Those costs will ultimately be passed on to ratepayers. However, the additional electricity demand from millions of EVs could spread these costs over higher sales volumes, potentially putting downward pressure on rates—an important benefit, with affordability of electricity rates being a top policymaker priority. In addition, as more renewable energy plants and battery
storage are added to the grid, California will rely less on fossil fuels, helping utilities avoid fuel price fluctuations and further stabilizing rates.
“EVs and renewables could make electricity cheaper for everyone,” says Jenn.
Both Lipman and Jenn said that the main obstacle to achieving California’s EV and clean energy goals is not technology or cost but federal opposition. President Donald Trump has made no secret of his disregard for EVs, and in 2025, he signed a joint resolution by Congress to rescind the Environmental Protection Agency’s Clean Air Act waiver, which allowed California to enforce increasingly stringent EV adoption standards. Though California Governor Gavin Newsom is challenging the repeal in court, Trump’s efforts to pause the disbursement of funds allocated to clean energy and climate projects under the Bipartisan Infrastructure Law and Inflation Reduction Act further complicate California’s clean energy transition.
Despite the federal uncertainty, Jenn is still optimistic because new EV sales in California continue to grow. He’s also conducted consumer surveys that consistently show strong demand for EVs in California, both with and without tax incentives. Jenn’s optimism was bolstered when the California Energy Commission reported that, in the third quarter of 2025, zero emission vehicles accounted for 29.1% of all new car sales in the state6—the highest quarterly sales share ever recorded.
“I think EV adoption will continue to grow despite some of the challenges we might see,” says Jenn.
Plugged
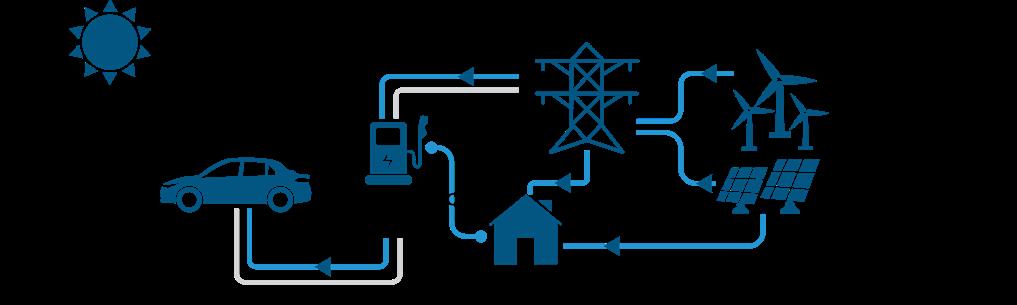
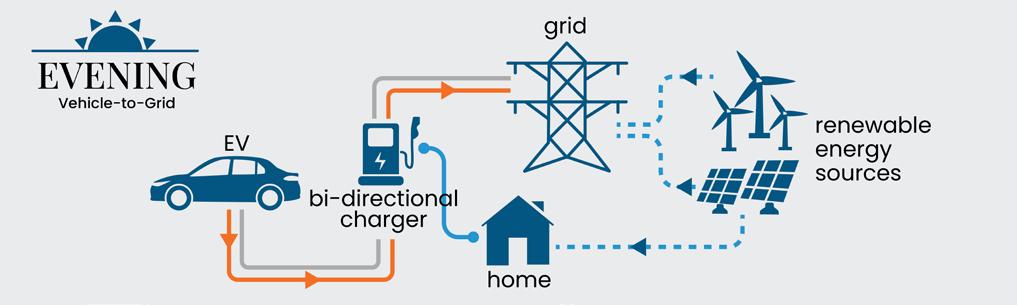
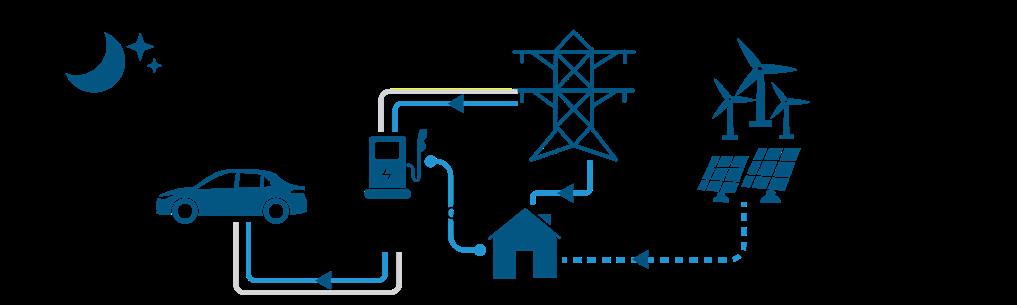
Vehicle-to-grid integration. For most of the day and night, the grid and other renewable energy sources are supplying power to the electric vehicle through the charger. In the evening, during peak power usage times when people are getting home from work, the vehicle battery is supplying electricty back to the grid to help alleviate large spikes in electricity use.
1 Lipman, T., & Yuan, Y. (2025). Electric Vehicle Charge Management Strategies to Benefit the California Electricity Grid (Research Report No. UCITS-RIMI-3K). The University of California Institute of Transportation Studies. https://doi.org/10.7922/G2WS8RK2
2 van Triel, F., & Lipman, T. E. (2020). Modeling the Future California Electricity Grid and Renewable Energy Integration with Electric Vehicles. Energies, 13(20), 5277. https://doi.org/10.3390/en13205277
3 Lipman, T., Harrington, A., & Langton, A. (2021). Total Charge Management of Electric Vehicles (No. CEC-500-2021-055). California Energy Commission. https://www.energy.ca.gov/publications/2021/total-charge-management-electric-vehicles
4 Jenn, A., & Brown, A. (2021). Green Charging of Electric Vehicles Under a Net-Zero Emissions Policy Transition in California (Research Report No. UC-ITS-2020-08). The University of California Institute of Transportation Studies. https://doi.org/10.7922/G28P5XTH
5 Jenn, A., & Highleyman, J. (2022). Distribution grid impacts of electric vehicles: A California case study. iScience, 25(1), 103686. https://doi. org/10.1016/j.isci.2021.103686
6 California, S. of. (2025, October 13). Record-breaking quarter: California reaches historic high in ZEV sales. Governor of California. https://www. gov.ca.gov/2025/10/13/record-breaking-quarter-california-reaches-historic-high-in-zev-sales/
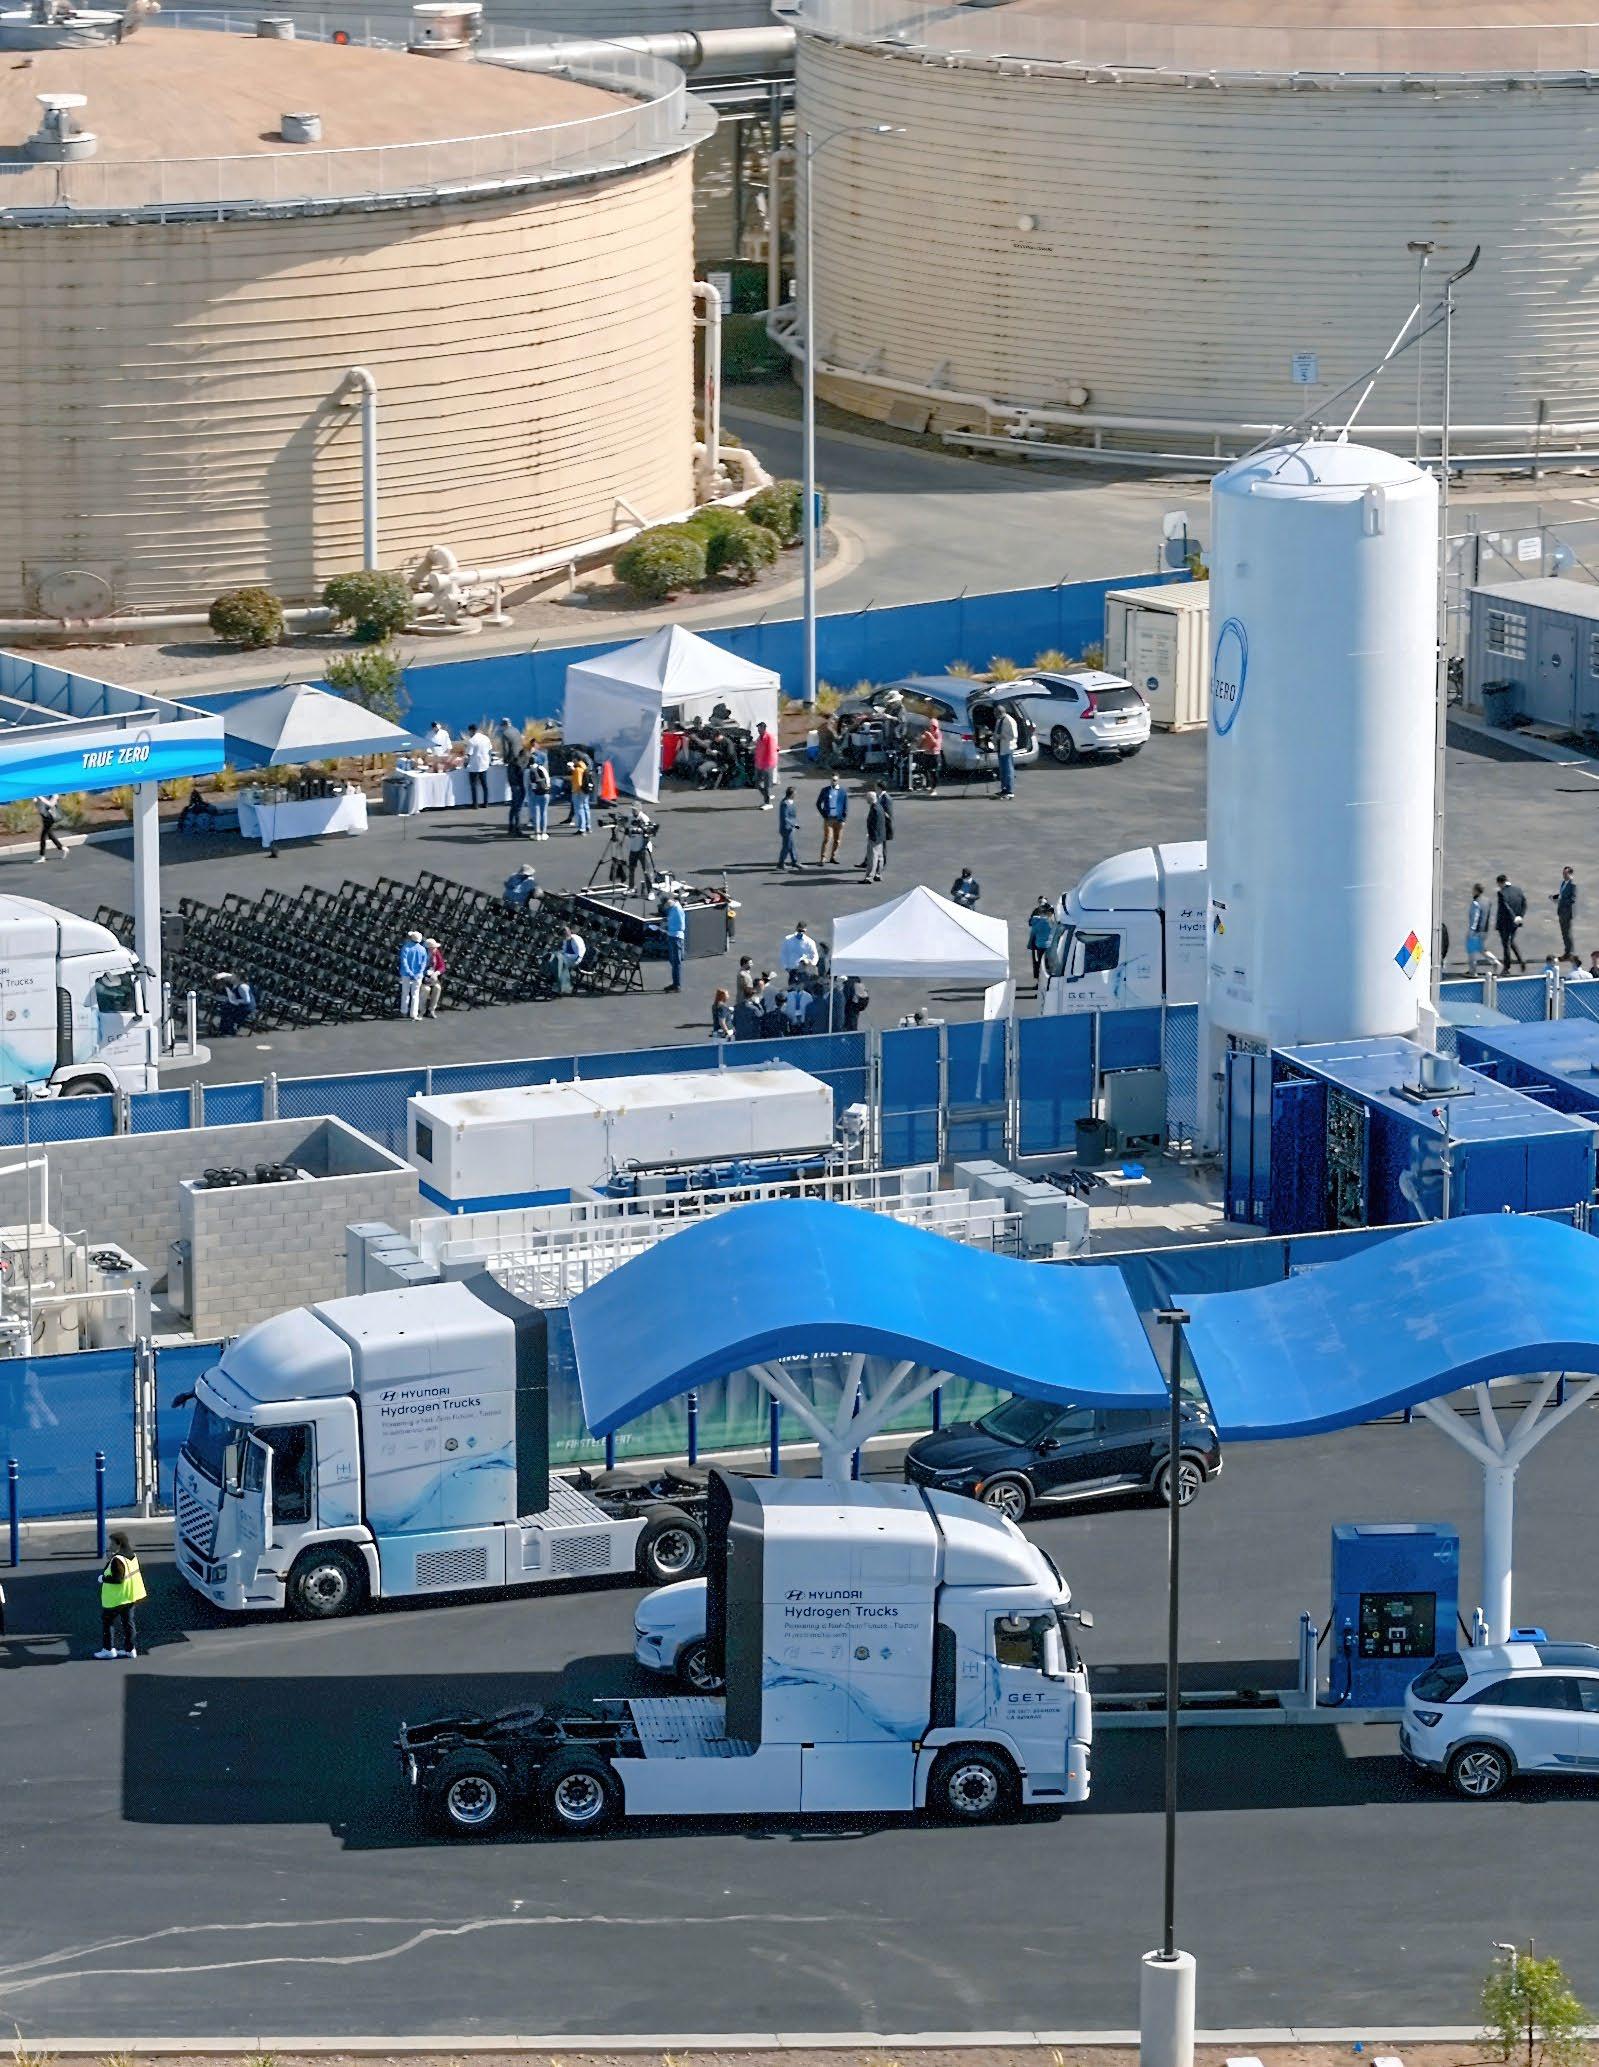
CALIFORNIA NEEDS A DIVERSIFIED TOOLKIT—HYDROGEN, BATTERIES, BIOFUELS, AND E-FUELS—TO CUT FREIGHT AND AVIATION EMISSIONS
In April of 2024, the first hydrogen refueling station in the United States for commercial trucks opened near the Port of Oakland. The station is operated by FirstElement Fuel and is part of the NorCal ZERO project, led by the Center for Transportation and the Environment and funded primarily by the California Air Resources Board (CARB) and the California Energy Commission (CEC). The project deployed 30 hydrogen fuel-cell electric trucks to handle drayage operations by transporting shipping containers from the Port of Oakland to warehouses across the San Francisco Bay Area and the Central Valley.
According to Port of Oakland representatives, an estimated 2,000 drayage trucks move shipping containers in and out of the port every day, and most run on diesel engines. In addition to greenhouse gas (GHG) emissions, diesel trucks spew very fine particulate matter, including soot and metallic particles, into the air, which increases cancer and asthma risks in nearby communities. Converting all those trucks to zero-emission vehicles (ZEVs) would significantly cut GHG emissions and improve public health. However, according to Timothy Lipman, co-director of ITS Berkeley’s Transportation Sustainability Research Center, achieving such wins will involve more than simply switching from diesel trucks to hydrogen-powered ones.
“Buses and medium-distance delivery trucks can be somewhat challenging to decarbonize, but long-haul trucking, ocean shipping, and aviation are very hard,” says Lipman.
“ZEV deployment impacts small and large fleet operators differently, since small fleets tend to face higher per-unit costs and have fewer resources compared to larger fleets.”
Craig Rindt, Ph.D., UC Irvine Institute of Transportation Studies
NorCal ZERO is one of many incentives and regulations CARB is advancing to help California reach its goal of net carbon neutrality by 2045. While decarbonizing transportation won’t be easy, cutting emissions in sectors like consumer vehicles and electricity generation is more straightforward than addressing emissions from trucking, marine shipping, and aviation. Researchers with the University of California’s Resilient and Innovative Mobility
Initiative (RIMI) note that there are no one-size-fits-all solutions for these harder-to-decarbonize sectors. For example, ZEV deployment impacts small and large fleet operators differently. Craig Rindt, a project scientist at the Institute of Transportation Studies at UC Irvine, says “small fleets tend to face higher per-unit costs and have fewer resources compared to larger fleets.”1 A mix of strategies and emerging technologies will be necessary, and for some sectors, achieving zero emissions may not be feasible.
Lipman evaluated the NorCal ZERO project for a CARB/ CEC report.2 His research team found that the project not only prevented some 696 metric tons of GHG equivalent emissions but also created jobs and helped lay the groundwork for the next generation of more efficient, liquid hydrogen stations capable of serving hundreds of trucks per station. From the driver’s point of view, hydrogen is similar to diesel, with fueling times of about 15 minutes. Even so, Lipman says hydrogen is unlikely to become the standard fuel for all commercial trucks in California.
Hydrogen is a complex fuel. It must be compressed and cooled to cryogenic temperatures to be stored as a liquid at the fueling station. It is then converted to a compressed gas and transferred to a vehicle, which must have high-pressure storage vessels that add to vehicle costs. While hydrogen fuel cell vehicles produce no tailpipe GHG emissions, most hydrogen is still derived from natural gas in a process known as steam methane reforming. Efforts to scale cleaner production methods, such as the ARCHES Hydrogen Hub Project, aimed at lowering the cost of electrolytic hydrogen (splitting water into hydrogen and oxygen), have faced setbacks after the Trump administration canceled its federal funding. Hydrogen fuel cell trucks also remain more expensive than battery electric and diesel trucks.
Taken together, these challenges make battery electric trucks seem more feasible than hydrogen, but Lipman says they have limitations of their own. Extending driving range requires bigger batteries, which draw more electricity and take longer to charge. Multi-hour charging times can disrupt driver schedules, and recent federal policy reversals have created uncertainty around incentives and requirements for ZEV trucking. Lipman says policymakers can help address these issues by directing funds from CARB’s Cap-and-Invest program toward fast charging infrastructure for commercial vehicles. One challenge, however, cannot be solved with incentives alone—batteries are heavy. Because federal weight limits
are designed to protect roadways, commercial trucks with large, heavy battery packs must haul lighter loads.
“Load volume will be the constraint. You won’t overload a truck with potato chips, but with beverages, frozen seafood, or auto parts, you might,” says Lipman.
Hydrogen is best suited for trucks hauling heavier loads and longer distances, while battery electric motors are a better fit for low- to mid-range (100 to 300 miles per day) trucking. Lipman’s research3 on hydrogen and battery electric buses illustrates this distinction. He says that battery-powered buses are working well for public transit agencies, but some are using hydrogen buses for more demanding applications. He notes that a study of diesel, diesel hybrid, battery electric, and hydrogen fuel cell buses in the Alameda-Contra Costa County Transit system found that battery electric buses achieved the highest fuel efficiency—about three times that of new model diesel buses. These buses operate on routes with many stops and hills, where the differences between the electric and diesel buses are particularly large. Battery electric buses also had the lowest total cost of ownership. Despite these findings, Lipman cautions that a 100% battery electric bus fleet may not be ideal in some settings, since range in rural areas can be an issue, and battery efficiency is moderately affected by very high and low temperatures.
Biofuels
Drayage trucks are only one part of the effort to decarbonize ports. Much of the cargo handling equipment can be electrified and connected to the power grid or operated through battery systems. Decarbonizing cargo ships, by contrast, is far more challenging. The largest cargo ships are over 1,300 feet in length and can carry roughly 24,000 containers, weighing more than 200,000 tons. Transporting that much mass across an ocean requires enormous amounts of energy, and with no charging infrastructure in the middle of the Pacific, battery power is not a viable option.
Cargo ships could be powered by hydrogen fuel cells, but storing hydrogen as a compressed gas takes valuable space that could otherwise be used for cargo. Liquid hydrogen is more compact, but it must be kept at extremely low (cryogenic) temperatures, adding cost and complexity. Ammonia is another potential fuel. It doesn’t need refrigeration, is widely produced for fertilizer and industrial uses, and, because of its dense molecular structure, contains more hydrogen by volume than liquid
hydrogen. However, concentrated ammonia is highly toxic and could be deadly if accidentally released.
“A breached ammonia tank in a major port could be an environmental disaster the likes of which we’ve never seen,” says Colin Murphy, co-director of the Energy Futures Research Program at the UC Davis Institute of Transportation Studies.
Murphy studies alternative fuels and identifies two main categories for shipping. He argues that the most viable long-term solution for cargo ships is probably synthetic hydrocarbons produced using renewable electricity (e-fuels) or biofuels. E-fuels are hydrocarbons manufactured by capturing carbon dioxide (CO2) from the atmosphere or industrial exhaust and combining it with hydrogen produced through electrolysis. E-fuels can be drop-in replacements for petroleum fuels, and their widespread use could create economic incentives to remove excess CO2 from the atmosphere. However, they are currently very costly and energy inefficient.
Given the need to retire fossil-fueled power plants while also meeting rising electricity demand from buildings, EVs, and data centers, it might take a decade or more before enough clean electricity is available to support large-scale e-fuel production without extending the life of fossil-fueled power plants. That lag leaves time to keep improving the technology’s efficiency. In the near term, however, Murphy says biofuels, which carry their own environmental risks and compete with food production for agricultural land, will have to suffice.
The biofuel that may be the easiest to integrate into shipping is methanol. Methanol is an alcohol that is chemically simpler than ethanol, which is commonly blended with gasoline to reduce emissions. Dual-fuel ship engines that can run on either diesel and methanol are already being deployed, and while methanol is still toxic, it is far less dangerous than ammonia. When used as a fuel, methanol is estimated to produce lower GHG emissions than diesel, but as with ethanol, its overall GHG reduction potential depends on how it is produced.
Today, methanol, like hydrogen, is most often produced as an industrial chemical from natural gas. It can be produced more sustainably from biomass through gasification. In this process, agricultural waste, such as corn stalks, are heated to release carbon monoxide and hydrogen. These gases are then combined into synthesized gas and converted into methanol or other useful chemicals. As with many alternative fuels, producing cellulosic bio-methanol is not yet costeffective. A detailed analysis of cellulosic biofuels4 by Julie Witcover, a scientist at the UC Davis Institute of
Transportation Studies, found that persistently low oil prices, among other factors, have reduced their competitiveness. Murphy notes5 that crop residues are typically tilled back into the soil after harvest, and removing this plant material to produce biofuels can reduce the amount of carbon stored in the soil, limiting the potential carbon benefits of the biofuel.
Limits on the availability of sustainable biomass means that biofuels are likely to supply only a small share of the transportation fuel. Even so, every opportunity to reduce emissions matters. Novel crops and cultivation practices, such as growing feedstocks outside the primary growing season or using degraded or low-yielding land, could expand biofuel supply without competing with food production. Technologies to convert cellulose—the fibrous, inedible material that makes up most plant matter—have struggled to reach their full potential, but they remain promising. Murphy says we should continue to fund research and demonstration projects.
“The reason we have cheap lithium-ion batteries today is because we invested in expensive lithium-ion batteries 20 years ago,” says Murphy.
Aviation might be the hardest sector to decarbonize. Given weight constraints, battery electric airplanes are not realistic for anything but regional flights.6 While companies like Airbus have begun exploratory research into hydrogen fuel cell planes, they are likely to remain limited in size and range, making it unrealistic to replace the more than 7,000 commercial aircraft in the United States with smaller hydrogen fuel cell models. According
to Lipman and Murphy, unless there is a breakthrough in e-fuels or algae-based biofuels, sustainable aviation fuel (SAF)7 is the most feasible strategy.
Hydroprocessed esters and fatty acids (HEFA) is currently the only SAF production technology deployed at large scale with demonstrated cost-effectiveness. HEFA processes vegetable oils and animal fats producing a fuel that can serve as a drop-in replacement for aviation fuel. The carbon intensity of SAF depends largely on what it’s made from. Fuels made from waste materials like used cooking oil or tallow can cut carbon emissions by half or more. Emission impacts of SAF made from vegetable oil are more complex to assess. Murphy estimates they are currently about 20% cleaner than petroleum fuels, while others conclude they emit more carbon over their full lifecycle than conventional petroleum jet fuel.
SAF technology is very promising, but Witcover and Murphy studied SAF production8 and found that available feedstocks are far too limited to meet the needs of the aviation industry, largely due to constraints on agricultural land. Dedicating prime farmland to grow soybeans for vegetable oil used in making SAF is not ideal. While wastes like used cooking oil or tallow may be more carbon friendly, there just isn’t enough supply to serve more than a small fraction of global aviation fuel demand. Given these uncertainties, aviation may never be completely decarbonized, and Murphy says that’s okay, as long as the sector can reduce its carbon footprint. While aviation has a well-earned reputation as a carbon-intensive sector, the industry accounts for only about 2% to 3% of total global CO2 emissions. It pales in comparison to the 15% produced by automobiles and the 25% to 30% from agriculture.
1 Bae, Y., Ritchie, S. G., & Rindt, C. R. (2025). Small and Large Fleet Perceptions on Zero-emission Trucks and Policies [White Paper]. The University of California Institute of Transportation Studies. https://escholarship.org/uc/item/3xq588x4
2 Shultz, J., Fank, C., Levin, J., & Rinaldi El-Abd, N. (2025). NorCAL ZERO: Zero-Emission Regional and Drayage Operations with Fuel Cell Electric Trucks (No. CEC-600-2025-032). California Energy Commission. https://www.energy.ca.gov/publications/2025/norcal-zero-zero-emission-regionaland-drayage-operations-fuel-cell-electric
3 Lipman, T. E. (2025). Recent Developments and Challenges with Electric Bus Implementation for Transit Fleets. Current Sustainable/Renewable Energy Reports, 12(1), 19. https://doi.org/10.1007/s40518-025-00267-8
4 Witcover, J. (2021). What Happened and Will Happen with Biofuels? Review and Prospects for Non-Conventional Biofuels in California and the U.S.: Supply, Cost, and Potential GHG Reductions (White Paper No. NCST-UCD-WP-21-23). National Center for Sustainable Transportation. https://doi. org/10.7922/G26W98D7
5 Ro, J. W., Murphy, C. W., & Wang, Q. (2023). Fuel Portfolio Scenario Modeling (FPSM) of 2030 and 2035 Low CarbonFuel Standard Targets in California (Research Report No. UC-ITS-RIMI-3L). The University of California Institute of Transportation Studies. https://doi.org/10.7922/G2S46Q8C
6 McCall, T. (2011). Although costs are uncertain, they will be key to the success of electric cars. Technology Review, 114(1).
7 Despite the word “sustainable” in the name, not all alternative aviation fuel is truly sustainable or lower-emitting than petroleum alternatives. The term “SAF” has been adopted as shorthand by most of the industry, and this article follows that practice, with the caveat that the actual sustainability of a so-called SAF must be determined on a case-by-case basis.
8 Witcover, J., & Murphy, C. W. (2023). Aviation Fuels – Exploring Low Carbon Options Under Current Policy (Research Report No. UC-ITS-2020-13). The University of California Institute of Transportation Studies. https://doi.org/10.7922/G2D21VXJ
In September of 2019, California Governor Gavin Newsom signed Assembly Bill 5 (AB 5), which amended the California Labor Code to clarify the conditions under which workers could be classified as independent contractors. Governor Newsom and other supporters intended for AB 5 to require transportation network companies (or ridehailing), such as Uber and Lyft, and courier network services (such as Instacart and Doordash) to reclassify their independent ‘gig’ economy drivers as employees eligible for minimum wage and benefits.
Though AB 5 did not explicitly mention gig drivers, Uber, Lyft, and DoorDash quickly mobilized to oppose it, spending over $200 million to promote a public ballot initiative, Proposition 22 (Prop 22), which passed the following year and exempted app-based gig drivers from AB 5. In October 2025, Governor Newsom signed two bills that created a compromise among gig drivers, unions, and ridehailing companies. Assembly Bill 1340 (AB 1340) grants gig drivers the right to unionize statewide, while Senate Bill 371 (SB 371) lowers insurance requirements for ridehailing companies, enabling them to reduce rider fees and potentially improve their competitiveness.
It’s viewed as a win-win outcome, but researchers with the University of California’s Resilient and Innovative Mobility Initiative (RIMI) note that gig drivers face challenges beyond pay and representation. Their research shows that opaque payment structures, unclear policies, pressure to transition to electric vehicles (EVs), and the looming possibility of being replaced by autonomous taxis (robotaxis) may continue to make gig driving difficult.
“Too many drivers are caught in a hamster wheel situation where they can’t get by without working longer and longer hours,” says Brooke Wolfe, a researcher with ITS Berkeley’s Transportation Sustainability Research Center.
As part of a two-year study, Wolfe and her colleague Susan Shaheen, a UC Berkeley civil and environmental engineering professor and the RIMI director, interviewed labor experts and surveyed gig drivers to provide detailed policy recommendations for regulators. Their findings are published in the journal of Travel Behaviour and Society1 and a RIMI policy brief.2 They report that a gig driver’s ability to earn a net profit depends heavily on whether gig work is their primary source of income.

Part-time drivers often don’t closely track their operating costs, while full-time gig drivers described a consistent pattern of being nickel-and-dimed.
Wolfe explains that many gig drivers described their work as ‘gamified’ by app companies to encourage longer hours. Drivers reported being offered bonuses that pushed them to work beyond their preferred schedules or during inconvenient times. Some said they asked passengers to share the fare shown in the app, only to learn that it was often much higher than what the driver received. Others recounted having their driver accounts deactivated (effectively terminating their ability to work) for unspecified reasons they believed were tied to declining certain rides.
The common refrain Wolfe heard from gig drivers, both full- and part-time, consistently emphasized the need for greater transparency in the apps. Drivers want to know the destination and full fee breakdown before accepting a ride, and they want a straightforward appeals process for account deactivations. The union that drivers ultimately choose to represent them will likely take up
many of these concerns, and policymakers will need to wait and see how those efforts unfold before determining which gaps still require action.
Senate Bill 1014 (SB 1014) created the Clean Miles Standard, which requires that 90% of all miles driven by ridehailing companies be in EVs by 2030. Gig drivers told Wolfe and Shaheen that they were worried about the high upfront cost of purchasing an EV. To better understand these costs, Shaheen surveyed 430 gig drivers and analyzed California Public Utilities Commission (CPUC) data covering 150 million ridehailing trips. The resulting study3 can help gig drivers assess whether EV adoption is financially viable based on their annual driving mileage.
Shaheen found that for most gig drivers, adopting EVs is not a feasible option. Her analysis showed that driving fewer than 100 miles per week is not profitable regardless of vehicle type, which encourages drivers to log more miles. For full-time drivers averaging 700 to 800 miles per week, leasing an EV is not practical, since most leases impose mileage limits. Exceeding these limits results in costly fees that eat into net earnings. Buying an EV can be
“Too many drivers are caught in a hamster wheel situation where they can’t get by without working longer and longer hours.”
Brooke Wolfe, UC Berkeley Institute of Transportation Studies
viable for full-time gig drivers, but only if the EV is new. At the time of Shaheen’s study, new EV buyers were entitled to a $7,500 federal tax credit, which was the primary factor in making ownership profitable. However, the federal EV tax credits were eliminated after September 30, 2025, making EV adoption even more challenging for gig drivers.
“This federal policy change has introduced significant uncertainty,” Shaheen says. “The state is evaluating whether and in what form to replace or redesign clean-vehicle incentives, including the California Air Resources Board’s Drive Forward initiative. By establishing a predictable framework for incentives and regulation, policymakers can give consumers, vehicle
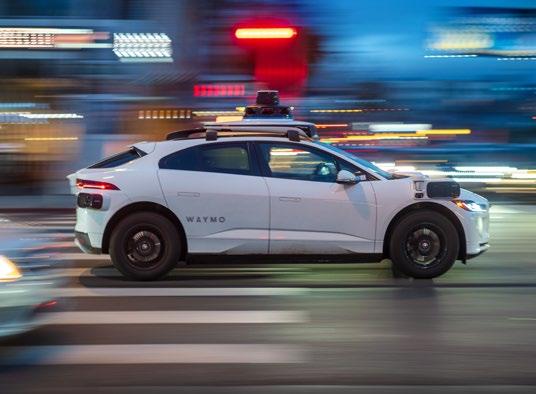
Photo by logoboom - stock.adobe.com
manufacturers, and infrastructure planners a clearer sense of what to expect.”
In a recent study4 and related policy brief,5 Shaheen notes that stakeholders could offer state-level incentives and do more to offset the loss of federal subsidies. She emphasizes that incentives and support should be tailored to the diverse needs of ridehailing drivers. State agencies, ridehailing companies, utilities, and housing developers should avoid one-size-fits-all strategies and instead create layered incentives that reflect driver type, income dependence, and access to charging. Stakeholders should collaborate to expand affordable EV options, improve charging availability and reliability, and align pricing or time-of-use charging rates with driver work patterns to enhance affordability.
Gig drivers told Wolfe and Shaheen that robotaxis are a concern, though not their most urgent one. Many fear that robotaxis will gradually reduce ridehailing demand, increasing pressure to work longer hours or seek trips farther from robotaxi operating areas. Shaheen notes that more research on automation’s impact on ridehailing is needed before more concrete policy options can be formulated, and workforce training should be part of the conversation.
1 Shaheen, S., Wolfe, B., & Cohen, A. (2026). Navigating the gig economy: Transportation labor challenges facing California’s app-based ridehailing and courier drivers. Travel Behaviour and Society, 44, 101218. https://doi.org/10.1016/j.tbs.2025.101218
2 Shaheen, S., Wolfe, B., Cohen, A., & Broader, J. (2024). Challenges and Opportunities Facing App-Based Gig Drivers Extend Beyond Driver Pay (Policy Brief No. UC-ITS-RIMI-4F-03). The University of California Institute of Transportation Studies. https://doi.org/10.7922/G2NS0S7S
3 Ju, M., Martin, E., & Shaheen, S. (2025b). Transitioning Ridehailing Fleets to Zero Emission: Economic Insights for Electric Vehicle Acquisition. World Electric Vehicle Journal, 16(3), 149. https://doi.org/10.3390/wevj16030149
4 Ju, M., Martin, E., & Shaheen, S. (2025a). Charging Ahead: Perceptions and Adoption of Electric Vehicles Among Full- and Part-Time Ridehailing Drivers in California. World Electric Vehicle Journal, 16(7), 368. https://doi.org/10.3390/wevj16070368
5 Shaheen, S., Martin, E., & Ju, M. (2025). Charging Ahead: How Income and Home Access Shape Electric Vehicle Adoption among Ridehailing Drivers (Policy Brief No. UC-ITS-2024-12-3W). https://doi.org/10.7922/G23X8513
Mobility 10x: Accelerating Transportation Innovation in California, highlights research conducted by the University of California Institute of Transportation Studies (UC ITS) through the Resilient and Innovative Mobility Initiative (RIMI), a four-year, $10 million effort launched in 2021 with one-time funding from the State of California. This magazine features ten stories showcasing RIMI’s impact, including collaborative research, policy insights, and projects across the UC ITS campuses at Berkeley, Davis, Irvine, and UCLA, as well as related work funded by the UC ITS Statewide Transportation Research Program through the California Road Repair and Accountability Act of 2017.
About UC ITS. The University of California Institute of Transportation Studies (UC ITS) is a community of scholars, staff, and students dedicated to advancing the state of the art in transportation engineering, planning, and policy for the people of California and beyond. Established by the Legislature in 1947, UC ITS has branches at UC Berkeley, UC Davis, UC Irvine, and UCLA. Representing over 225 faculty and academic researchers spanning more than 30 disciplines, UC ITS delivers interdisciplinary expertise across a wide range of transportation topics. ucits.org
About RIMI. The California Resilient and Innovative Mobility Initiative (RIMI) serves as a living laboratory –bringing together university experts from across the four UC ITS campuses, policymakers, public agencies, industry stakeholders, and community leaders – to inform the state transportation system’s immediate COVID-19 response and recovery needs, while establishing a long-term vision and pathway for directing innovative mobility to develop sustainable and resilient transportation in California. RIMI is organized around three core research pillars: Carbon Neutral Transportation, Emerging Transportation Technology, and Public Transit and Shared Mobility. Equity and high-road jobs serve as cross-cutting themes that are integrated across the three pillars. ucits.org/resilient-and-innovative-mobility-initiative
We are grateful to the UC ITS leadership, faculty, researchers, staff, and students whose collective expertise across the Berkeley, Davis, Irvine, and UCLA campuses made this publication possible. Their collaborative efforts across regions and disciplines are instrumental to advancing sustainable, resilient, and equitable transportation strategies for California.
Randy Chinn
Greer Cowan
Sonia Haug
Roland Hwang

Timothy Lipman
Laura Podolosky
Jacob Wasserman
Brooke Wolfe
Susan Shaheen, Editor-in-Chief
Laura Melendy, Managing Editor
Alan Toth, Writer
Michael Fortunato, Graphic Design & Photography
Samuel Chiu, Content Editor
Amanda Cairo and Kendra K. Levine, Contributers
Access and share the digital version: https://doi.org/10.7922/G2B56H3Z
Funding for this publication was provided by the State of California. The views expressed within this publication are those of the authors and do not necessarily reflect the views of the University of California or the State of California.
© 2026 UC Regents