Development of a human reactive astrocyte platform for drug discovery
Introduction
Astrocytes are one of the key glial types of the central nervous system (CNS) and play a critical role in maintaining brain homeostasis Following CNS injury or in disease, astrocytes undergo a transformation to become ‘reactive’ and change their morphology and molecular profile, adopting different phenotypic states to respond to pathological insults Reactive astrocytes participate in neuroinflammatory processes occurring in neurodegenerative diseases through secretion of neuro- and immune-modulatory factors Recently, an in vitro reactive astrocyte model was developed using a stimulation cocktail of TNF-α, IL-1α, and Complement 1q (‘TIC’), which drives a neurotoxic state ¹ TIC-induced astrocytes have been shown to secrete growth factors, chemokines and pro-inflammatory cytokines, as well as neurotoxic lipids ²
Use of high content imaging and functional analysis to study astrocyte activation and observe responses to anti-inflammatory drugs
LC-MS and scRNA-seq identify changes in the lipidome, metabolome and transcriptome of reactive astrocytes
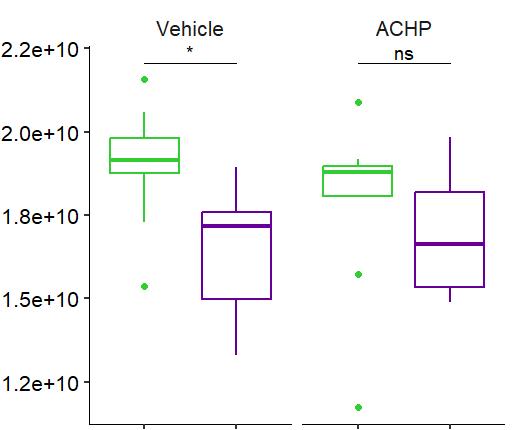
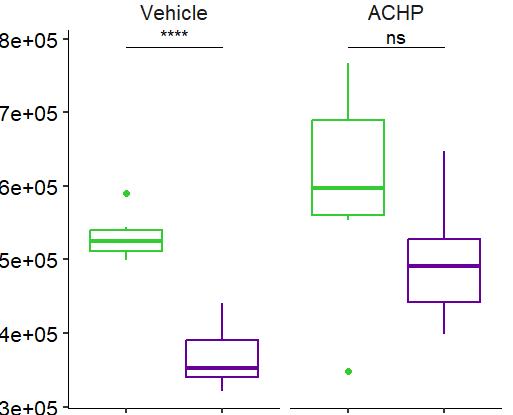
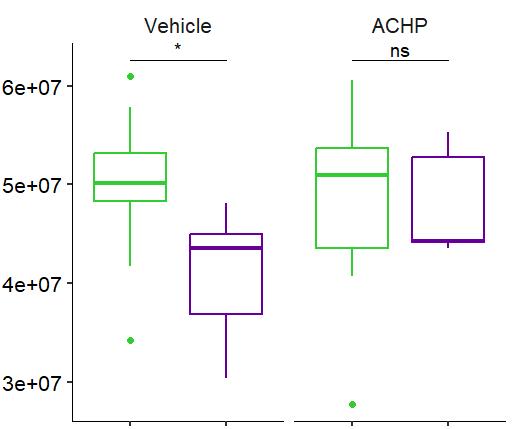
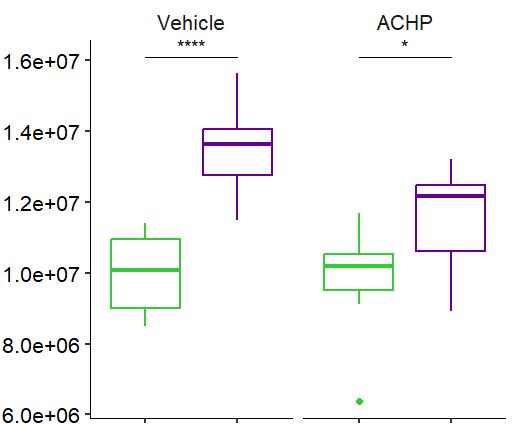
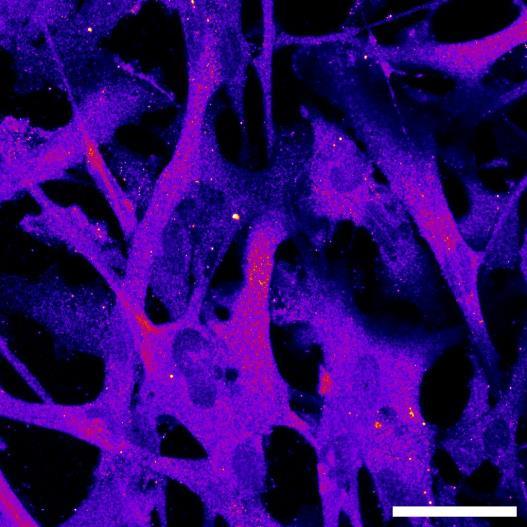
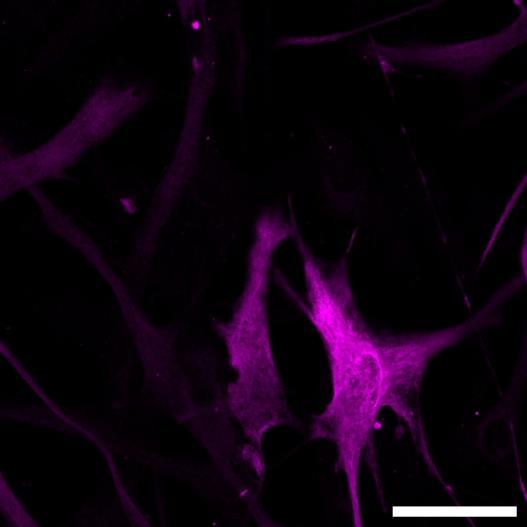
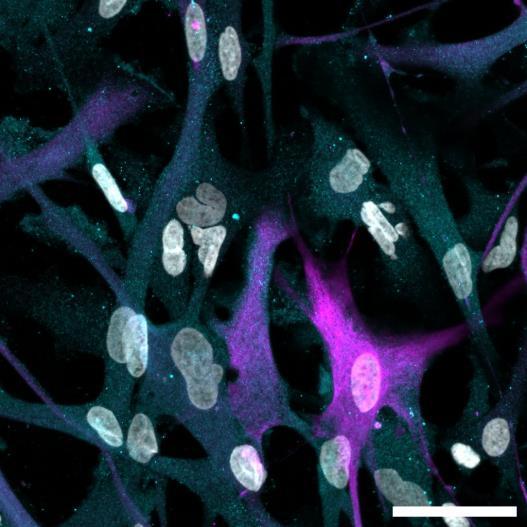


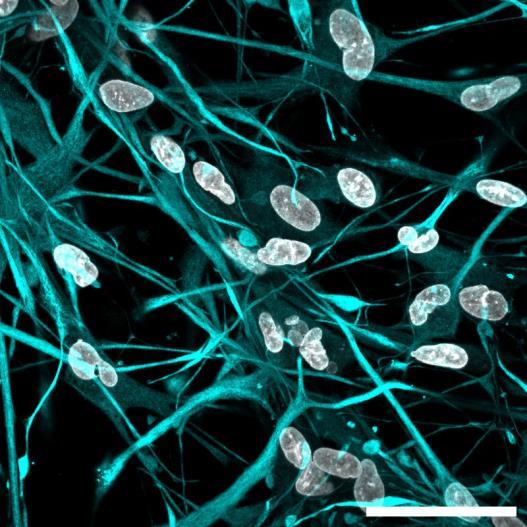
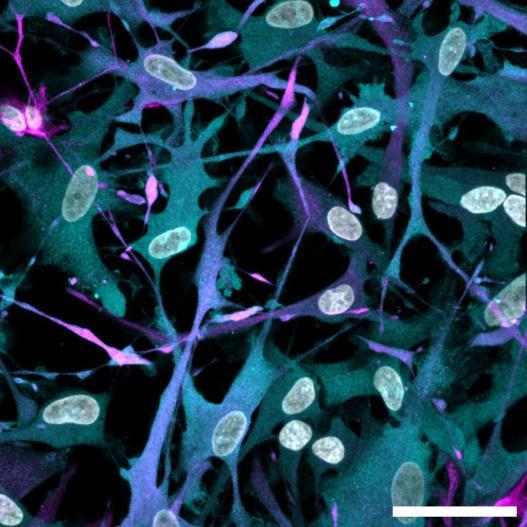
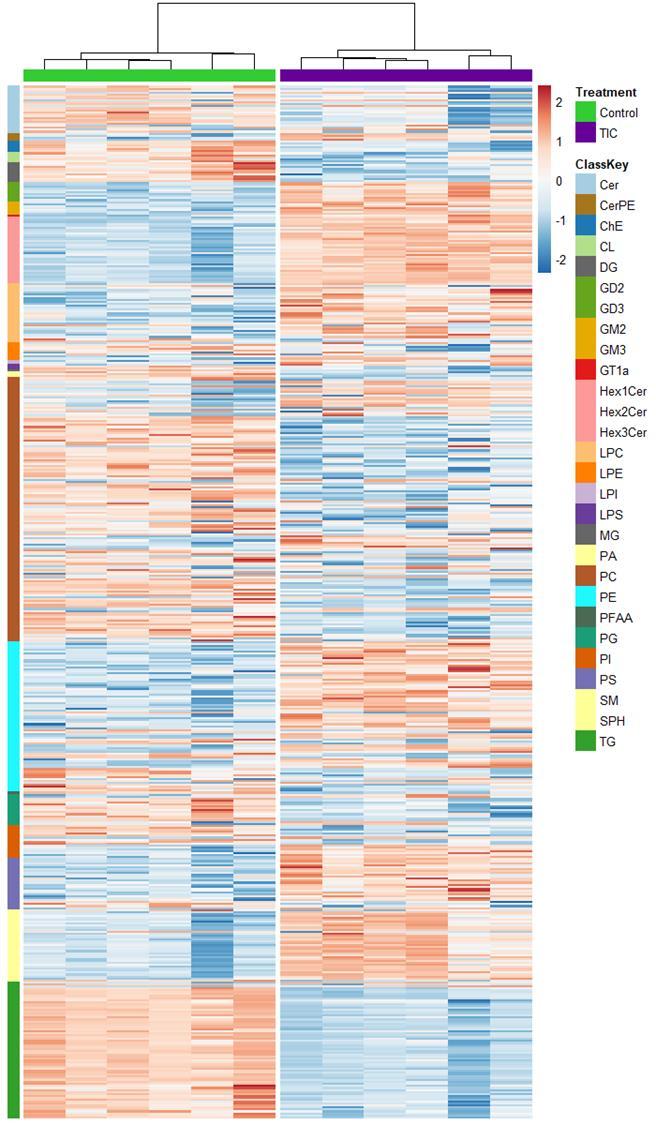
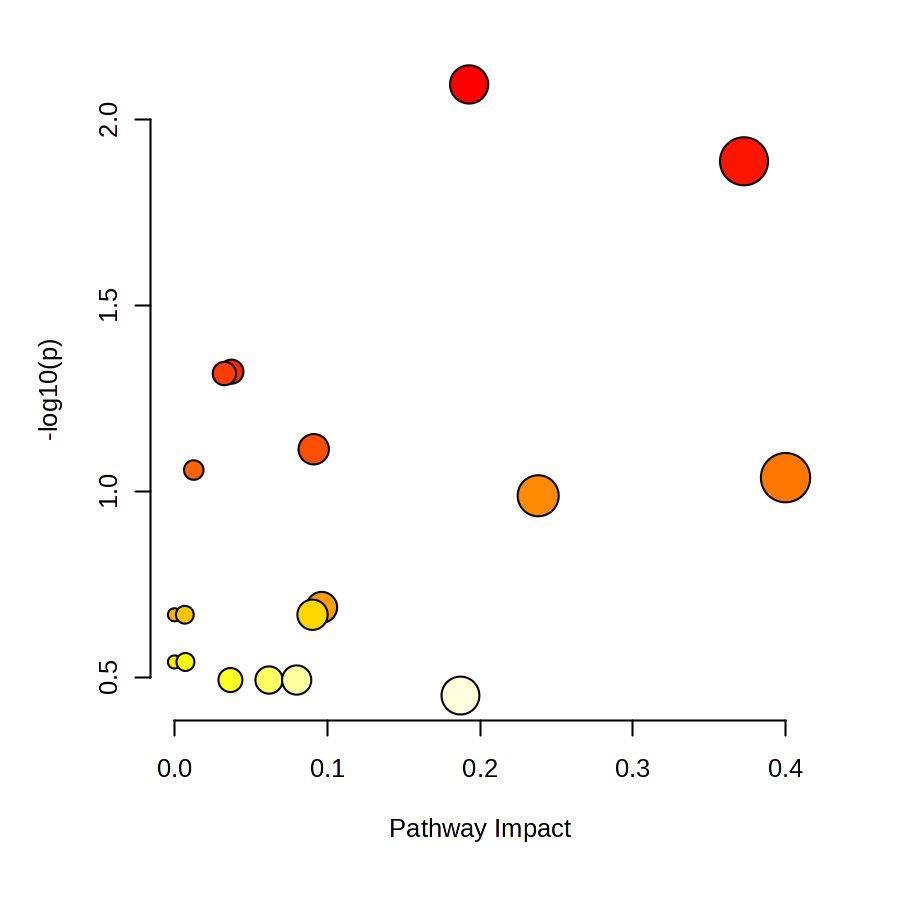
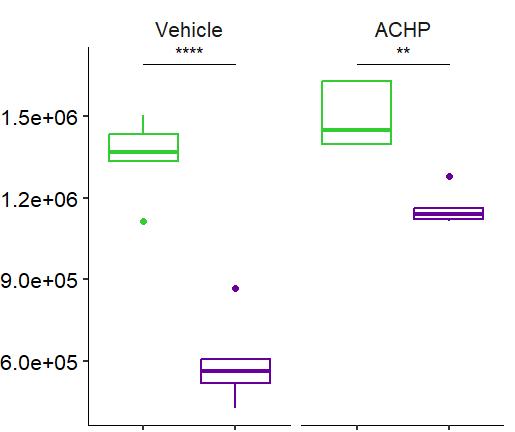
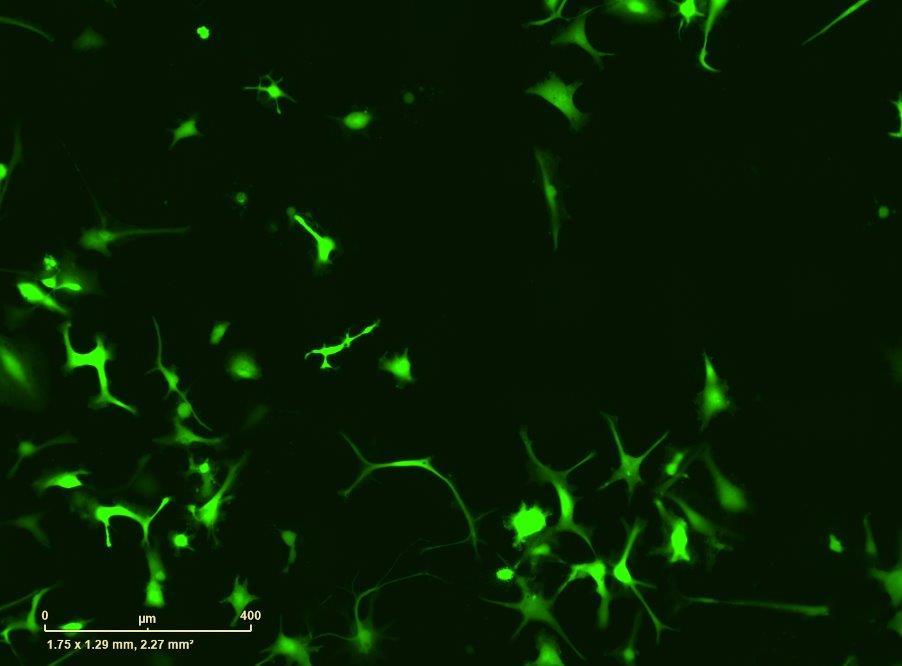
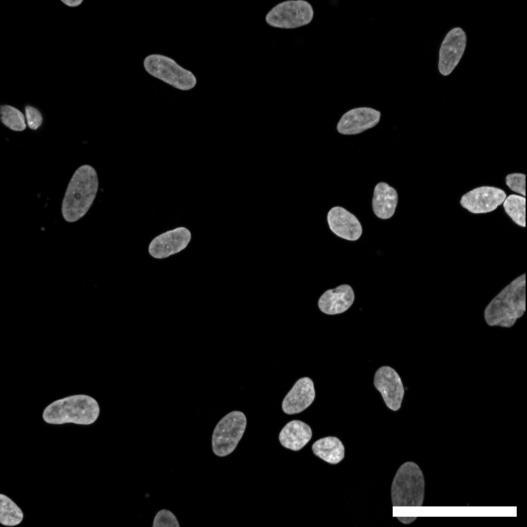
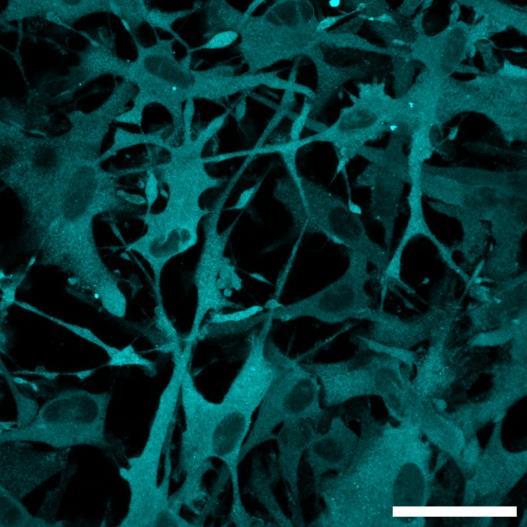
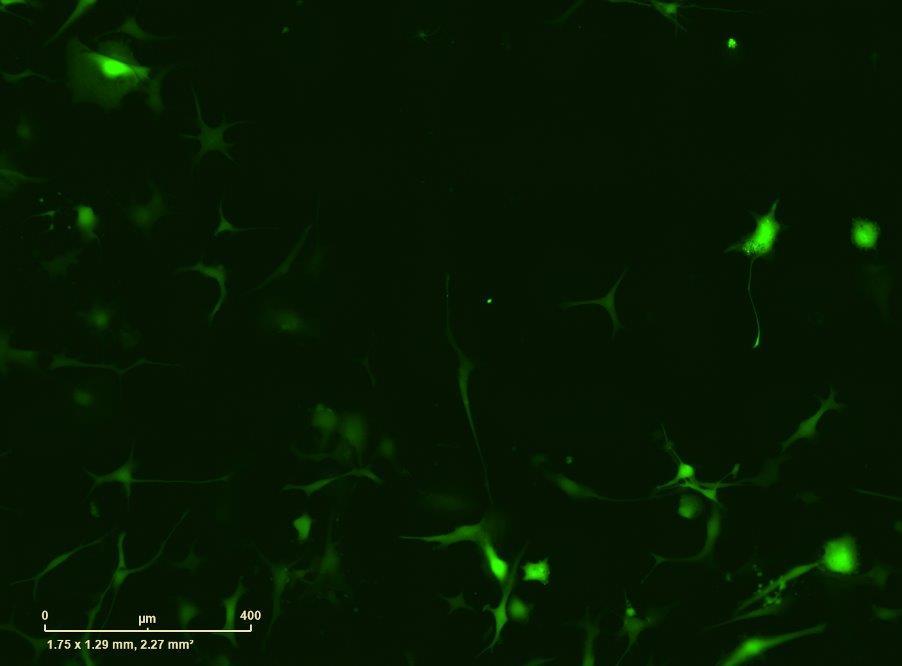
Fig 2 ACHP and Dexamethasone decrease TIC induced upregulation of GBP2 intensity and pro-inflammatory cytokines and growth factor release in hiPSC-derived astrocytes A) Representative images of hiPSC-derived astrocytes treated with Control or TIC and stained for the nucleus (DAPI, grey), Guanylate-binding protein 2 (GBP2, cyan or FIRE) and the astrocytic marker glial fibrillary acidic protein (GFAP, magenta) Z-stacks were acquired with a Zeiss LSM 880 confocal laser scanning microscope B) Quantification of the median GBP2 intensities in control and TIC stimulated cells Confocal images were acquired with an Opera Phenix High Content Screening System (PerkinElmer) and image analysis was done using Harmony 5 2 software Data presented as mean ± SEM for n = 3 biological replicates P-values generated by a two-way ANOVA with Dunnett post-test for multiple comparisons to Control+TIC P ≤ 0 05 (*), P ≤ 0 01 (**), P ≤ 0 001 (***), P ≤ 0 0001 (****) C) Representative confocal laser scanning microscope image of hiPSC-derived astrocytes indicate a change in morphology for GFAP (cyan) under TIC conditions D) Quantification of CXCL10, IL-6, YKL-40, CCL2, CCL5, GM-CSF and VCAM-1 secretion performed on astrocyte conditioned media using LUMINEX or ELISA N=3 P-values were generated by a One-way ANOVA with Dunnett post-test for multiple comparisons to Control+TIC Exception: P-value for YKL-40 (Control vs Control+TIC ) was calculated by unpaired t-test (mean±SEM) Abbreviation: Dexamethasone (Dex) E) Use of the NFkB reporter in astrocyte reactivity model Images were acquired and analysed using and Incucyte SX3 N=1; P-values were calculated by unpaired t-test (mean±SEM)
Results and conclusion
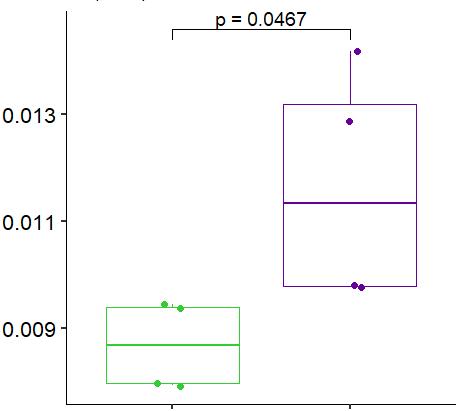

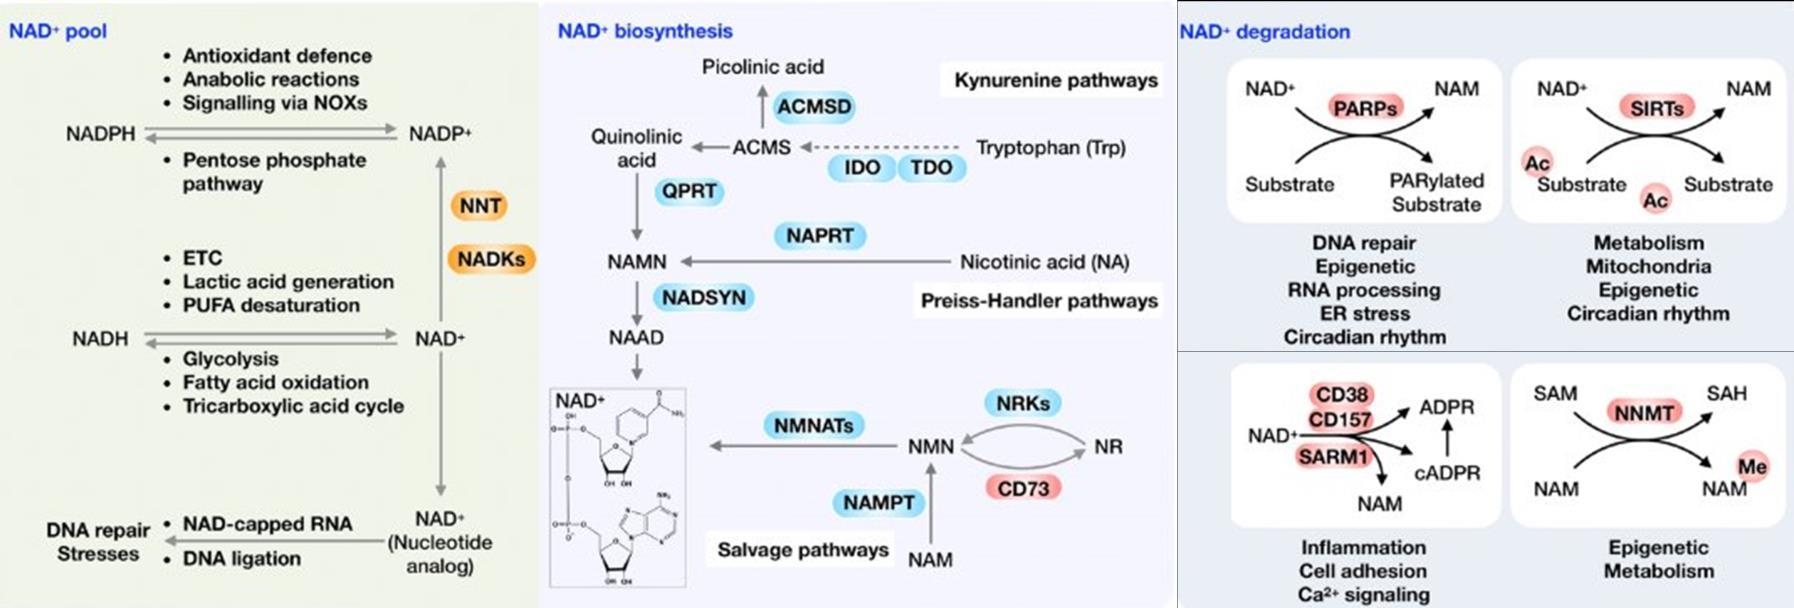
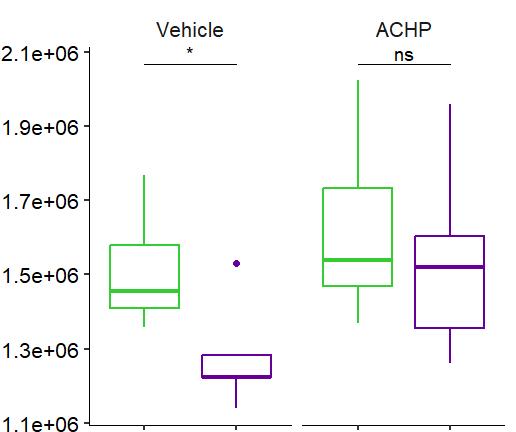
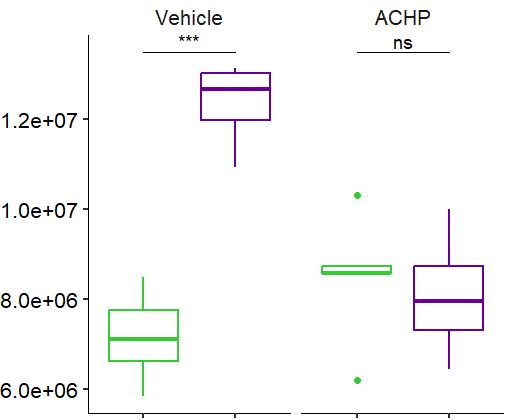
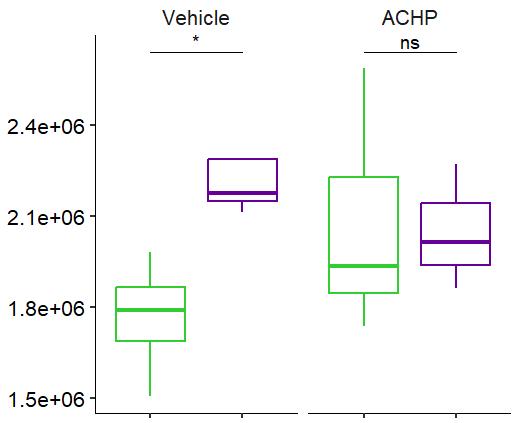
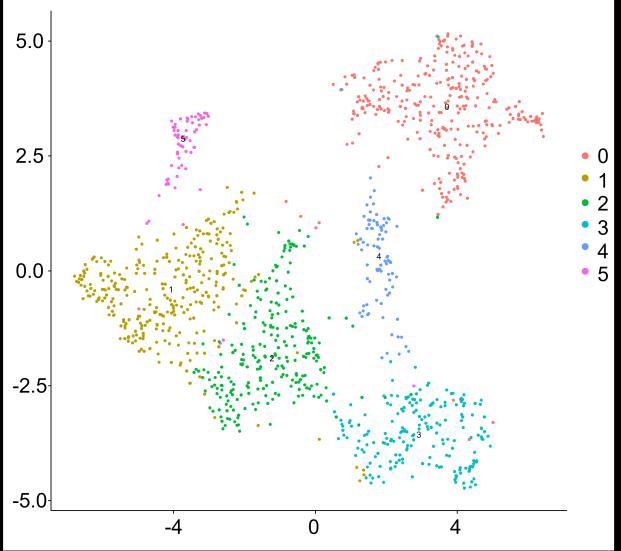
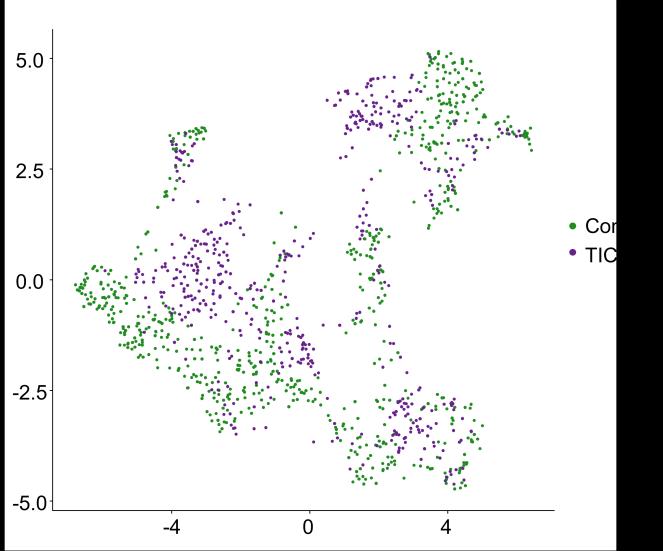
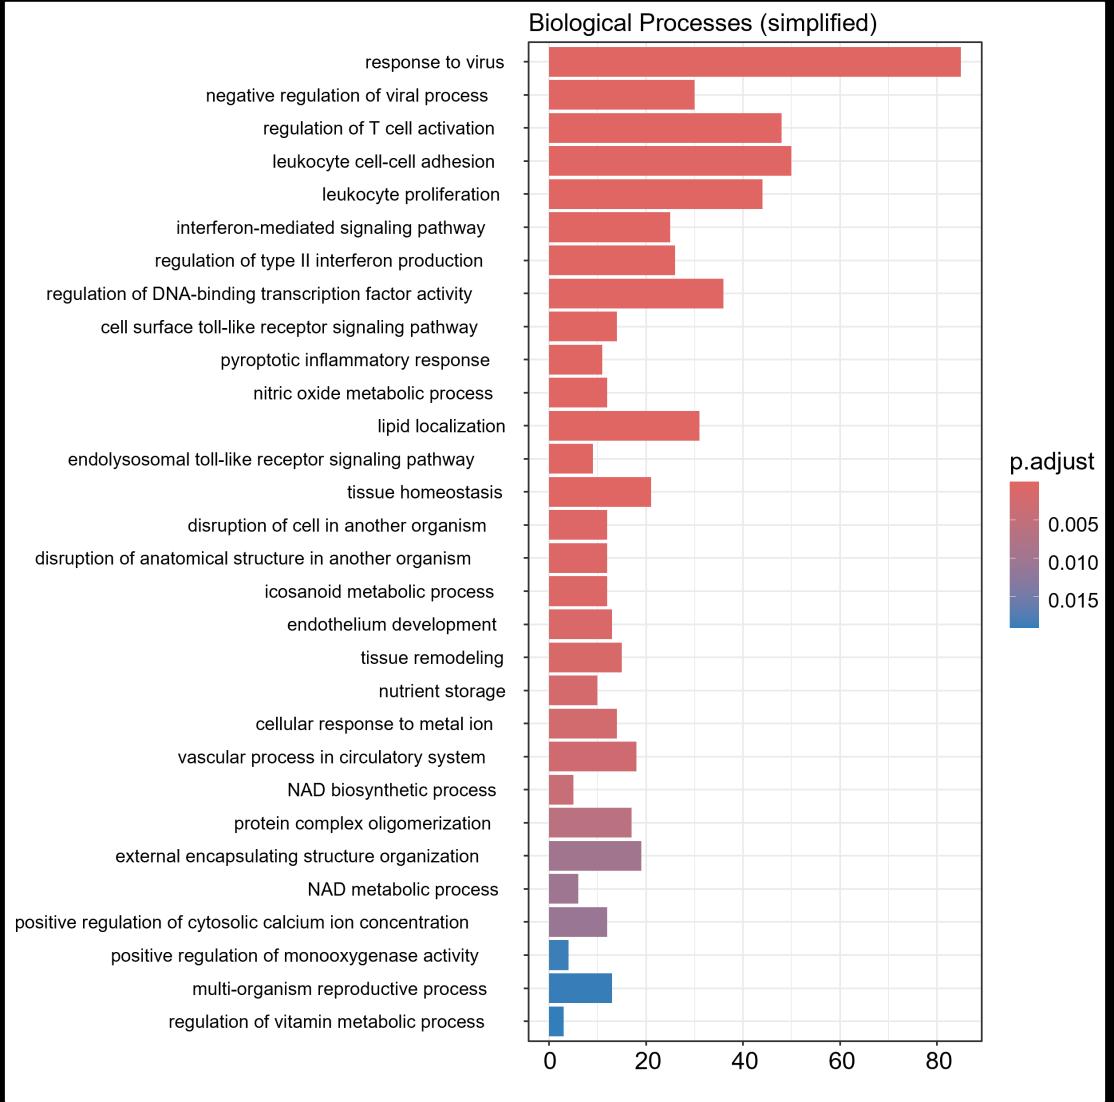
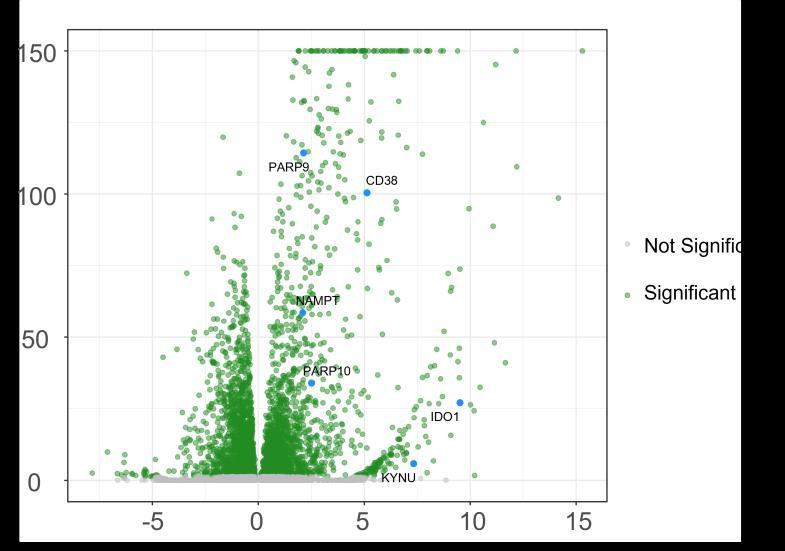
Fig 3 Multi-omics analysis revealed perturbation to lipid and NAD+ metabolism in TIC stimulated hiPSC-derived astrocytes A) Heatmap shows data of 528 significantly perturbed (q<0 05 TIC vs Control) confidently annotated lipids measured in either positive or negative ionisation mode Redundancy was removed by selection of a single representative feature per lipid group (sum fatty acyl chains) B) Boxplots of representative PC, LPC, CL and Hex1Cer species N=9 samples from three independent experiments ; P-values were calculated by t-test C) Long-chain fatty acids (FAs), palmitic (left) and stearic acid (right), are upregulated in the spent media of TIC stimulated astrocytes N=4 samples from three independent experiments ; P-values were calculated by t-test D) MetaboAnalyst pathway enrichment analysis against KEGG database of metabolic pathways for annotated compounds with p <0 05 Control vs Control+TIC E) Overview of the NAD+ metabolism; Modified from ³ F) Boxplots of representative metabolites of the NAD+, purine and hypotaurine metabolism N=3 samples from one experiment G) UMAP plots of single-cell RNA-seq data from Control and TIC stimulated astrocytes, shown by cluster (top) and by treatment type (bottom) N=1 H) Bar graphs represents significantly (adjusted p-value <0 05) enriched biological processes (GO terms), with darker red indicating greater significance N=1 I) Volcano plot depicting differentially expressed genes in Control vs TIC treated cells Blue dots represent genes related to the NAD+ pathway which are upregulated in TIC treated astrocytes N=1 (each
Here, we show characterisation of a human iPSC-derived model of reactive astrogliosis for drug discovery research We demonstrate that TIC stimulation induces an increase in pro-inflammatory cytokines, chemokines and growth factors and changes in morphological features including GBP2 expression In addition, using mass spectrometry and single-cell RNA sequencing we show that the lipidome and NAD+ metabolome is perturbed in TIC-stimulated astrocytes Together these innovative tools provide a platform to study reactive astrocytes, and their contribution to neuroinflammation, and to assist with development of novel therapeutics to target astrogliosis in disease