Mountain MountainDemocrat Democrat
2010 2025
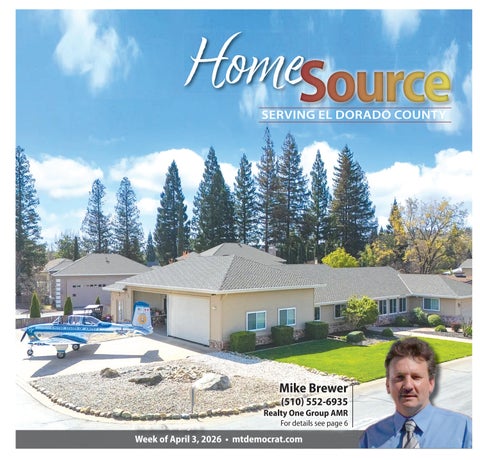
HomeSource
DON’T SETTLE FOR AVERAGE. RELENTLESS MOVES.
PRICE REDUCED
SERVING EL DORADO COUNTY
$585,000
MLS# 226022860
$109,000
ESKATON VILLAGE, SOUGHT AFTER 55+ COMMUNITY
Gorgeous 2017 contemporary style home. This 1492 sq. ft home has Two spacious bedrooms plus a den/office. Special features: engineered wood plank flooring and tile throughout. Kitchen features: Island, newer granite counter tops, freshly painted cabinets, pull out drawers, stove/range, blt-in microwave, plus a newer refrigerator. Large Master suite. The master bathroom has double sinks, walk in closet, large roll in shower, double shower heads. Spacious guest bedroom. Den/office. Guest bathroom with tub over shower. Lots of natural lighting throughout. On demand gas water heater. Central HVAC.2 car garage with cabinets. Enjoy and relax under the Patio area, retractable awning for extra sitting and shade, artificial grass. This Special community offers an indoor heated salt water pool, spa, club house, rec room, park/gazebo, walking paths, 24 Hour security and many other features. Relax, enjoy and have fun.
VICKI EMERY (530) 409-3707
DRE# 01187431
BEAUTIFUL WELL KEPT SENIOR PARK
$735,000
MLS# 226003379
JULIE CLARK (530) 306-7661
$68,000
DRE#02156476
sprawling Spanish style home has a covered front porch with arches and huge garage that is deep, has high walls for storage, plus a workshop area. The spacious Primary Bedroom has a retreat area with fireplace and a private, brand new, ground up, Balcony/Composite Deck. The Primary bath has double sinks, large closet with new doors and new Kohler, soft close medicine chests. The Second bedroom is oversized and had previously been divided into two bedrooms and the Third Bedroom is generous size. The Hall Bath also has double sinks and two new Kohler medicine chests. This Spacious yet homey Floor Plan features large kitchen with walk in pantry, garden window, loads of cabinets and counter space, and a serve bar open to large nook or office space and family room with large and very functional wood stove. Plan also includes formal dining room or another possible office space and huge game room that once had a full-size pool table with room to spare! Home has had $150,000 recently invested. Upgrades include brand new driveway with turnaround/parking area, paint inside and out, including all cabinets, G.E. downdraft cooktop, wine fridge, new lights inside and out, as well as additional LED lighting and new flooring. Home also has new Kohler toilets, new closet doors, Blomberg dual pane windows and 8 foot sliders and well as separate H.V.A.C. systems for lower and upper floors. Lower Heat Pump was replaced 3 years ago and upper has just been replaced!. Woodstove was just cleaned, inspected and minor maintenance/repairs completed. Roof and Pest Certs will be provided.
Stuart Warner (530) 676-2000
DRE# 01230792
$699,999
MLS# 226034668
DRE#02080116
DRE#01308662
Mike Brewer
MLS#225134644 HILLTOP RETREAT AT THE END OF A BEAUTIFUL COUNTRY ROAD
Life moves a little slower here on Sagittarius Rd as nature lovers will enjoy the peaceful sight and sound of the Cosumnes River below and the gentle breeze blowing while you take in your very own 21acre hillside view from your expansive patio and deck. This lovely home features a rustic Mediterranean vibe with gorgeous views & natural light throughout to keep your mood elevated all year long. Thoughtfully designed to bring the outside in, the stained concrete floors and beautiful hardwood cabinets accentuate the natural elements just on the other side of the floor to ceiling windows. With 3-4 bedrooms plus a loft, there is plenty of room to host your envious overnight guests and have ample room to work from home in your private office with its own outside entrance. Blaze your own walking trails, plant a vineyard or build your own terraced garden on your very own hill. The possibilities are endless and you can have it all within a 30-minute drive to all your shopping needs. This is a property you must see!
This is a perfect place to build your forever home or seasonal home. Situated in the town of Grizzly Flat, this land has been cleared and is ready for your final touches. Build your home, plant an orchard and garden, replant trees. The driveway is rough cut in and it has plenty of choices for building sites. Well has been drilled. Small shed on property to store your things while you build or visit. NO home owners association HOA. Enjoy the fresh Mountain Air and get away from the hustle and bustle and build the home you have been looking for. This acreage border BLM Land (Bureau of Land Management) offering more privacy. Local attractions and activities include: wineries, hiking, off roading, mountain biking, snow sports and much more, about an hour from Lake Tahoe and close to many lakes and rivers. Come see why we live, work, play and love El Dorado County and Grizzly Flats
CHERYL WEBB (530) 306-0684 • CLAUDIA WEBB (530) 344-3037
MLS# 226008292
ABOVE THE FOG AND BELOW THE SNOW! Above the Fog and below the snow! This prime 2.44 acre, wooded parcel with local views and large meadow, is located in the sought after Sleepy Hollow community, that has a private lake and trails. The
3.4 ACRES OF USABLE LAND IN THE SIERRA NEVADA FOOTHILLS
DRE#01149568
HELEN RIVARD (530) 409-2687 • ASHLEY CAMPBELL (530) 391-4058
REDUCED FIFTEEN THOUSAND — $735,000
Mature landscaping. Monthly newsletter with calendar of activities. Brand NEW Roof, Newer Vinyl Plank Flooring, Vinyl Blind. Large Kitchen with New Gas Range, island, Built in cabinets and Local Views. Nice Living Area with Den and/or Formal Dining Room. Large Fenced Back Yard for Outdoor Enjoyment and Gardening. Located on a Cozy Cul-De-Sac. Park Features, Club House, Indoor Pool, and More. What a Fantastic Place to Call Home!! DRE#01246556
MLS#225151448
2-bedroom, 2-bath home in a desirable 55+ community • New roof – move-in ready • Close to shopping, dining, movie theater, and public transportation
DRE#00978062
PRICE IMPROVEMENT
$139 ,500
PRICE IMPROVEMENT
SALLY LONG JOHNS (530) 306-0821
Placerville – 530.295.2900 • www.century21.com
©2026 CENTURY 21 Select Real Estate, Inc. All rights reserved. CENTURY 21® and the CENTURY 21 Logo are registered trademarks owned by Century 21 Real Estate LLC. Each Office is Independently Owned and Operated.
(510) 552-6935
Realty One Group AMR For details see page 8
For details see page 6
Week of April 3, 2026 • mtdemocrat.com