Mountain MountainDemocrat Democrat
2010 2025
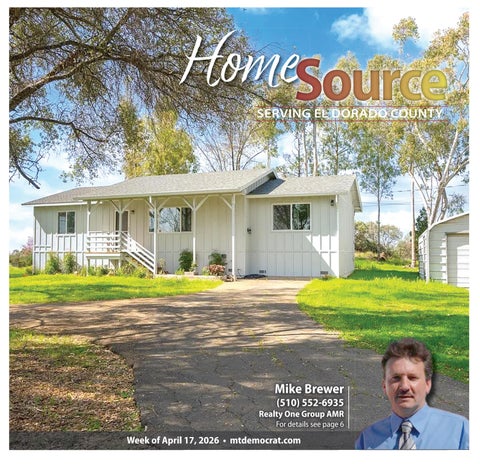
HomeSource
DON’T SETTLE FOR AVERAGE. RELENTLESS MOVES.
SERVING EL DORADO COUNTY
$769,500
Just Sold OVER ASKING
$839,000
MLS#226011479
EXCEPTIONALLY RARE, LEVEL TO ROLLING VIEW PARCEL!
Welcome to 5901 & 5903 Cerrito Road in Diamond Springs—an oak-studded 5-acre property with canyon views. This 3 bed, 2.5 bath home features an open layout, updated kitchen, and private deck. Includes owned solar, pool, RV hookups, and a separate ADU—perfect for guests or extended family. Just 12 minutes to Hwy 50.
Flowing, open concept home has 3 bedrooms, plus a den/office and has already been remodeled and tastefully updated. Two acre parcel has a dark bottom, in-ground pool, a 20’x 45’ R.V. Building or Shop with 14’ high door, plus a She Shed/Storage Shed. Circular driveway with beautiful redwoods and rock outcroppings in the center, a garden area & a pasture. Mesmerizing, panoramic views South to Mount Diablo and beyond - this one has it all! If you’re looking for and appreciate a quality home a roperty, with obvious pride of ownership, look no further! The kitchen, that’s open to the living room with cathedral ceiling and wall of windows, has undergone a complete remodel, with attention to detail and no expense spared. Kitchen features Quartz slab counters, a large island with serve bar and six burner Wolf Stove, Farm Sink, self closing drawers, task lighting and a pantry closet. Much of the home has been updated with striking, light color and high quality, engineered French Oak flooring, carpeted areas upgraded too! This quality built home has cement board siding, wood sash and steel clad Anderson windows and sliding doors and was even originally designed to have an additional living space added in the steep pitch roof, attic space above. The quality is just one thing that sets this home apart from the rest. This is truly the Perfect Package!
STUART WARNER (530) 676-2000
DRE# 01230792
MLS# 226030661
OAK STUDDED, PARK LIKE FIVE ACRES WITH CANYON VIEWS
DAVID BOLSTER (530) 409-2676
DRE# 01356944
PRICE REDUCED
$575,000
COUNTRY LIVING AT ITS FINEST!
$585,000
MLS# 226035053
Gorgeous 2017 contemporary style home. This 1492 sq. ft home has Two spacious bedrooms plus a den/office. Special features: engineered wood plank flooring and tile throughout. Kitchen features: Island, newer granite counter tops, freshly painted cabinets, pull out drawers, stove/range, blt-in microwave, plus a newer refrigerator. Large Master suite. The master bathroom has double sinks, walk in closet, large roll in shower, double shower heads. Spacious guest bedroom. Den/office. Guest bathroom with tub over shower. Lots of natural lighting throughout. On demand gas water heater. Central HVAC.2 car garage with cabinets. Enjoy and relax under the Patio area, retractable awning for extra sitting and shade, artificial grass. This Special community offers an indoor heated salt water pool, spa, club house, rec room, park/gazebo, walking paths, 24 Hour security and many other features. Relax, enjoy and have fun.
Come experience the unmatched potential at this beautiful home nestled in the outskirts of Placerville! The major updates have already been done, just put your own finishing touches. The spacious great room is ideal for entertaining and complete with newer waterproof laminate flooring that extends through the house. The tastefully updated kitchen has all new appliances and tile flooring. Down the hall you will find 3 spacious bedrooms plus office. The two full baths offer plenty of storage space and a blank slate to make them your dream space! The primary bedroom has outdoor access to enjoy the beautiful and peaceful 1.5 acre lot. Roof was replaced approximately 2 years ago. Fridge, dishwasher, stove, washer/dryer installed in 2023. Enjoy peace & quiet of country living, only minutes from shopping, dining, & recreation. Sly Park/ Jenkinson Lake is only a short 15 min. away for boating, fishing, etc. and a quick 15 min. drive to Main Streets fabulous shops & restaurants!
DRE#01149568
CHERYL WEBB (530) 306-0684 • CLAUDIA WEBB (530) 344-3037
MLS# 226022860
ESKATON VILLAGE, SOUGHT AFTER 55+ COMMUNITY
DRE#02080116
VICKI EMERY (530) 409-3707
DRE# 01187431
OPEN HOUSE
Sat. 4/18 • 12-2pm 1028 Oak Crest Ct, Placerville
$349,500
$750,000 MLS# 226045808 OAK KNOLL ESTATES STYLISH SPANISH STYLED INSPIRED HOME
This sweet single-story home located on a sunny parcel with delight you! Light and bright home has vaulted ceilings, stainless appliances, laminate flooring, an attached two- car garage, and a fenced yard for kids and pets! Growing in popularity, the area has paved roads, public water, fire hydrants, high-speed internet, trash service, and NO HOA FEES! There is a lot of room for kids to play and the neighborhood is great for bicycling, exercising, or walking the dog. Enjoy the “vacation feel” of living in South County, with endless opportunities for outdoor adventures including hunting, fishing, hiking and more!
low maintenance mature landscaping and a unique front patio makes this 4 bedroom, 2,900+/- sf home a rare find. Designed with a focus on universal accessibility for easy multi-generational living the entry level of this beautifully updated home features 2 living rooms, private patios & spacious deck for entertaining, a sparkling kitchen with newer stainless appliances solid surface stone counter tops & direct access to the sizeable 3 car garage, accessibility friendly junior suite featuring a office, wheelchair accessible zero step roll in shower and private patio. Up the staircase are 3 more bedrooms including a second primary suite, two full bathrooms and an attic bonus room/office/storage. Updates since 2017 include energy efficient windows, retextured stucco for a more modern appeal, roof, flooring, decking, patios, driveway, fencing, mini-splits for primary suites, multiple electrical & plumbing updates and much more.
DRE#01308662
SALLY LONG JOHNS (530) 306-0821 • SARAH HENJUM (530) 919-1481
MLS# 226009184
THE LAST AFFORDABLE AREA IN EL DORADO COUNTY!
DRE#01995123
DRE#225129895
JANINE WAGGENER (530) 295-5509
Placerville – 530.295.2900 • www.century21.com
©2026 CENTURY 21 Select Real Estate, Inc. All rights reserved. CENTURY 21® and the CENTURY 21 Logo are registered trademarks owned by Century 21 Real Estate LLC. Each Offi ce is Independently Owned and Operated.
Mike Brewer
(510) 552-6935
Realty One Group AMR For details see page 6
Week of April 17, 2026 • mtdemocrat.com