We are pleased to share the 2026/27 Annual Budget with the community. Council manages funds to support the delivery of a number of services to nearly 94,650 residents. This Budget meets the challenges of maintaining ageing infrastructure while also investing in new infrastructure to meet the needs of our growing population.
Throughout this Budget Companion, and the Budget itself, we have broken down how we intend to utilise this year’s $245.28 million budget to support our community for the coming year.
Council’s Budget invests in our vision for an inclusive, flourishing, progressive city that cares for both its residents and its environment, as outlined in our Council Plan.
Major initiatives – expanded on the next page – have been identified as priorities because they generate significant benefit to the community, directly contribute to the achievement of the Council Plan, and receive a major focus in the budget. This includes improving customer service for our community, continuing work on the Footscray Structure Plan, completing year two of the RecWest Footscray and Shorten Reserve redevelopment, and looking at ways to improve transport connectivity, accessibility and sustainability.
The proposed budget includes $91.45 million towards Capital Works – infrastructure like roads, parks, buildings, footpaths, and amenities – that the community use each day.
Capital Works have been budgeted equitably across each Ward – Bluestone, Braybrook, Burndap, River, Saltwater, Sheoak and Wattle – to ensure we prioritise our community’s needs against financial constraints.
The Capital Works budget considers prior community commitments – Maribyrnong Aquatic Centre Waster Slide and Splash Park design and installation, RecWest Footscray and Shorten Reserve development, and Creative West.
Revitalising the Footscray CBD is a continued focus for Council, with just under $6 million proposed for the creation and upgrade of open spaces including Raleigh Street Park, infrastructure works including public lighting, greening, and shop front activations, road and footpath renewals, and Little Africa Activation works.
We understand how important it is to our community that our City is easy to get around, which is why this year we have allocated $2.882 million to Active Transport projects, including $1.002 million for the design and construction of bike and pedestrian path infrastructure to support safety, accessibility and connectivity, as well as $1 million on footpath renewal.
Also included in this document is Council’s operating costs for staffing and – new in this year’s document – highlights across our organisation and municipality of how the Budget positively impacts our community.
Thank you to everyone who participated in the engagement process as part of the development of this year’s Budget. Your insights have helped ensure our spending considers financial constraints, community needs and future needs of our municipality.
Cr Mohamed Semra Mayor
Celia Haddock Chief Executive Officer
Executive Summary
Council has prepared a Budget for 2026/27 which is aligned to the vision in the Council Plan. It seeks to maintain and improve services and infrastructure as well as deliver projects and services that are valued by our community and do this within the rate increase mandated by the State Government.
This Budget projects an adjusted underlying surplus of $11.5 million for 2026/27.
Key Things We Are Funding
- ongoing delivery of services to the Maribyrnong City Council community funded by a budget of $154 million. These services are summarised in Section 2.
- continued investment in infrastructure assets ($27.6 million including carry forward projects) primarily for upgrade works. This includes roads ($12 6 million); footpaths and bicycle paths ($2.9 million); parks, open space and streetscapes ($8 2 million); and Recreational and leisure and community facility ($2.4 million). The Statement of capital works can be found in Section 3.5 and further details on the capital works budget can be found in Sections 4.4.
The Rate Increase
- The rate cap passed through of 2.75% is in line with allowable rates cap set by the Minister for Local Government on 23 December 2025 under the Fair Go Rates System. The rate cap applies to the Council's total rate revenue only - not individual properties. Individual rates bills may increase or decrease by more (or less) than the capped rise amount due to their valuation movements.
- Key drivers are
o to fund ongoing service delivery – business as usual (balanced with greater service demands from residents)
o to fund renewal of infrastructure and community assets
Refer to Section 4.1.1 for further Rates and charges details.
Key Statistics
Total revenue: $196.3 million (2025/26F = $193.6 million)
Total expenditure: $170 8 million (2025/26F = $167 6 million)
Accounting result: $25.5 million surplus (2025/26F = $26.0 million)
(Refer Comprehensive Income Statement in Section 3.1)
The Accounting surplus result of $25 5 million is not a cash surplus.
The adjusted underlying operating result is showing a surplus for the year as per the Australian Accounting Standard – Accounting Result. Adjusted for non-recurrent grants used to fund capital expenditure, non-monetary asset contributions, and contributions to fund capital expenditure other than grants and non-monetary asset contributions. It is an indicator of the sustainable operating result required to enable Council to continue to provide core services and meet its objectives.
Adjusted Underlying Operating Result
Surplus of $11 5 million (2025/26F = Surplus of $10 4 million)
(Note: Underlying operating result is an important measure of financial sustainability as it excludes income, which is to be used for capital, from being allocated to cover operating expenses). A positive result indicates a surplus.
Underlying revenue does not consider non-cash developer contributions and other one-off (non-recurring) adjustments.
Capital and Asset Improvement Works Expenditure
(Refer Summary of Capital and Improvement Works in Section 4.4)
This is the net funding result after considering the funding requirements for capital work projects from reserve transfers.
Total capital and Improvement works program of $91.452 million.
- $31.182 million from Council operations (2026/27 rates funded)
- $0.400 million from asset sales
- $12.472 million from external grants
- $1.145 million from contribution
- $7.146 million from open space reserves
- $24 107 million from major projects reserves and other reserves
- $15.000 million from Loans and Borrowings
Budget Reports
The following reports include all statutory disclosures of information and are supported by the analysis contained in sections 6 of this document
This section includes the following reports and statements in accordance with the Local Government Act 2020 and the Local Government Model Financial Report.
1. Link to the Integrated Planning and Reporting Framework
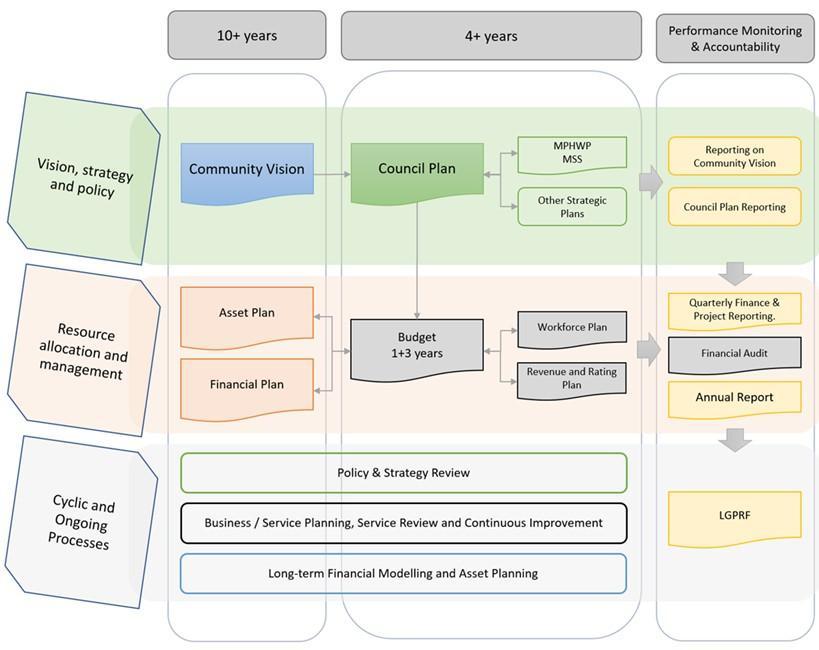
This section describes how the Budget is linked to the achievement of the Community Vision and Council Plan within an overall integrated planning and reporting framework. This framework guides the Council in identifying community needs and aspirations over the long term (Community Vision and Financial Plan), medium term (Council Plan, Workforce Plan, and Revenue and Rating Plan) and short term (Budget) and then holding itself accountable (Annual Report)
1.1 Legislative planning and accountability framework
The Budget is a rolling four-year plan that outlines the financial and non-financial resources that Council requires to achieve the strategic objectives described in the Council Plan. The diagram below depicts the integrated strategic planning and reporting framework that applies to local government in Victoria. At each stage of the integrated strategic planning and reporting framework there are opportunities for community and stakeholder input. This is important to ensure transparency and accountability to both residents and ratepayers.
Source: Department of Government Services
The timing of each component of the integrated strategic planning and reporting framework is critical to the successful achievement of the planned outcomes.
1.1.2 Key planning considerations
Service Level Planning
Although Councils have a legal obligation to provide some services such as animal management, local roads, food safety and statutory planning most Council services are not legally mandated, including some services closely associated with Councils, such as libraries, building permits and sporting facilities. Further, over time, the needs and expectations of communities can change. Therefore, Councils need to have robust processes for service planning and review to ensure all services continue to provide value for money and are in line with community expectations. In doing so, Councils should engage with communities to determine how to prioritise resources and balance service provision against other responsibilities such as asset maintenance and capital works.
Community consultation needs to be in line with a Councils adopted Community Engagement Policy and Public Transparency Policy.
1.2 Our purpose
Our Community Vision
A sustainable, vibrant city where history is acknowledged, differences are respected and diverse communities are supported to connect and thrive.
Our Wellbeing Commitment
Maribyrnong City Council is committed to promoting and protecting the wellbeing of our community across all life stages. We will achieve this through working to create and improve the physical, social, natural, cultural and economic environments that promote health and wellbeing.
Under the Public Health and Wellbeing Act 2008, Council is required to prepare a Municipal Public Health and Wellbeing Plan every four years or include public health and wellbeing matters in the Council Plan.
The health and wellbeing priorities for 2025-29 are:
- A healthy and active community - A city that supports active living, access to nutritious food, and equitable healthcare services for all.
- A resilient and thriving community - A city that strengthens mental wellbeing, social connections, and access to support services for all.
- A sustainable and liveable city - A city that prioritises climate resilience, green spaces, and a clean, safe environment for all.
- An inclusive and connected community - A city that values diversity and culture, encourages participation, and supports a sense of belonging for all.
Our Values
Respect
Courage
Inclusiveness, empathy, communication and goodwill
Innovation, considered risk, creativity, problem solving, initiative, accountability and responsibility
Integrity Honesty, loyalty, ethical behaviour and trustworthiness
1.3 Strategy Objectives
Council provides 56 services to the community. Each contributes to the achievement of one of the five Strategic objectives as set out in the Council Plan. The following table lists the five Strategic objectives as described in the Council Plan.
Strategic objectives
Ethical Governance
Wellbeing and Safety
Environmental Sustainability
Thriving Community
Connected Community
Description
Council will govern ethically, with consultation, integrity and transparency.
Council will create actively engaged, socially connected, and healthy communities.
Council will create and shape healthy built and natural environments.
Council will drive innovation and future-focused change to shape a resilient and adaptable city.
Council will build a connected, vibrant city where neighbourhoods thrive.
2. Services, Initiatives and Performance Outcome Indicators
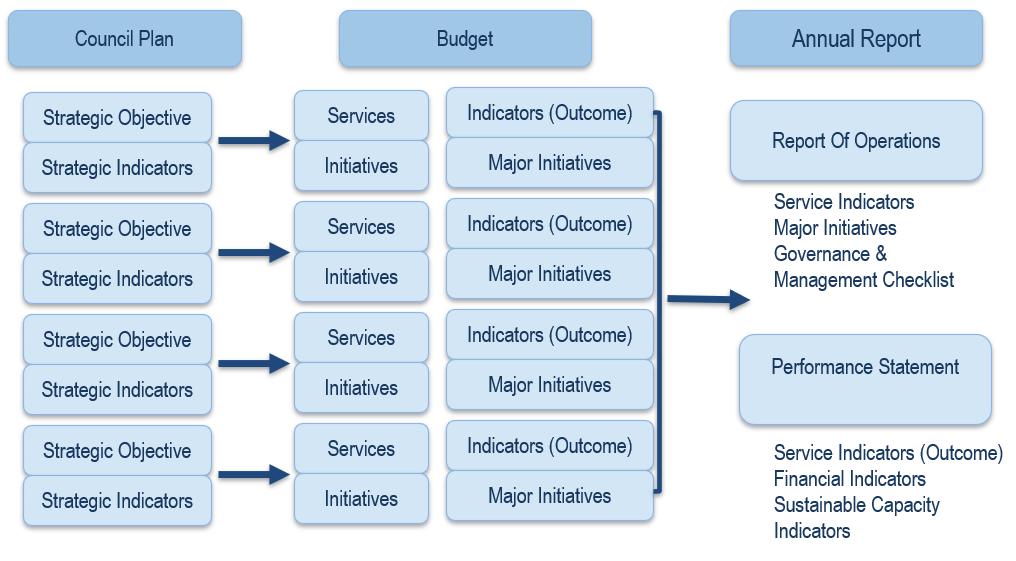
This section provides a description of the services and initiatives to be funded in the Budget for the 2026/27 year and how these will contribute to achieving the strategic objectives outlined in the Council Plan. It also describes several initiatives and service performance outcome indicators for key areas of Council’s operations. Council is required by legislation to identify major initiatives, initiatives and service performance outcome indicators in the Budget and report against them in their Annual Report to support transparency and accountability. The relationship between these accountability requirements in the Council Plan, the Budget and the Annual Report is shown below.
Source: Department of Government Services
Services for which there are prescribed performance indicators to be reported on in accordance with the Regulations are shown in the following sections.
Council will govern ethically, with consultation, integrity and transparency.
Service Area
Community Engagement Drives best practice community engagement across the organisation.
Strategic Procurement and Risk Management
Under a centre led model, guides the procurement of goods, services and works and implements policies and procedures that minimise Council’s business and operational risks
Information Management Ensures compliance with regulatory requirements for the management of Council’s information, through reliable central storage and managed access to corporate information, documents and records, archiving and destruction management and internal mail receipt and distribution.
IT Services Ensures that IT systems, including hardware and software assets, are maintained and have sufficient capacity to meet the organisation’s needs. Further responsibilities include IT strategic planning, desktop services and support, network infrastructure administration, fixed and mobile voice and data management and support, procurement of hardware, software and telephony, geographic (spatial) information systems management, business systems support, analysis, development and implementation, general IT support and training and IT project management and delivery.
Planning and Performance
Health, Safety and Wellbeing
Supports the organisation in fostering a proactive safety culture by providing strategic and operational guidance,
Human Resources
expert advice and resources to minimise risk and safety exposure.
Supports the organisation by providing leaders and employees with expert advice and guidance on all aspects of human resources and employee relations, including staff recruitment and performance management.
Organisational Development Supports the organisation by driving a positive organisational culture, measuring and enhancing staff engagement and developing workforce capability through targeted development programs and initiatives.
Customer Service and Civic Facilities Manages enquiries from the public, referring to Council’s services for response or resolution as appropriate.
Media and Communications Manages and coordinates communications, media and issues management across the organisation.
Financial Accounting Oversees the systems, processes and record keeping relating to cash flow and financial investments.
9,581,971 Payroll Provides payroll services to Council
Deliver the Putting Customers First Strategy to create a more positive and enhanced experience for the community by embedding customer-centric practices, improving accessibility, and simplifying service channels.
Domain Measure
Governance
Financial Forecasting
Financial Management
Financial Management
Financial Management
GOV-G2 Satisfaction with the opportunities offered by Council to be consulted on or engaged in Council decisions
FIF-O5 Asset renewal and upgrade compared to depreciation
FIM-E2 Expenses per property assessment
FIM-L1 Current assets compared to current liabilities
FIM-S1 Rates compared to adjusted underlying revenue
Governance
GOV-G3 Councillor attendance at Council meetings
Calculation
Community satisfaction rating out of 100 with how Council has performed on community consultation and engagement
Asset renewal and upgrade expenses / Asset Depreciation. This result is multiplied by 100
Total expenses / Number of property assessments
Current assets / Current liabilities. The result is multiplied by 100
Rate revenue / Adjusted underlying revenue. The result is multiplied by 100
The sum of the number of Councillors who attended each Council meeting / (Number of Council meetings) × (Number of Councillors elected at the last Council general election). This result is multiplied by 100
Governance
GOV-G10 Permanent staff turnover
Number of permanent staff resignations and terminations for the financial year / Average number of permanent staff for the financial year. The result is multiplied by 100
Strategic Objective 2: Wellbeing and Safety Council will create actively engaged, socially connected, and healthy communities.
Service Area Description of Services Provided
Civil Design and Drainage
Horticulture and Parks
Sport and Recreation
City Experience and Visitation
Parking and Local Laws
Oversees civil infrastructure planning and design, manages underground services and drainage approvals, and leads Council’s flood management.
Maintains and enhances all parks, reserves, and horticultural areas.
Undertake strategic planning, research, development of policy, management and development of facilities and delivery of programs.
Supports and delivers festivals, local tourism and key city activation projects.
Ensure compliance with regulations designed to maintain public amenity and safety.
Active Ageing Services
Early Years
Maternal and Child Health and Immunisation
Youth Services
Delivers services for eligible older people (over 65) under the Commonwealth Home Support Programme (CHSP) and the Home and Community Care Program for Younger People (HACCPYP) (under 65) to support their independence and connectedness.
Facilitates the delivery of services, projects and facilities for babies, preschool aged children and their families.
Provides clinical health and wellbeing assessments, support, referrals and parent education for families with preschool aged children.
Works within a community development approach to enhance and promote positive development, wellbeing outcomes and civic participation for young people 12-25 years
Access and Inclusion
Community Development
Develops and delivers Council’s strategies, action plans and programs with a focus on reducing barriers and promoting equity for specific populations, such as LGBTIQA+, people with disabilities, older people, and multicultural communities.
Supports and enables approaches to build social capital and strengthen community capacity and build connections across the community.
1,134,795 1,347,588 1,379,947
142,660
776,415 1,070,532 1,096,660
633,754 1,070,532 1,096,660
17,947 3,200
Service Area Description of Services Provided
Community Strengthening (Community Centres) Manages programs and activities in Council’s community centres.
Environmental Health Monitor and enforce public health and safety regulations to safeguard the community and reduce the risk of infectious disease transmission.
Maribyrnong Aquatic Centre Manages the Council owned Maribyrnong Aquatic Centre.
Social Policy and Research
Social Policy and Research conduct social research and policy development together with health and wellbeing development.
Service Performance Indicators
1,733,043
39,911 1,500
630,988 1,515,053 1,649,141
Domain Performance Measure Calculation
Community COM-AF6 Utilisation of aquatic facilities Number of visits to aquatic facilities / Population
Community
COM-MC2 Infant enrolments in MCH service
Number of infants enrolled in the MCH service (from birth notifications received) / Number of birth notifications received. The result is multiplied by 100
Council will create and shape healthy built and natural environments.
Service area Description of services provided
Turf Management Maintains and enhances all open space and sports fields.
Building Services Regulates and enforces building controls, ensuring buildings are safe.
Strategic Planning Manages land use and development through the Maribyrnong Planning Scheme and Council’s planning policies.
36,632
Environmental Sustainability
Waste Services
Develops, implements, and coordinates initiatives that address climate change, natural environment protection and enhancement, and promote sustainable practices, working in partnership with community and stakeholders to reduce emissions, enhance resilience, and protect natural assets.
Oversees the delivery of Council’s kerbside waste, recycling, and organics collections, along with disposal and processing contracts and additional services aligned with the Towards Zero Waste Strategy, setting the strategic direction for waste and resource efficiency and ensuring compliance with legislation and policy.
Property Management
Under a centre led model, oversees the leasing, sale, acquisition and geographic naming of property.
Urban Forest Manage and maintains Maribyrnong’s 56,000 trees, and trees in the public realm.
Service Performance Indicators Domain Measure Calculation
Environment ENV-R2 Sealed local roads below the intervention level
Environment
ENV-WM8 Kerbside collection waste to landfill per serviced property
Environment ENV-FS5 Food safety samples
Responsiveness
RSP-WM9 Kerbside collection bins missed
Number of kilometres of sealed local roads below the renewal intervention level set by Council / Kilometres of sealed local roads. The result is multiplied by 100.
Amount of waste in tonnes (t) collected from kerbside waste collection services that is sent to landfill / Number of serviced properties
Number of food samples obtained / Required number of food samples. The result is multiplied by 100.
Number of kerbside collection bins missed / Number of scheduled kerbside collection bin lifts. The result is multiplied by 10,000
Strategic Objective 4: Thriving Community Council will drive innovation and future-focused change to shape a resilient and adaptable city.
Service area Description of Services Provided
&
and
Building Maintenance Manages the life cycle of Council's 144 facilities.
Civil Maintenance
Asset Protection
Development Engineering
Footscray Revitalisation
Cleansing and Fleet Services
Economic Development and Smart Cities
Major Initiatives
Maintains Council’s 346km of roads, 541km of footpaths and 332km of stormwater drainage pipes.
Implements the asset protection system by issuing relevant permits and monitoring third-party works.
Assesses and guides developer and service authority works, sets civil infrastructure requirements, approves designs, and oversees construction and asset handover.
the revitalisation of the Footscray CBD
Ensures the public realm is clean and well-presented. Manages and maintains Council’s light and heavy fleet.
Supports Maribyrnong’s business community.
6,308,344
1,190,291 1,400,345 1,764,481
Review and refresh the Footscray Structure Plan to guide sustainable urban development, improve infrastructure and enhance the liveability of the Footscray area
Complete Year Two of the redevelopment of Creative West, RecWest Footscray and Shorten Reserve
Service Performance Indicators
Domain Measure
Responsiveness
Responsiveness
RSP-SP1 Time taken to decide planning applications
RSP-SP2 Planning applications decided within the relevant required time
Calculation
The median number of days between receipt of a planning application and a decision on the application
Number of planning application decisions made within 60 days for regular permits and 10 days for VicSmart permits / Number of planning application decisions made. The result is multiplied by 100.
Strategic Objective 5: Connected Community Council will build a connected, vibrant city where neighbourhoods thrive.
Service area Description of Services Provided
Asset Management and Capital Works Planning
Projects
Transport Planning
and advice on asset management services.
Designs and manages the delivery of Council’s
Manages transport and parking assets, delivers transport strategies and road safety programs, and reviews trafficrelated and heavy vehicle applications.
Open Space
City Planning Provides statutory planning services, including development approvals, permits and regulatory advice.
Design
Compliance
Enhances the built environment in Council’s Metropolitan, Major and Neighbourhood Activity Centres.
Manage the administration and oversight of Council’s law enforcement processes to ensure compliance and operational efficiency.
Emergency Management Lead municipal-level planning, preparedness, response, and recovery efforts for emergencies, fostering collaboration with internal and external stakeholders.
Arts and Culture Arts and Culture Supports the community by fostering and celebrating arts, culture and creativity.
Library Services Supports the community through access to spaces, programs and resources for connection and creativity.
Major Initiatives
Deliver the Maribyrnong Integrated Transport Strategy to improve connectivity, accessibility and sustainability
Reconciliation
3. Financial Statements
This section presents information about the Financial Statements and Statement of Human Resources. The budget information for the year 2026/27 has been supplemented with projections to 2029/30.
This section includes the following financial statements prepared in accordance with the Local Government Act 2020 and the Local Government (Planning and Reporting) Regulations 2020.
- Comprehensive Income Statement
- Balance Sheet
- Statement of Changes in Equity
- Statement of Cash Flows
- Statement of Capital Works
- Statement of Human Resources
Comprehensive Income Statement for the four years ending 30 June 2030
Fair value adjustments for investment property
Other comprehensive income
Items that will not be reclassified to surplus or deficit in future periods
Net asset revaluation gain /(loss)
Share of other comprehensive income of associates and joint ventures
Items that may be reclassified to surplus or deficit in future periods
(detail as appropriate)
Total other comprehensive income - - - - -
Balance Sheet for the Four Years Ending 30 June 2030
Statement of Changes in Equity for the Four Years Ending 30 June 20230
Statement of Cash Flows for the Four Years Ending 30 June 2030
Statement of Capital Works For the four years ending 30 June 2030
Statement of Planned Human Resources for the Four Years Ending 30 June 2030 Forecast Budget Projections
A summary of human resources expenditure categorised according to the organisational structure of Council is included below:
A summary of the number of full time equivalent (FTE) Council staff in relation to the above expenditure is included below:
Summary of Planned Human Resources Expenditure For the four years ended 30 June 2030
4. Notes to Financial Statements
This section presents detailed information on material components of the financial statements. Council needs to assess which components are material, considering the dollar amounts and nature of these components.
a. Comprehensive Income Statement
4.1.1 Rates and Charges
Rates and charges are required by the Act and the Regulations to be disclosed in Council’s budget.
As per the Local Government Act 2020, Council is required to have a Revenue and Rating Plan which is a four-year plan for how Council will generate income to deliver the Council Plan, program and services and capital works commitments over a four-year period.
In developing the Budget, rates and charges were identified as an important source of revenue. Planning for future rate increases has therefore been an important component of the financial planning process. The Fair Go Rates System (FGRS) sets out the maximum amount Councils may increase rates in a year. For 2026/27 the FGRS cap has been set at 2.75%. The cap applies to both general rates and municipal charges and is calculated based on Council’s average rates and charges.
The level of required rates and charges has been considered in this context, with reference to Council's other sources of income and the planned expenditure on services and works to be undertaken for the community.
To achieve these objectives while maintaining service levels and a strong capital expenditure program, the average general rate and the municipal charge will increase by 2.75% in line with the rate cap.
4.1.1(a) The reconciliation of the total rates and charges to the Comprehensive Income Statement is as follows:
*These items are subject to the rate cap established under the FGRS
The difference between the rate increase of 2.75% and 3.88% is due to the annualised impact of supplementary rates raised in 2025/26.
4.1.1(b) The rate in the dollar to be levied as general rates under section 158 of the Act for each type or class of land compared with the previous financial year.
Type or class of land
*40% discount applied to Cultural & Recreational properties
4.1.1 (c) The estimated total amount to be raised by general rates in relation to each type or class of land, and the estimated total amount to be raised by general rates, compared with the previous financial year
4.1.1 (d) The number of assessments in relation to each type or class of land, and the total number of assessments, compared with the previous
4.1.1(e) The basis of valuation to be used is the Capital Improved Value (CIV).
4.1.1(f) The estimated total value of each type or class of land, and the estimated total value of land, compared with the previous financial year
or class of land
4.1.1. (g) The municipal charge under section 159 of the Act compared with the previous financial year.
4.1.1(h) The estimated total amount to be raised by municipal charges compared with the previous financial year.
4.1.1(i) The rate or unit amount to be levied for each type of service rate or charge under Section 162 of the Act compared with the previous financial year and detailed disclosure of the actual service/s rendered for the amount levied
4.1.1(j) The estimated total amount to be raised by each type of service rate or charge, and the estimated total amount to be raised by service rates and charges, compared with the previous financial year
4.1.1(k) The estimated total amount to be raised by all rates and charges compared with the previous financial year
The difference between the rate increase of 2.75% and 3.76% is due to the annualised impact of supplementary rates and waste management charges
4.1.1(l)
Fair Go Rates System Compliance (ESC)
Maribyrnong City Council is required to comply with the State Government’s Fair Go Rates System (FGRS). The table below details the budget assumptions consistent with the requirements of the Fair Go Rates System.
4.1.1(m) Any significant changes that may affect the estimated amounts to be raised by rates and charges
There are no known significant changes which may affect the estimated amounts to be raised by rates and charges. However, the total amount to be raised by rates and charges may be affected by:
- The making of supplementary valuations (2026/27: estimated $1.220 million)
- The variation of returned levels of value (e.g. valuation appeals)
- Changes of use of land such that rateable land becomes non-rateable land and vice versa
- Changes in the use of land such that residential land becomes business land and vice versa.
4.1.1(n)
Differential Rates
The following differential rate amounts for the rating period commencing 1 July 2026 and ending 30 June 2027:
For the purposes of identifying the types/classes of land applicable to each rate the properties are grouped in accordance with the Australian Valuation Property Classification Code (AVPCC) Categories, as adopted by the Valuer-General Victoria (VGV) for the Revaluation.
Each differential rate will be determined by multiplying the Capital Improved Value of rateable land (categorised by the characteristics described below) by the relevant percentages indicated above.
Council believes each differential rate will contribute to the equitable and efficient carrying out of Council functions. Details of the objectives of each differential rate, the types of classes of land, which are subject to each differential rate and the uses of each differential rate, are set out below.
Residential Land
Definition:
Residential land is any land which does not have the characteristics of Commercial/Industrial or Residential Vacant Land rate.
Objectives:
The objective of this differential rate is to ensure that all rateable land makes an equitable financial contribution to the cost of carrying out the functions of Council, including (but not limited to) the: Construction and maintenance of infrastructure assets; Development and provision of health and community services; and Provision of general support services.
Characteristics:
Residential Land is any land.
- which is not Residential Vacant Land as described under the heading Vacant Residential land; - on which a building is erected and the site is approved for occupation by the issue of an occupancy certificate from Council and the site is available or used for residential purposes.
- the primary use of which is residential; or
- which is unoccupied and is zoned residential under the Maribyrnong Planning Scheme.
Types and Classes:
The types and classes of rateable land within this differential rate are those having the relevant characteristics described above.
- Used primarily for residential purposes: or
- Any land that is not defined Commercial/Industrial Land.
Use of Differential rate:
The money raised by the differential rate will be applied to the items of expenditure described in the Budget by Council. The level of the rate for land in this category is considered to provide for an appropriate contribution to Council’s budgeted expenditure, having regard to the characteristics of the land
Level of Rate:
Differential Rate is set as 100% in accordance with legislation.
Use of Land:
The use of the land within this differential rate, is any use permitted under the relevant planning scheme.
Geographic Location:
Wherever located within the municipal district. Planning Scheme Zoning
The planning scheme zoning, is the zoning applicable to each rateable land within this category, as determined by consulting maps referred to in the relevant Planning Scheme
Types of Buildings:
The types of buildings on the land within this differential rate are all buildings which are present on the land at the date of declaration of rates for the financial year.
Commercial Land
Definition:
Commercial Land is any land that does not have the characteristics of Residential, Industrial or Vacant land rate and which is used, designed or adapted to be used primarily for the sale of goods or services or other commercial purposes.
Objectives:
The objective of this differential rate is to ensure that all rateable land makes an equitable financial contribution to the cost of carrying out the functions of Council, including (but not limited to) the: Characteristics:
Commercial Land is any land.
- which is not Commercial Vacant Land, as described under the heading Vacant Commercial land
- on which a building designed or adapted for occupation is erected which is used for commercial purposes,
- which is used primarily for the sale of goods or services,
- which is used primarily for other commercial purposes.
Construction and maintenance of infrastructure assets; Development and provision of health and community services; and Provision of general support services.
Types and Classes:
The types and classes of rateable land within this differential rate are those having the relevant characteristics described above.
Use of Differential rate:
The money raised by the differential rate will be applied to the items of expenditure described in the Budget by Council. The level of the rate for land in this category is considered to provide for an appropriate contribution to Council’s budgeted expenditure, having regard to the characteristics of the land.
Level of Rate:
Differential Rate is set as 135%, or 35% higher than the residential land rate differential in accordance with legislation.
25% differential between commercial and Industrial property is deemed appropriate given the ‘scale’ of commercial activity is generally much higher than Industrial. It is recognised that these two rate groups underpin the financial and employment aspirations of Maribyrnong – if they are not strong and successful, it will be much harder for Maribyrnong to thrive.
Use of Land:
The use of the land within this differential rate, is any use permitted under the relevant planning scheme.
Geographic Location:
Wherever located within the municipal district Planning Scheme Zoning
The planning scheme zoning, is the zoning applicable to each rateable land within this category, as determined by consulting maps referred to in the relevant Planning Scheme.
Types of Buildings:
The types of buildings on the land within this differential rate are all buildings which are present on the land at the date of declaration of rates for the financial year.
Industrial Land
Definition:
Industrial Land is any land that does not have the characteristics of Residential, Commercial or Vacant land that is used, designed or adapted to be used primarily for industrial purposes.
Objectives:
The objective of this differential rate is to ensure that all rateable land makes an equitable financial contribution to the cost of carrying out the functions of Council, including (but not limited to) the:
Construction and maintenance of infrastructure assets; Development and provision of health and community services; and Provision of general support services.
Characteristics:
Industrial Land is any land.
- which is not industrial vacant land under the heading vacant industrial land, - on which a building is erected, or the site is adapted for occupation and is used for industrial purposes,
- located in an industrial zone or other area in the Municipality.
Types and Classes:
The types and classes of rateable land within this differential rate are those having the relevant characteristics described above.
Use of Differential rate:
The money raised by the differential rate will be applied to the items of expenditure described in the Budget by Council. The level of the rate for land in this category is considered to provide for an appropriate contribution to Council’s budgeted expenditure, having regard to the characteristics of the land.
Level of Rate:
Differential Rate is set as 160%, 60% higher than the residential land rate differential in accordance with legislation. Thus, an industrial property will pay 60% more in rates than a residential property assuming they have the same valuation.
25% differential between commercial and Industrial property is deemed appropriate given the ‘scale’ of commercial activity is generally much higher than Industrial. It is recognised that these two rate groups underpin the financial and employment aspirations of Maribyrnong – if they are not strong and successful, it will be much harder for Maribyrnong to thrive.
Use of Land:
The use of the land within this differential rate, is any use permitted under the relevant planning scheme.
Geographic Location:
Wherever located within the municipal district.
Planning Scheme Zoning
The planning scheme zoning, is the zoning applicable to each rateable land within this category, as determined by consulting maps referred to in the relevant Planning Scheme.
Types of Buildings:
The types of buildings on the land within this differential rate are all buildings which are present on the land at the date of declaration of rates for the financial year.
Residential Vacant Land
Definition:
Residential Vacant land is any land on which there is no building and does not have the characteristics of Commercial or Industrial Land rate.
Objectives:
The objective of this differential rate is to: promote responsible land management through appropriate maintenance and development of the land; and encourage prompt development of vacant residential land and attract new residents to the Maribyrnong; and ensure that all rateable land makes an equitable financial contribution to the cost of carrying out the functions of Council, including (but not limited to) the: Construction and maintenance of infrastructure assets.
Development and provision of health and community services; and Provision of economic development and general support services.
Characteristics:
Residential Vacant Land
Residential Vacant Land is any land which is zoned residential under the Maribyrnong Planning Scheme and on which there is no dwelling or other building designed or adapted for occupation. It includes a land on which:
- a planning permit authorising the subdivision of the land has been issued; and - a certificate of occupancy has not been issued from Council for residential purposes.
Types and Classes:
The types and classes of rateable land within this differential rate are those having the relevant characteristics described above.
Use of Differential rate:
The money raised by the differential rate will be applied to the items of expenditure described in the Budget by Council. The level of the rate for land in this category is considered to provide for an appropriate contribution to Council’s budgeted expenditure, having regard to the characteristics of the land.
Level of Rate:
This rating differential currently is 200%, thus 100% higher than the residential property rate differential. Thus, a Residential Vacant Land property will pay 100% more in rates than a residential property assuming the same valuation.
For people / businesses who have purchased land with the intent to develop, an increase in rate is a small factor when compared to the costs they will incur with development, and the subsequent higher rate value (not differential) which will apply post development.
Use of Land:
The use of the land within this differential rate, is any use permitted under the relevant planning scheme.
Geographic Location:
Wherever located within the municipal district
Planning Scheme Zoning
The planning scheme zoning, is the zoning applicable to each rateable land within this category, as determined by consulting maps referred to in the relevant Planning Scheme.
Commercial Vacant Land
Definition:
Commercial Vacant land is any land on which there is no building and does not have the characteristics of Residential or Industrial Land rate.
Objectives:
The objective of the rate is to encourage development for commercial purposes and ensure that the owners of the land having the characteristics of Commercial Vacant Land make an equitable financial contribution to the cost of carrying out Council's functions.
The Vacant Commercial Land differential is higher than the Residential Land differential for several reasons, including.
To assist in the management of sustainable growth across metropolitan Melbourne.
- Council's financial commitment to economic development initiatives; and
- Promote commercial development within the appropriate zone municipal areas
- Reducing the possibility that land holders not progressing in reasonable time to develop the land may impede the ability of other businesses to access suitable land for their own commercial use.
Characteristics:
Commercial Vacant Land
Commercial Vacant land is any land on which no building is erected but which, by reason of its locality and zoning under the Maribyrnong Planning Scheme, would - if developed - be or be likely to be used primarily for Commercial Purposes.
Types and Classes:
The types and classes of rateable land within this differential rate are those having the relevant characteristics described above.
Use of Differential rate:
The money raised by the differential rate will be applied to the items of expenditure described in the Budget by Council. The level of the rate for land in this category is considered to provide for an appropriate contribution to Council’s budgeted expenditure, having regard to the characteristics of the land.
Level of Rate:
This rating differential currently is 300%, thus 200% higher than the residential property rate differential. Thus, a Commercial Vacant Land property will pay 200% more in rates than a residential property assuming the same valuation.
For people / businesses who have purchased land with the intent to develop, an increase in rate is a small factor when compared to the costs they will incur with development, and the subsequent higher rate value (not differential) which will apply post development.
Use of Land:
The use of the land within this differential rate, is any use permitted under the relevant planning scheme
Geographic Location:
Wherever located within the municipal district.
Planning Scheme Zoning
The planning scheme zoning, is the zoning applicable to each rateable land within this category, as determined by consulting maps referred to in the relevant Planning Scheme.
Industrial Vacant Land
Definition:
Industrial Vacant land is any land on which there is no building and does not have the characteristics of Residential or Industrial Land rate.
Objectives
The objective of this rate is to encourage development for industrial purposes and ensure that the owners of the land make an equitable financial contribution to the cost of carrying out Council's functions. Encouragement includes:
- Promoting landowners to develop their land, to bring about increased community benefits as covered in the ‘Developed Industrial Land’ discussion.
Reducing the possibility that land holders not progressing in reasonable time to develop the land may impede the ability of other businesses to access suitable land for their own industrial use.
Characteristics:
Industrial Vacant Land
Industrial Vacant land is any land on which no building is erected but which, by reason of its locality and zoning under the Maribyrnong Planning Scheme, would - if developed - be or be likely to be used primarily for Industrial Purposes.
Types and Classes:
The types and classes of rateable land within this differential rate are those having the relevant characteristics described above.
Use of Differential rate:
The money raised by the differential rate will be applied to the items of expenditure described in the Budget by Council. The level of the rate for land in this category is considered to provide for an appropriate contribution to Council’s budgeted expenditure, having regard to the characteristics of the land.
Level of Rate
This rating differential currently is 300%, thus 200% higher than the residential property rate differential. Thus, Industrial Vacant Land property will pay 200% more in rates than a residential property assuming the same valuation.
For people / businesses who have purchased land with the intent to develop, an increase in rate is a small factor when compared to the costs they will incur with development, and the subsequent higher rate value (not differential) which will apply post development.
Use of Land:
The use of the land within this differential rate, is any use permitted under the relevant planning scheme.
Geographic Location:
Wherever located within the municipal district
Planning Scheme Zoning
The planning scheme zoning, is the zoning applicable to each rateable land within this category, as determined by consulting maps referred to in the relevant Planning Scheme.
Cultural & Recreational Lands
Definition:
Cultural & Recreational Land is any land that does not have the characteristics of Residential, Commercial/industrial or Vacant land that is used, designed or adapted to be used primarily for cultural, recreational, sporting activities, and similar purposes.
Objectives:
The following are the objectives of differential rates currently adopted for the different property types. To ensure that the promotion of cultural, heritage and recreational activity occur within Council’s municipal district and that this is supported in a way that encourages appropriate activity and development. Council has considered the service utilised by the lands and the benefit these lands provide to the community by consideration of their cultural or recreational land use, as required under The Act
Characteristics:
Any land which is not rateable Land which is specifically set aside for the use of cultural and recreational activities whereby the members do not derive a financial benefit or profit from the activities.
The Act effectively provides for properties used for indoor/outdoor activities to be differentially rated. For the 2025-26 rating year Council will provide a concession to properties coded with a description of ‘Cultural and Recreational Lands’ in Council's rate records. The residential rate is applied to these properties and then a 40 per cent discount on rates is apportioned to each property. It is considered that these clubs provide a benefit to the general community.
Types and Classes:
Under the provisions of the Cultural and Recreational Land Act 1963, the Council levies an number of rates payable in respect of recreational lands that cater for sporting activities on the land.
Use of Differential rate:
The level of the rate for land in this category is considered to provide for an appropriate contribution to Council’s budgeted expenditure, having regard to the characteristics of the land.
Level of Rate
This rating differential currently is 100% and is discounted by 40%. The Cultural and Recreational property will pay up to 40% less in rates than a residential property assuming the same valuation.
Under the Cultural and Recreational Lands Act, Council can vary the rates payable to be “any such amount as the municipal Council thinks reasonable, having regard to the services provided by Council in relation to such lands and having regard to the benefit to the community derived from such recreational lands.”
Use of Land:
The use of the land within this differential rate, is any use permitted under the relevant planning scheme
Geographic Location:
Wherever located within the municipal district.
Planning Scheme Zoning
The planning scheme zoning, is the zoning applicable to each rateable land within this category, as determined by consulting maps referred to in the relevant Planning Scheme.
Types of Buildings:
The types of buildings on the land within this differential rate are all buildings which are present on the land at the date of declaration of rates for the financial year.
4.1.2
Statutory Fees and Fines
4.1.3 User Fees
4.1.4 Grants
Grants are required by the Act and the Regulations to be disclosed in Council’s budget.
Grants were received in respect of the following:
Summary of grants
(a)
Recurrent
(b) Capital Grants
4.1.5
4.1.6 Other Income
4.1.7 Employee Costs
4.1.8 Material and Services
4.1.9 Depreciation
4.1.10 Depreciation - Right of use assets – Amortisation
4.1.11 Net gain/ (loss) on disposal of property, infrastructure, plant and equipment
4.1.12 Other Expenses
4.2.1 Borrowings
The table below shows information on borrowings specifically required by the Regulations. Forecast
Statement of Changes in Equity
4.3.1 Reserves
Capital Works Program
This section presents a listing of the capital works projects that will be undertaken for the 2026/27 year, classified by expenditure type and funding source.
4.4.1 Summary
For The Year Ending 30 June 2027
4.4.2 Current Budget New Works
Project ID For The Year Ending 30 June 2027
Road Re-Sheet ProgramHampden Street (CrothersAshley), Braybrook
Road Re-Sheet ProgramRenown Street (Mitchell - Radio), Maidstone
P24250477 Road Re-Sheet Program - Edward Street (Pilgrim - Charles), Seddon
P24250477 Road Re-Sheet Program - Oscar Street (Williamstown Road - End), Seddon
Halstead done recently but Powell Crescent is in bad condition and needs to be done
Project ID For The Year Ending 30 June 2027
P24250477 Road Re-Sheet Program - Neylon Street (Gents to Dead End), Yarraville
Resheet with Patching with kerb works, pit adjustments and provision of pram xing matching existing gravel path.
P24250477 Road Re-Sheet ProgramAlexander Street (WindsorVictoria), Seddon
Road reconstruction including kerb and channel Road Reconstruction/ Rehabilitation Program -
4.4.3 Capital Works Carried Forward From the 2025/26 Year
Capital Works Program - Carried Forward from the 2025/2026 Year
Project ID For The Year Ending 30 June 2027
Project ID For The Year Ending 30 June 2027
4.5 Summary of Planned Capital Works Expenditure for the years ending 30 June 2028, 2029 & 2030
5. Financial Performance Indicators
The following table highlights Council’s current and projected performance across eight targeted performance indicators selected by Council from the range of prescribed performance measures contained in the Local Government (Planning and Reporting) Regulations 2020. These indicators provide a useful analysis of Council’s intentions and performance and should be interpreted in the context of the organisation’s objectives. Results against these indicators and targets will be reported in Council’s Performance Statement included in the Annual Report. Domain
Governance
Transparency
Councillor attendance at Council meetings
Sum of the number of Councillors who attended each Council meeting/(Number of Council meetings) × (Number of Councillors elected at the last Council general election)
Governance Staff Turnover
Strategic
Community Infant enrolments in the MCH service
MCH Services
Infants enrolled in the MCH service (from birth notifications received)/Number of birth notifications received
Environment Food safety samples
Responsiveness Time taken to decide planning applications
Statutory
Responsiveness Kerbside collection bins missed
Waste Management
Number of kerbside collection bins missed/Number of scheduled kerbside collection bin lifts
1 Councillor attendance at Council meetings
It is expected that Councillors will attend all scheduled Council meetings
2 Staff Turnover
A healthy staff turnover rate is approx. 10%. Staff turnover enables the organisation to inject fresh ideas, review structures and replace underperforming staff
3 Utilisation of aquatic facilities
The Maribyrnong Aquatic Centre continues to attract strong attendance, averaging over 2,000 visits per day. Programs and facilities are evolving to meet the needs of Maribyrnong’s diverse community. The new waterslides and splash park opening in mid-2027 will offer more interactive water-play options and are expected to boost attendance.
4 Library visits per head of population
This target is consistent with previous trends
5 Infant enrolments in the MCH service
The existing trend of infant enrolments in the MCH service is expected to continue
6 Food safety samples
This target is consistent with previous trends
7 Time taken to decide planning applications
Data from recent years shows a reduction in the time taken to decide applications. This trend is expected to continue.
8 Kerbside collection bins missed
Missed collections are expected to remain consistent with trends for 2026/27 before increasing slightly in 2027/28 with the introduction of FOGO for multi-unit dwellings, and again in 2028/29 when the new contract begins.
5a Targeted Performance Indicators (Mandatory)
The following tables highlight Council’s current and projected performance across a selection of targeted service and financial performance indicators. These indicators provide a useful analysis of Council’s intentions and performance and should be interpreted in the context of the organisation’s objectives. The targeted performance indicators below are the prescribed financial performance indicators contained in Schedule 4 of the Local Government (Planning and Reporting) Regulations 2020. Results against these indicators and targets will be reported in Council’s Performance Statement included in the Annual Report.
Targeted Service Performance Indicators - Mandatory
Domain
Governance
Community engagement (Council decisions made and implemented with community input)
Environment Roads
(Sealed local roads are maintained and renewed to ensure a safe network)
Responsiveness
Statutory planning (Councils decide on planning applications and fulfill their legislative duties in a timely manner)
Environment
Waste management
(Waste is minimised and sustainability promoted)
Satisfaction with the opportunities offered by Council to be consulted or engaged in Council decisions
Community satisfaction rating out of 100 with the consultation and engagement efforts of Council
Sealed local roads below the intervention level
Number of kms of sealed local roads below the renewal intervention level set by Council / Kms of sealed local roads
Planning applications decided within the relevant required time
Number of planning application decisions made within the relevant required time / Number of planning application decisions made
Kerbside collection waste to landfill
Waste in tonnage collected from kerbside waste collection services sent to landfill / Number of serviced properties
"Key to Target Trend: +increase in Council's overall targets omaintaining Council's overall targets - decrease in Council's overall targets"
Targeted Financial Indicators - Mandatory
Financial management
Liquidity
(Sufficient working capital and cash is available to cover expenses) Current assets compared to current
Financial forecasting
Asset renewal and upgrade (Renewal and upgrade of assets is planned and delivered)
Financial management Rates concentration (Revenue is generated from a range of sources)
Financial management
Expenditure and revenue level
(Resources
used efficiently in the delivery of services)
Key to Target Trend:
+increase in Council's overall targets omaintaining Council's overall targets - decrease in Council's overall targets
Satisfaction with the opportunities offered by Council to be consulted on or engaged in Council decisions
This target remains appropriate given stable historical performance and the external factors that influence community perceptions 10
Sealed local roads below the intervention level
Number of kms of sealed local roads below the renewal intervention level set by Council / Kms of sealed local roads
This target is consistent with previous trends 11
Planning applications decided within the relevant required time
Number of planning application decisions made within the relevant required time / Number of planning application decisions made
This target is consistent with previous trends
This target is consistent with tonnes of waste to landfill data from previous years, with a trend towards this amount reducing over time
Current assets compared to current liabilities
This target is consistent with previous trends
Asset renewal compared to depreciation
This target is consistent with previous trends.
Rates compared to adjusted underlying revenue
This target is consistent with previous trends
Expenses per property assessment
This target is consistent with previous trends
5b Financial Performance Indicators
The following table highlights Council’s current and projected performance across a range of key financial performance indicators. These indicators provide a useful analysis of Council’s financial position and performance and should be interpreted in the context of the organisation’s objectives. The financial performance indicators below are the prescribed financial performance indicators contained in Part 3 of Schedule 3 of the Local Government (Planning and Reporting) Regulations 2020. Results against these indicators will be reported in Council’s Performance Statement included in the Annual Report.
Indicator
Financial Forecasting Indebtedness
(level of long-term liabilities is appropriate to the size and nature of a Council's activities)
Loans and borrowings
(level of interest-bearing loans and borrowings is appropriate to the size and nature of Council's activities)
and borrowings
to
Population
is a key driver of a Council's ability to fund the delivery of services to the community)
Revenue and grants
is generated from a range of sources in order to fund the delivery of services to the community)
Indicator Measure
Financial Forecasting
Financial management
Liquidity
(sufficient
expenses)
Liquidity
(sufficient working
and cash is available to cover expenses)
Operating position (an adjusted underlying surplus is generated in the ordinary course of business)
(rating level is set based on the community's capacity to pay)
underlying surplus (or deficit)
(deficit)
Expenditure and revenue level (resources are used efficiently in the delivery of services)
Sustainability Capacity
Key to Forecast Trend:
+Forecasts improvement in Council's financial performance/financial position indicator
oForecasts that Council's financial performance/financial position indicator will be steady
- Forecasts deterioration in Council's financial performance/financial position indicator
6. Summary of Financial Position
The following reports provide detailed analysis to support and explain the budget reports in the previous section.
This section includes the following analysis and information: Summary of Financial Position
Council has prepared a Budget for the 2026/27 financial year which seeks to balance the demand for services and infrastructure with the community’s capacity to pay. Key budget information is provided below about the rate increase, operating result, services, cash and investments, capital works, financial position, financial sustainability and strategic objectives of the Council.
6.1.1 Rates & Charges
Rates
& Charges
in millioins
The average rates increase by 2.75% (rate cap 2.75%) for the 2026/27 year, raising total rates and charges of $139.48 million, including $1.220 million generated from supplementary rates. This will result in an increase in total revenue from rates and service charges of 3.88%. The difference between the rate cap of 2.75% and 3.88% is due to the annualised impact of supplementary rates raised in 2025/26
6.1.2 Operating Result
Surplus/Deficit
The expected operating result for the 2026/27 year is a surplus of $25 52 million, which is a decrease of $0.537 million over forecast of 2025/26.
6.1.3 Cash & Investments
Cash & Investments
Cash and Investments is forecast to decrease from 2025/26 to 2026/27 year due to a run down in cash reserves to fund the capital program. The trend in later years is to remain steady at an acceptable level.
6.1.4 Capital Works
$100.00
$90.00
$80.00
$70.00
$60.00
$50.00
$40.00
$-
The capital works program for the 2026/27 year is expected to be $91 452 million. The capital expenditure program has been set and prioritised based on a rigorous process of consultation that has enabled Council to assess needs and develop sound business cases for each project. This year's program includes a number of major projects. (Capital works is forecast to be $57.27 million for the 2025/26 year).
6.1.5 Council Expenditure Allocations ($000)
Council Expenditure Allocations
Capital and Improvement Works Program, $91,452 , 37%
Planning and Environment Services, $44,332 , 18%
Community Services, $23,107 , 10% Corporate Services, $41,538 , 17%
Infrastructure Services, $44,855 , 18%
The previous chart provides an indication of how Council allocates its expenditure across the main services that it delivers. It shows how much is allocated to each service area for every $100 that Council spends.
The adjusted underlying result, which excludes items such as non-recurrent capital grants and contributions is a surplus of $10 472 million for 2025/26 forecast and $11 507 million for 2026/27
A high-level Projections for the years 2026/27 to 2029/30 has been developed to assist Council in adopting a budget within a longer term prudent financial framework. The key objective of the Plan is financial sustainability in the medium to long term, while still achieving the Council’s strategic objectives as specified in the Council Plan. The adjusted underlying result, which is a measure of financial sustainability, shows an increasing surplus over the four-year period.
6.1.7 Financial Position
The financial position (working capital) is expected to decrease by $21 17 million when compare from 2025/26 forecast to 2026/27 budget. This is mainly due to spending of capital works.
The key outcomes are as follows:
- Financial sustainability - Cash and investments are forecast to decrease from 2025/26 forecast actuals of $116 905 million to $92 681 million.
- Service delivery strategy – Service levels have been maintained throughout the four-year period. Despite this, operating surpluses are forecast for the years 2025/26 to 2029/30.
- Borrowing strategy –The new borrowings will be required in 2026/27 of $15 million.
7. Rating Information
Introduction
The rating system determines how Council will raise the total budgeted funds. It does not affect the total amount of money to be raised by Council, but rather the relative share of revenue contributed by each property type.
The Local Government Act 1989 requires that the rating system provide a “reasonable degree of stability in the level of the rates burden”.
Financial Management Principles
The Local Government Act 1989 prescribes the key principles of sound financial management for Councils. All Councils are required to implement and establish budgeting and reporting frameworks that are consistent with the following principles:
Manage financial risks faced by Council prudently, having regard to economic circumstances. Pursue spending and rating policies that are consistent with a reasonable degree of stability in the level of the rate burden.
Ensure that decisions and actions have regard to financial effects on future generations. Ensure full, accurate and timely disclosure of financial information relating to the Council. These broad fiscal principles are reflected in the Revenue and Rating Plan.
Relationship to other Plans and Processes
Council uses several planning processes and instruments to conduct operations. This enables Council to identify and raise the necessary funds to provide services, balance competing needs and maintain the City’s assets and facilities. The illustration in Section 1 shows the Revenue and Rating plan in the context of Council’s other key strategic and financial planning processes and instruments.
Total Revenue
The City of Maribyrnong levies property rates under the Local Government Act 1989 with rates being the Council’s main revenue source. The following chart provides a breakdown Council’s key revenue sources in 2025/26 and for the following 3 years under the Revenue and Rating Plan.
This chart shows that rates are the Council main revenue source, accounting for 71.05% ($139.5 million) of total income. Rates and charges revenue is raised by rates levied, municipal charge or waste charges levied.
Rateable Assessments and Valuations
The following chart shows the distribution of rate assessments (by number) in the City of Maribyrnong. The number of assessments in relation to each type or class of land, and the total number of assessments, compared with the previous financial year. The following chart shows the % breakdown of rate assessments compared to the % breakdown by valuation ($CIV):
2026/27 Assessment % 2026/27
This chart shows that, whilst residential assessments account for the vast majority (90.74%) of the total number of rateable assessments, they account for only 78.37% of total CIV (reflecting the lower average assessment size for residential properties).
Conversely, commercial and industrial assessments, with a combined 8.13% of rateable assessments (by number), account for a combined 19.38% of total CIV (reflecting larger average assessment size).
Rating Structure
The (2026/27) City of Maribyrnong rating structure is as follows:
or class of land
General
General
General
Municipal Charge $20 or waste charge 1 $292.20 and waste charge 2 $352 30
Rebate for pensioners (in addition to State funded pensioners rates remission scheme) of 50% of total rates and charges up to a maximum of $272.70 Provisions for the deferment and/or waivers of rates and charges in specific hardship cases
Residential Vacant Land Rebate – The objective is to grant to each owner of rateable land who meets the eligibility criteria a rebate of 50% on residential vacant land whose current differential is 200% to residential ratepayers where a Certificate of Occupancy Permit has been issued within 18 months of the completed building demolition or where the development has been impacted by a construction company being placed into administration and a Certificate of Occupancy Permit has been issued within 48 months of the completed building demolition(noting this rebate does not apply for the State Government Fire Service Levy)
40% discount applies to the six Cultural and Recreational Properties.
Valuation System
Capital Improved Value (CIV)
Maribyrnong City Council has in the past levied rates based on the Net Annual Value (NAV) of rateable property in the City. This has reflected the history of The City of Maribyrnong as an innercity Council with a high proportion of commercial and industrial assessments. Maribyrnong was one of six Councils in Victoria that still use the NAV system (Melbourne City, Port Phillip, Yarra, Whittlesea and Glen Eira).
Maribyrnong City Council applies Capital Improved Value (CIV) to all properties within the municipality to consider the fully developed value of the property. This basis of valuation considers the total market value of the land plus buildings and other improvements.
Differential rating allows (under the CIV method) Council to shift part of the rate burden from some groups of ratepayers to others, through different “rates in the dollar” for each class of property.
2026 Revaluation Outcomes
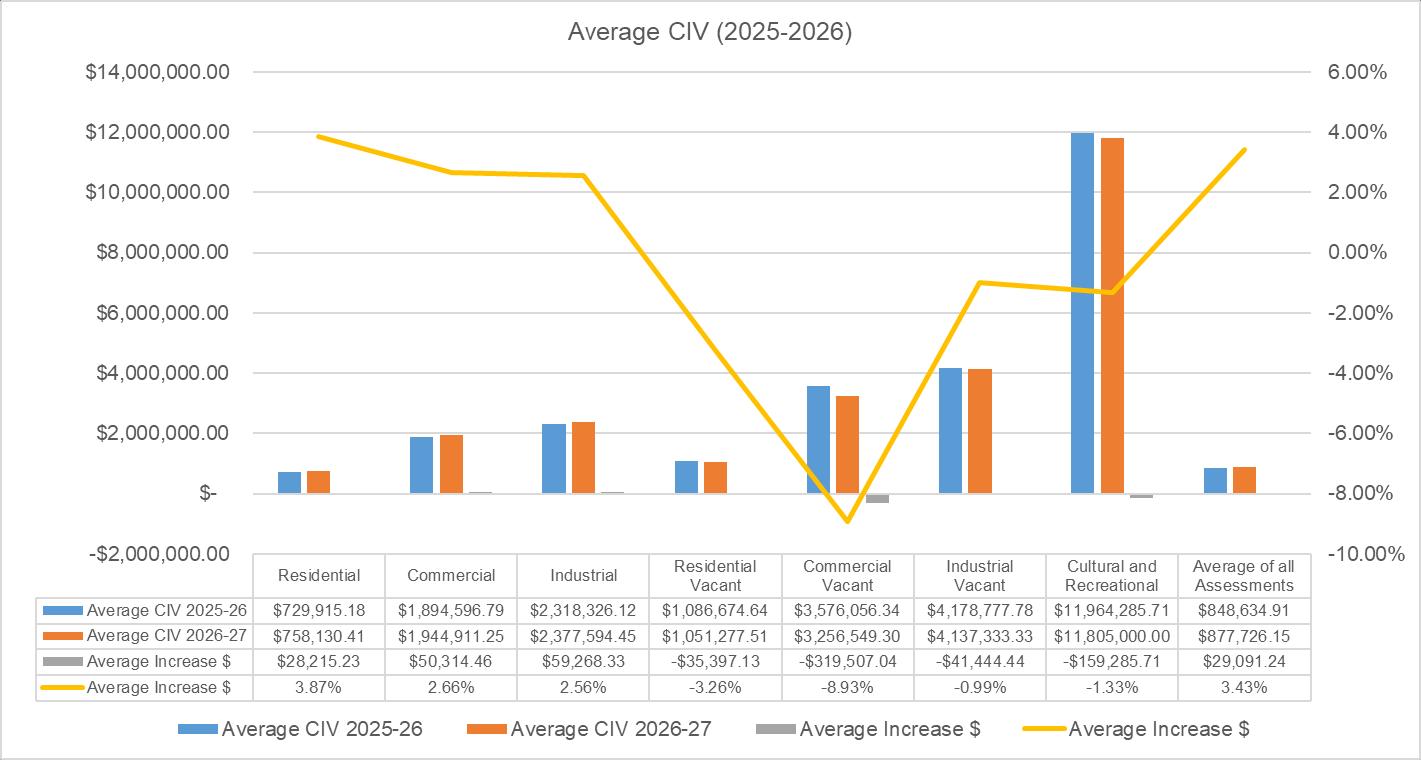
The chart below shows the impact of the most recent property revaluation in the City of Maribyrnong (returned in 2026). It shows the change in average CIV per assessment (by type) and the % change from 2025 to 2026.
This shows that the residential sector is to have increased in value over the previous 12-month period (3.87% increase).
The average residential vacant assessment has decreased in value 3.26%, with the average commercial vacant assessment decreasing by 8.93%.
Supplementary Valuations
Whilst the Council budget and the Rating Strategy is based on a ‘snapshot’ of the city rate base at the present point in time, Council is continually adding new rate assessments throughout the rating year. New property developments, including subdivisions, strata (unit) developments, consolidations, as well as property improvements and renovations to existing properties, lead to supplementary valuations.
The long-term average of supplementary valuations is that these add approximately 1.0% to 1.5% to Council’s valuation base (CIV) each year. This is included in Council’s long-term financial strategy. In 2026/27, in the current property market climate, supplementary valuations are assumed to be approximately 1%.
Fair Go Rates System (Rate Cap)
Planning for future rate increases has therefore been an important component of the Strategic Resource Planning and the Rating Strategy process. The Fair Go Rates System (FGRS) sets out the maximum amount Councils may increase rates in a year. For 2026/27 the FGRS cap has been set at 2.75%. The cap applies to both general rates and municipal charges and is calculated based on Council’s average rates and charges.
The FGRS is overseen by the Essential Services Commission. The current Financial Plan applies the following assumed rate cap/rate increase assumptions:
4 Years Budget
Revenue Raising Principles
In considering what rating tools and mechanisms are appropriate and equitable, Council must deal with all facets of the rating structure. This includes the valuation, budgetary requirements, differential rating and broad taxation principles. It must also consider rebates and concessions, as well as how to deal with situations of genuine hardship.
With the goal of balancing service levels to meet the needs and expectations of the community, it must adopt a rating and charge system that will adequately resource its operations.
Public Goods and the ‘Benefit’ Principle:
A key determinant for Council to consider in a broader revenue policy sense is whether a service or activity should be funded from rates or through user charges (or through a combination of both). In determining if services should be funded by specific user charges or through rates, Council considers whether services are either entirely or partially ‘public goods’. ‘Public goods’ are those services that provide a broad benefit to the community rather than a particular benefit to specific, identifiable individuals or groups. In the case of ‘public goods’, it is often difficult or impractical to exclude non-payers from the flow of benefits or to attribute costs to that user group.
Where possible, Council sets user charges based on the cost of provision of those services where there is clearly a direct line of benefit to users (i.e. waste collection service). At the same time small scale services or those where it would be difficult to reliably attribute costs or collect fees are funded through rates.
Stability and Fiscal Responsibility:
Council ensures that the rating strategy is consistent with the principles of sound financial management. It also needs to be fiscally responsible and sustainable in the context of the adopted long-term financial strategy. The Local Government Act (1989) requires that Council “pursue spending and rating policies that are consistent with a reasonable degree of stability in the level of the rates burden”.
In this regard, it is Council’s goal to minimise the impact of variations and fluctuations in the property market on the relative share of rates and charges paid by different ratepayer groups/sectors.
Balancing of Needs/Affordability:
A key goal in the rating strategy (alongside with the Council’s budgeting process) is balancing the competing community demands and needs of keeping rate increase as low as practicable (and within the State-wide rate cap). Rate setting and budgeting needs to be done whilst ensuring that the current and future needs of the community are adequately accounted for in terms of services, facilities and infrastructure.
Equity Principle:
This is a broad principle that applies to all public sector taxation. It includes so-called ‘horizontal’ and ‘vertical’ equity. Horizontal equity means that those in the same position (e.g. with the same property value) should be treated the same. Vertical equity in respect to property taxation means that higher property values should incur higher levels of tax.
Efficiency Principle:
This principle means that, in a technical sense, the rating system applied should not unduly interfere with the efficient operation of the economy. For Local Government, rates should be consistent with the policy objectives of Council.
Simplicity Principle:
The simplicity principle refers to both administrative ease (and therefore lower administrative cost) and to the ability of ratepayers to understand how the rating system works. This second aspect aims to make the rating system transparent and capable of being questioned and challenged by ratepayers.
Capacity to Pay:
Council also considers the impacts on different ratepayers and service user groups and their capacity to pay. The rating strategy is based on Council’s view of the most equitable, fair and fiscally responsible mix of rates and charges for the City of Maribyrnong under CIV rating.
Rates and Charges ‘Mix’ Options
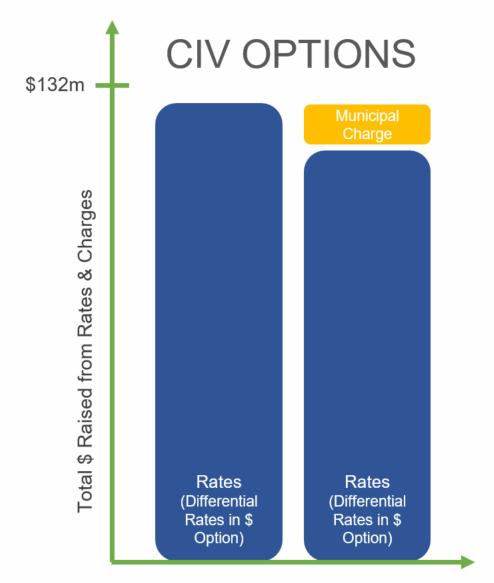
Switching to a CIV rating expands the range of rates and charges available to the Council, allowing for a fairer and more equitable distribution of the rating burden across the community.
These are shown below:
The ‘mix’ of rates and charges is applied by Council and can only be applied to raise the same budgeted total amount of rates and charges according to the adopted Council budget. Each of the rates and charges options that are available to Council under CIV rating is addressed below: Municipal Charge
Under the Local Government Act 1989, Councils that use the CIV system of rating also have the option of applying a flat annual Municipal charge. A Municipal Charge is not permitted where NAV rating is applied. The purpose of a Municipal charge as part of an overall rate mix is to provide a base revenue pool to cover part of Council’s base administrative and governance cost structure. It does not fluctuate with and is independent of market-driven property valuations.
As a flat charge (applies equally to all assessments across the valuation spectrum), a Municipal Charge will impact on lower value assessments (which are mostly residential) proportionately more than on higher value assessments (which are mostly commercial and industrial).
Under the Local Government Act 1989, a Municipal charge may be levied on all rateable assessments, including residential, commercial and industrial. The maximum amount of revenue that may be raised from a Municipal charge is 20% of total rates and charges levied. In Maribyrnong’s case, that equates to approximately $24 million
Waste Charge
Under the Local Government Act 1989, Councils can levy a waste charge to recoup the costs of providing the weekly waste and recycling collection and disposal services.
A waste charge is allowed to be used under either the NAV or the CIV system but has not been applied in the City of Maribyrnong in the past.
Key features of a waste charge are:
Waste charges are a compulsory (non-optional) fee-for-service charge levied only on those receiving the service. These are mostly (but not all) residential assessments.
Waste charges can be set as either a single, cross-the-board charge levied on all service recipients or at variable levels reflecting different service levels (i.e. different charges for landfill and recycling and different charges for different bin sizes etc.).
The total amount raised from waste charges cannot exceed the total expenses incurred by Council in delivering the relevant services. In the City of Maribyrnong’s case, the total expense currently is approximately $12.572 million
A key advantage of a waste charge (or waste charges) is that it reflects the user-pays philosophy. A waste charge creates a direct and transparent link between the cost to Council of providing the service and the amount charged to users. Further, it creates the opportunity to introduce variable waste charges. The use of variable waste charges (i.e. for different service types and levels etc.) creates the capacity for Council to use the pricing structure for waste services to pursue policy and behavioural change objectives. However, being a flat charge (like the Municipal charge), waste charges tend to have a higher proportional impact on lower value assessments.
Differential rates
Under the Local Government Act 1989, where a Council applies the CIV rating system, it may choose to levy differential rates in the $ on different property classes (residential, commercial, industrial and vacant lands).
In considering the differential rates options, Council must have regard to an overall rating strategy as well as the overriding principles of fairness and equity (and other general taxation principles) in distributing the costs of its services to the wider community. The application of these principles needs to occur in a holistic, overall way, with no single principle operating in isolation or taking precedence over another. In some cases, the individual/narrow application of a certain taxation principle can contradict the application of another principle.
Cultural and Recreational Lands
The Cultural and Recreational Properties continue to receive a waiver of 40% applied to Residential differential rate.
Under the Cultural and Recreational Land Act 1963, provision is made for Council to grant a rating concession to any recreational lands which meet the test of being rateable land under the Local Government Act 1989 i.e. outdoor recreational lands developed primarily for the general community benefit.
Municipal Rates Concession Scheme
Rate rebates for the 2026/27 financial year are as follows:
State funded pensioners municipal rates concession - this is a rebate of 50% of rates and charges up to a maximum of $259.53 per assessment for 2025/26 (2026/27 state funded pensioner municipal rates concession to be confirmed) plus $50 for the fire services levy.
Maribyrnong City Council - funded pensioner rates rebate scheme – this is an additional rebate payable to pensioners of 50% of rates and charges up to a maximum of $230.
Rebates in accordance with s169(1)(a) of the Local Government Act 1989
Residential Vacant Land Rebate
The objective is to provide rate relief to the residential vacant landowners whose current differential is 200% to residential ratepayers
Council grants to each owner of rateable land who meets the eligibility criteria below, a rebate of 50% on the 2026/27 instalments of Rates and Municipal Charge (noting this rebate does not apply for the State Government Fire Service Levy).
A person will be eligible to receive the rebate if the person: is the owner of rateable land categorised as Residential Vacant Land makes application to Council in the form determined by Council’s Chief Executive Officer, or delegate; and provides evidence showing that: the owner was the occupier of the residential land a Certificate of Occupancy Permit has been issued within 18 months of the completed building demolition.
Financial Impact
Average Rates bill (by type)
The following chart shows the average rates bill by property type under this rating strategy for 2026/27 (including all rates and flat charges, before any rebates):
The following chart shows the % change in average rates bill by assessment type (including all rates and flat charges, before any rebates):
The previous graphs show that, under the adopted rating strategy, the average residential rates and charges bill would increase, on average, by 3.48% in 2026/27. The average rates and charges for industrial will increase by 2.20% and the industrial vacant decreases by 1.34% respectively Rates and charges for residential vacant land will decrease by 3.57%.
Geographic Dispersal of Impacts
The following table shows the predicted % change to the average rates & charges bill (by assessment type and by locality/suburb) for 2026/27 (including Rates and Municipal charges):
The above table show that the predicted average rate and charges bill movements, as they apply across the whole City of Maribyrnong, are not evenly dispersed when analysed suburb by suburb. This shows that there is likely to be significant geographic variability in average rate bill impacts across the city.
The impacts on residential rate assessments are wide ranging across all locations. They vary from a 5.94% average rate bill increase in Maribyrnong to an average increase of 1.04% in Footscray.
For the commercial and industrial sectors, the movements range from an average rate bill increase of 30.08% (Tottenham commercial) to an average rate decrease of 20.32% (Kingsville industrial). It is noted that small observation numbers in some of the above property categories may mean ‘outliers’ have a disproportionate impact on category averages.
Frequency Distribution – % Rate Bill Movements (Residential)
The chart below shows the frequency distribution of percentage changes in the total rates bill (including municipal charges) for Residential assessment types from 2025/26 to 2026/27 before rebates).
This chart shows that the revaluation distribution impact, most ratepayers (26,174) will experience rate bill movements within the band of -40% to +4.99%. The chart also shows that number (286 assessments) would experience rate increases of over 30%.
Deferments, Waivers and Concessions
Council has a specific policy for the handling of hardship cases. This allows for the deferment of all or part of rates for varying times depending on circumstances. Interest on outstanding rates may also be waived in hardship cases. Applicants are required to specify the hardship grounds, on consideration of which Council may grant a deferment or waiver. This would generally continue until circumstances change, the land is sold or the property owner dies, when the rates and interest deferred would be taken from the property sale proceeds.
Payment of Rates
Rates may be paid by monthly/quarterly instalments or as a yearly lump sum payment. The Council also widely publicises the opportunity it allows for paying rates by arrangement throughout the year as it can be managed and encourages ratepayers who may be having difficulty to discuss payment arrangements with rates staff. Council has no change to its policy on payment of rates.
Application and Review
This Rating Strategy will be reviewed annually as part of the Council’s annual budget process.
8. Fees and Charges Schedule
This appendix presents the fees and charges of a statutory/non-statutory nature which will be charged in respect to various goods and services during the financial year 2026/27. Fees and charges are based on information available at the time of publishing and may vary during the financial year subject to any changes in Council's policy or legislation.
0200
Town Hall Meeting Room G.2 - Not for Profit (Monday – Friday between
– 5pm)
Town Hall Meeting Room G.3 - Not for Profit (Monday – Friday between
Town Hall Meeting Room Les Twentyman- Commercial (Monday –Friday between 8:30am – 5pm)
Hall Meeting Room Les Twentyman - Not for Profit (Monday –Friday between 8:30am – 5pm)
A minimum of one linear or one square metre is applicable to all rates except for footpaths where a minimum of 2.25 square metres applies (equivalent to one bay). A 20% loading will be applied to the prices quoted where work is carried out on arterial or collector roads as defined in the Melways. These rates cover costs associated with the reinstatement by Council’s road maintenance contractor, of road openings made by various authorities or public utility companies (i.e. City west water, Westar, Telstra, AGL) and by private contractors.
EXTENSION OF TIME AND SECONDARY CONSENT REQUESTS
– additional public notice (Planning Notice R Us) per additional notice
0621 Planning scheme – 11 to 20 submissions, change to an amendment, referring to a panel
Planning scheme – consideration by the Minister, to approve the amendment and giving notice of approval – paid to
scheme – exceed 20 submissions, change to an amendment, referring to a
Food Premises, Temporary Food Premises, Mobile Food Premises up to 10 employees – Class 2
Food Premises, Temporary Food Premises, Mobile Food Premises up to 10 employees – Supermarket, Milk Bars, Convenience Store, Bars, Nuts, Groceries, – Class 3
Food Premises, Temporary Food Premises, Mobile Food Premises – Extra employees – Class 1, 2 and 3
Food Premises – Non Profit, Social/Sporting Club / Schools, Temporary Food Premises, Mobile Food Premises up to & including 10 employees – Class 1 and 2
Premises, Temporary Food
Premises Pre-packaged Food Only – Warehouses, Greengrocers, Cold stores – Class 3
9. Appendix A Budget Processes
This section lists the budget processes to be undertaken to adopt the Budget in accordance with the Local Government Act 2020 and the Local Government (Planning and Reporting) Regulations 2020.
Under the Act, Council is required to prepare and adopt an annual budget for each financial year. The budget is required to include certain information about the rates and charges that Council intends to levy as well as a range of other information required by the Regulations which support the Act.
The 2026/27 budget, which is included in this document, is for the year 1 July 2026 to 30 June 2027 and is prepared in accordance with the Act and Regulations. The budget includes financial statements being a Comprehensive Income Statement, Balance Sheet, and Statement of Changes in Equity, Statement of Cash Flows and Statement of Capital Works. These statements have been prepared for the year ending 30 June 2027 in accordance with the Act and Regulations, and consistent with the annual financial statements which are prepared in accordance with Australian Accounting Standards and the Local Government Model Accounts. The budget also includes information about the rates and charges to be levied, the capital works program to be undertaken, the human resources required, and other financial information Council requires to make an informed decision about the adoption of the budget.
In advance of preparing the budget, Officers firstly review and update Council's long term financial projections. Financial projections for at least four years are ultimately included in Council's Financial Plan, which is the key long term financial plan produced by Council on a rolling basis. The preparation of the budget, within this broader context, begins with Officers preparing the operating and capital components of the annual budget during December and January. Concurrent with the preparation of the budget, early engagement was undertaken with the community during November to help shape the budget priorities. A draft consolidated budget is then prepared, and various iterations are considered by Council at informal briefings during February to April.
The Budget is prepared in accordance with the Act and submitted to Council in April for approval ’in principle’. Council has then opted to give ’public notice’ that it intends to ’adopt’ the budget and will give a minimum of 14 days’ notice of its intention to adopt the proposed budget and make the budget available for inspection at its offices and on its website. A person has the chance to submit their feedback in accordance with the Council's engagement policy regarding any proposals outlined in the budget. Feedback will be considered prior to the Council's adoption of the budget.
The final step is for Council to adopt the budget after receiving and considering any submissions from interested parties. The budget is required to be adopted by 30 June 2026.
10. Appendix B Council’s Commitment to Gender Equality
Maribyrnong City Council (Council) continues to maintain a strong commitment to gender equality and preventing family violence and violence against women, which is reflected in the Towards Gender Equity Strategy 2030, and the Gender Equality Action Plan 2022-2025 Together, these outline the actions Council will take to advance gender equality and contribute to the primary prevention of family violence across our organisation and community, whilst also being responsive to emerging issues.
The Strategy is framed around the ‘Change the Story Framework’ delivered by Our Watch, which uses evidence to demonstrate the direct links between gender inequality and violence against women and children. It supports Council to continue to strive for its vision for all people in Maribyrnong to flourish and live free from violence and discrimination and have equal status, rights, opportunities, representation and respect, regardless of their gender.
Council provides an Action Plan and Community Report Card annually. The Annual Action Plan includes details of the actions to be delivered through six objectives and accompanied strategies. The Community Report Card includes an outline of the programs, initiatives and key achievements that Council has undertaken to meet the objectives and strategies of Towards Gender Equity 2030 in the previous financial year. Council also reports on Gender Equality Act implementation and progress to the Commission for Gender Equality in the Public Sector every two years.
Gender Equality Act
The Victorian Gender Equality Act 2020 aims to improve gender equality in the Victorian public sector, local Councils and universities. The Act promotes gender equality by requiring these organisations to:
- Develop Gender Equality Action Plans to take positive action towards achieving workplace gender equality.
- Develop Gender Impact Assessments that consider and promote gender equality in their policies, programs and services.
In March 2022, Council submitted its first Gender Equality Action Plan (GEAP) 2022-2025 to the Commission for Gender Equality in the Public Sector (the Commission) – details of the investment to support this work is provided in the Council Resources section below. The GEAP outlines the steps Council will take to become safer and more gender equitable, and the strategies and actions in this plan will build on and complement our existing program of work in the community. In February 2024, Council submitted its first two-year progress report to the Commission highlighting the progress Council has made over seven indicators towards improving gender equality in the workplace.
Council will be submitting it’s second GEAP 2026-2029-and two-year Progress Report on the 22nd of May 2026.
Gender Equality Budget
In 2026/27, Council continues to invest significantly in staff, programs, services and infrastructure to support gender equality in our community. This includes:
- 0.5FTE (Gender Equality and Child Safety Advisor) is focused on gender equality, including family violence prevention (both internally and with community) and supporting workforce strategies
- $307,500 in programs and projects relating to gender equality.
- $500,000 for new payroll and HR system to improve data collection as required by the Gender Equality Act 2020
*This role is in addition to resources across Council departments and management, with the implementation of the GEAP supported by Council Executive Leadership and Senior Leadership teams.
A full list of Council resources supporting gender equality is outlined below. Program or Project Programs and Projects Description Department
Gender Equality Action Plan 2026-2029, annual implementation
Gender Impact Assessments
The Gender Equality Action Plan (GEAP) is one of the key requirements of the Gender Equality Act 2020. It includes strategies and measures to promote gender equality in the workplace, based on the results of a workplace gender audit.
Gender Impact Assessments (GIAs) are also required under the Gender Equality Act 2020 and are designed to help organisations, such as Councils, consider how policies, programs and services meet the different needs of women, men and gender diverse people.
Departments across Council deliver a range of programs, services and projects to improve gender equity in our municipality, key implementation includes:
Whole of organisation led by Community Outcomes and People, Culture and Performance
Whole of organisation
Towards Gender Equity 2030
- International Women’s Day 16 Days of Activism Against Gender Based Violence Preventing Violence Together Partnership Engaging men and boys in violence prevention
- Technology facilitated abuse prevention
LGBTIQA+ Strategy and Action Plan
She’s the Boss Women in Business Networking Events
Baby Makes Three
The Plan identifies actions to strengthen social and economic inclusion for the LGBTIQA+ community and reduce barriers to their participation, activities and programs are delivered annually.
The program is a partnership with local business ‘She’s the Boss’ to support a series of women in business networking events across the municipality. Three networking events and an International Women’s Day event are delivered annually.
Maternal and Child Health delivers the Baby Makes Three program throughout the calendar year. It aims to build equal and respectful relationships with families as they are transitioning to becoming parents for the first time.
The Youth Services Team supports gender equity projects and initiatives including:
Respectful Relationships
- Respectful Relationships program support in mainstream secondary schools Sexual and Reproductive health programs in alternative school settings, including Western English Language School.
- Child-led six-month gender equality program for year five and six primary school students. Early intervention program for boys exhibiting violent behaviour Information sessions for parents/carers on a range of topics from pornography,
Community Life led by Community Outcomes
Inclusive Communities
Economic Development and Smart Cities
Maternal and Child Health –Community Wellbeing
Youth Services and Community Outcomes
Program or Project Programs and Projects
Description Department
technology facilitated abuse and consent. An emphasis on programs to support and encourage gender equity
Gender Equity in the Early Years
Develop and delivery of gender equity information sessions and workshops as a part of the Parenting in Maribyrnong calendar.
Community Centre programs deliver health and wellbeing, resilience, cohesion, connectedness, empowerment and belonging in local communities, with a focus on improving gender equity in our municipality. Programs include:
Early Years –Community Life and Community Outcomes
Community Centre Programs
Sport and Recreation Programs
- Women's social programs including the Latin American Women's Social Group
- Links 4 Women – a support group for isolated women
- Education programs such as Home Maintenance Class for Women and career programs
- A range of women’s only fitness, health and yoga programs
Sport and recreation programs are delivered to support women’s health and wellbeing, with a focus on gender equality. Programs include:
- Active Maribyrnong (Spring into Summer and Get Active Expo) Leaders of the Pack
- Sons and Daughters of the West
- Club Development Series
- Victorian Local Government Partnership Program
- Partnerships with gender-inclusive sporting organisations.
Infrastructure Projects
Inclusive Communities
Facilities and Participation –Recreation and Open Space
Project Description Department
HR & Payroll Solution
Improved data collection to meet responsibilities under the Gender Equality Act 2020.
Payroll $500K
11. Appendix C Climate Statement
Council’s Role and Commitment
Local governments play a pivotal role in responding to the climate emergency, through reducing emissions, supporting community resilience, and advocating for stronger national and state action. Local Government Act 2020 reinforces this responsibility, requiring Councils to promote the economic, social, and environmental sustainability of their municipal districts, including through mitigation of and adaptation to climate change risks.
On 19 February 2019, Maribyrnong City Council declared a Climate Emergency, acknowledging that climate change poses an immediate and existential threat. This declaration commits Council and the community to act urgently to restore a safe climate, consistent with the best available science and the principles of social equity and environmental stewardship.
Understanding the Challenge
As global temperatures continue to rise, heatwaves, floods, bushfires, and storms are becoming more frequent and intense across Australia. These events are contributing to biodiversity loss, infrastructure damage, and public health risks. Within the City of Maribyrnong, the effects of climate change are already evident, particularly among our most vulnerable residents, who face higher risks due to age, health, housing, or economic circumstances.
Strategic Response
In 2020, Council adopted the Climate Emergency Strategy, developed collaboratively with the Climate Emergency Community Advisory Group (CEAC). The Strategy provides the overarching framework for Council’s transition to zero emissions and beyond, structured around six key priority areas for action:
The Climate Emergency
- Energy - Efficient Buildings and Infrastructure
- Transport - Consumption and Waste
- Land Use and Drawdown
In April 2022, Council endorsed the Climate Emergency Action Plan (CEAP), which translates these strategic priorities into a coordinated set of actions, programs, and partnerships that drive measurable change across Council operations and the wider community.
Progress and Future Direction
In recent years, Council continued to implement projects and partnerships that advance emissions reduction, energy transition, and community resilience. This work spans multiple departments and leverages external funding, partnerships, and advocacy to deliver tangible climate benefits for the municipality.
Looking ahead to 2026/27, Council will continue to expand its program of work to reduce emissions, accelerate electrification, enhance green infrastructure, and build capacity across Council operations and the community to respond to the impacts of a changing climate.
Key Outcomes 2025/26
Getting Off Gas Program – Developed implementation plan for transition of Council facilities to allelectric operations, completing technical assessments of 41 natural gas-consuming Council buildings. Once the gas transition is completed it will see an overall reduction of 1,074 tonnes of CO2 emissions.
Braybrook Community Battery Project – Successfully applied for State grant funding to deliver neighbourhood battery with a 100-kilowatt capacity. This project also includes the expansion of the existing rooftop solar adding increased energy production capacity. This project will support renewable energy access and increase building and community resilience.
Corporate Emissions – Council continues to report annual greenhouse gas emissions resulting from Council’s operations. Council’s emissions profile over time shows a 77% reduction from 12,416 tonnes of CO₂-e in 2008/09 to 2,907 tonnes in 2024/25.
Climate Emergency Advisory Committee (CEAC) – Facilitated quarterly meetings and strategic workshops to guide the review of the Climate Emergency Strategy and Action Plan and seek strategic advice.
Community Engagement – Council delivered over 150 events and education opportunities in various formats and topics such as sustainability, gardening, recycling, waste, and electric vehicles. Some highlights throughout the year were the delivery of the My Smart Garden program, School Youth Sustainability Summit for primary and secondary students, Olives to Oil program, celebration of Word Wetland Day, delivery of the Sustainable Living Festival and broader campaigns such as Plastic Free July and Garage Sale Trail.
Nature and Biodiversity – Endorsed the Nature Plan 2025–2035, and associated Action Plan 20262028, strengthening Council’s commitment to local biodiversity protection and nature-based climate solutions.
Integrated Water Management (IWM)
Progressed delivery of the IWM Plan, including addition of WSUD assets into our Asset Register, condition assessment audits and WSUD training for staff.
Key initiatives for 2026/27 include:
Project or Program
Integrated Transport Strategy
Climate Emergency Strategy and Action Plan
Climate Adaptation Framework
The Adaptation Game (TAG)
Description Department
Finalisation and implementation of Council’s Integrated Transport Strategy
Review and refresh of the 2020 strategy and 2021-2025 action plan.
Continued implementation of a Climate Adaptation Framework to increase Council resilience to climate risks.
Educational and interactive game used to support and educate community to recognise climate risks and better prepare when events occur.
Transport & Engineering
City Sustainability
City Sustainability
City Sustainability
City Sustainability
Education and engagement programs for community
Business engagement and inclusion of climate in business programs
Tree Canopy increase
Fleet Transition Plan
Delivery of community environmental, sustainability, waste and climate education sessions/program and information.
Inclusion of climate information in education/engagement tools in communications and events with businesses
Promote the urban forest and work to achieve canopy target in the public realm of 20%
A business case and roadmap that outlines the planned transition from Council’s current vehicle fleet to low- or zero-emission vehicles and associated infrastructure
Libraries, Arts & Culture
Inclusive Communities
Community Services & Social Infrastructure Planning
City Futures
City Sustainability
Recreation & Open Space
City Sustainability
Elevating ESD targets in the Planning Scheme
My Smart Garden program
Nature, data collection
Nature Strip Planting
Booklet & Habitat Garden
Housing Strategy
Continuing work with Council Alliance for a Sustainable Built Environment and local government sector on advocating for incorporating "Elevating ESD targets in the Planning Scheme" amendment into the Planning Scheme and implementing associated changes
Coordinate education program across 11 participating Councils and continue offering smart gardening services to community
Undertake vegetation and fauna habitat surveys and mapping for Natural Areas.
Development of educational materials to encourage and better support residents to plant indigenous species and habitat friendly gardens
Development of Housing Strategy including opportunities to increase greening and canopy trees in private realm
City Development
City Sustainability
City Sustainability
Recreation & Open Space
City Sustainability
City Development
Capital Projects to be funded within adopted capital works budget:
Project Department
Urban Forest Planning – audits, data and monitoring
Tree Planting
Active Transport Program – Minor works (enhancing safety, including delivering missing path connections, installing bicycle rails, and providing a bike maintenance station), behaviour change.
Footpath renewal program
Electrification of Maribyrnong Aquatic Centre (MAC)
Recreation and Open Space
Parks and Gardens
Transport and Engineering
Transport and Engineering
Recreation and Open Space
Getting off Gas City Sustainability
Braybrook Community Hub Neighbourhood Battery and Energy Upgrade City Sustainability