A brief from
March 2016
The Punishment Rate
New metric evaluates prison use relative to reported crime
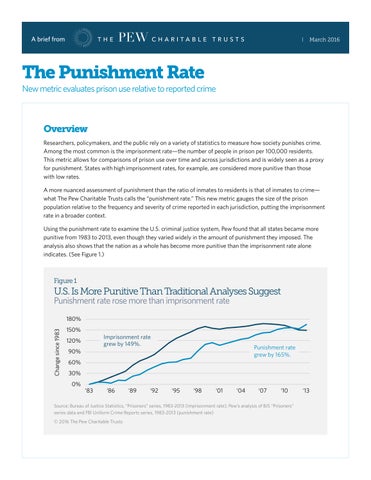
Overview Researchers, policymakers, and the public rely on a variety of statistics to measure how society punishes crime. Among the most common is the imprisonment rate—the number of people in prison per 100,000 residents. This metric allows for comparisons of prison use over time and across jurisdictions and is widely seen as a proxy for punishment. States with high imprisonment rates, for example, are considered more punitive than those with low rates. A more nuanced assessment of punishment than the ratio of inmates to residents is that of inmates to crime— what The Pew Charitable Trusts calls the “punishment rate.” This new metric gauges the size of the prison population relative to the frequency and severity of crime reported in each jurisdiction, putting the imprisonment rate in a broader context. Using the punishment rate to examine the U.S. criminal justice system, Pew found that all states became more punitive from 1983 to 2013, even though they varied widely in the amount of punishment they imposed. The analysis also shows that the nation as a whole has become more punitive than the imprisonment rate alone indicates. (See Figure 1.)
Figure 1
U.S. Is More Punitive Than Traditional Analyses Suggest Punishment rate rose more than imprisonment rate
Change since 1983
180% 150%
Imprisonment rate grew by 149%.
120% 90%
Punishment rate grew by 165%.
60% 30% 0%
‘83
‘86
‘89
‘92
‘95
‘98
‘01
‘04
‘07
‘10
Source: Bureau of Justice Statistics, “Prisoners” series, 1983-2013 (imprisonment rate); Pew’s analysis of BJS “Prisoners” series data and FBI Uniform Crime Reports series, 1983-2013 (punishment rate) © 2016 The Pew Charitable Trusts
‘13