
Professional Practice 2: Analysis and Research focused on Ecology

Page 1


UPD5102 Professional Practice 2: Analysis and Research

Assessment 3: Urban Design + Folio Refresh

CULTURAL ECOLOGY AND CLIMATE RESILIENCE

A multiscalar urban analysis of and proposal for the land around the Royal Botanic Gardens Cranbourne.

Ruby Thompson

I acknowledge that the land and waterways which are now known as Monash University and our study area around the Royal Botanic Gardens Cranbourne are on unceded Boonwurrung Country. I pay my respects to elders past and present. I recognise that sovereignty was never ceded and that this always was and always will be Aboriginal land. This project aims to be informed by Boonwurrung and other Aboriginal knowledges, and I extend these learnings to my wider studies and future work in urban planning and design.

PART 1: Sociospatial Analysis

PART 2: Data Visualisation PART 3:

Introduction

The following portfolio contains three sections: Sociospatial Analysis and Data Visualisation, which have been refreshed to respond to the Unit Coordinator’s feedback from Assessments 1 and 2; and a new Urban Design section. The overarching research themes are cultural ecology and climate resilience.

Part 1 contains a social and spatial analysis of the extended site context at two nominal planning scales: the ‘regional’ and the ‘local’ scale. This analysis largely focuses on the impact of urban development on native vegetation, parks, and green space in Southeast Naarm (Melbourne), and how these affect both humans and animals. At a local level, it also explores issues such as access to green space and the degradation of native vegetation since colonisation.

Part 2 contains tables, charts, and maps that enable an in-depth analysis of cultural ecology and climate resilience, represented visually. The analysis contains comparisons to other growth areas, and explores the issues of health, income, and education, and how this is impacted by proximity to green spaces.

Finally, Part 3 contains maps, cross-sections, and three-dimensional renderings to provide an in-depth analysis of the issues and opportunities of the site at the ‘urban design’ scale. It delivers a proposal for the site which responds to both the rigorous research undertaken in Parts 1 and 2, in conjunction with local case studies.

‘Slow down for bandicoots’ sign outside the RBGC (taken by Ruby, 2025).

PART 1

Sociospatial Analysis

Evaluating the Ecological and Social Effects Of Urban Growth in Southeast Naarm (Melbourne)

A diverse landscape with rich cultural heritage

The land and waterways of this region are on unceded Bunurong Country, with a small patch of Wurundjeri Country toward the North. Vast areas of cultural heritage sensitivity sites can be seen throughout the region, particularly surrounding the watercourse lines, water areas, and both Bays.

“Bunurong people belong to Country, as a part of Country water is integral to this belonging. Bunurong people belong to the water of a place.”

- Bunurong Land Council Aboriginal Corporation (DEECA 2022).

The map reveals a dynamic coastal landscape shaped by both natural systems and human activity. Wedged between two coastlines, the land in the centre is low lying, and gradually inclines towards the Dandenong Ranges.

The coastline and extensive water networks suggest strong hydrological connectivity, with rivers and streams flowing into both Port Phillip Bay and Western Port Bay. Human intervention in the hydrological system is most evident in the Southeast region towards Western Port Bay where the water course lines become more rigid and square. Western Port Bay is defined by vast wetlands and ecological abundance.

Forested areas dominate the higher land toward the Northeast nearing the Dandenong Ranges, where most of the native vegetation remains. Other remnant vegetation can be seen toward the centre of the region around the Royal Botanic Gardens Cranbourne (RBGC). This suggests major human intervention in the landscape, particularly around the more densely populated areas.

Scattered across the region are public parks and recreation zones with varying levels of biodiversity. Larger conservation and resource zones are located in the Northwest in Lysterfield, along the coast of Port Phillip Bay, and the RBGC.

Dandenong Ranges Western
Royal Botanic Gardens Cranbourne (RBGC)

Urban areas have minimal native vegetation, parks, and green spaces

Public Parks, Conservation and Recreation

1:130,000

Land in the centre of the region has been cleared of virtually all native vegetation for urban and agricultural development.

The native vegetation data is from 2005, so no doubt today’s modeling would show even less vegetation due to rapid urban expansion in Melbourne’s Southeast over the last 20 years. The volume of roads, particularly around the rail corridors, in the centre of this region also have minimal public green spaces of meaningful size and quality. Most of the region’s remnant native vegetation is located in the Dandenong Ranges and towards Western Port Bay and the RBGC.

Sherbooke Forest, Dandenong Ranges, remains densely vegetated (Greg 2011).
Industrial and residential development in Hallam, City of Casey has virtually no remnant native vegetation and minimal public green spaces (NearMap 2025).
RAMSAR listed wetlands at Western Port Bay are a haven for ecology and wildlife (Melbourne Water 2025).

Land is hotter in urban areas with less native vegetation and parks

Metropolitan Melbourne Urban Heat Islands 2018 by Mesh Block 1:130,000

Land in the centre of the region, which has been cleared of virtually all native vegetation for urban and agricultural development, is vastly hotter than surrounding well-vegetated areas.

The Urban Heat Island (UHI) Index is a measure of the deviation of urban temperatures relative to a nonurban baseline. Native vegetated sites were used to establish the baseline (DPT 2023). By comparing this map to the previous page, there is a clear correlation between the absence of native vegetation and parks, and higher surface temperatures.

The UHI Effecr occurs where heat is retained in hard surfaces and radiated out at night. Temperatures in urban areas have been found to be 1-7° hotter than in surrounding areas (DCCEEW 2021). The IPCC (2018) has estimated that even if global warming is restricted to below 2 °C, there could still be a substantial increase in the occurrence of deadly heatwaves in cities when urban heat island effects are considered.

Casey has been found to be the second hottest LGA in metropolitan Melbourne (Sun et al. 2019).

In their Urban Vegetation, Urban Heat Islands and Heat Vulnerability Assessment in Melbourne, 2018, Sun et al. (2019, p. 2) found that “large UHI concentration areas appeared in the west and southeast part of Melbourne metropolitan, along with some scattered areas with strong UHI effects in the northern suburbs. Lower LST concentration areas were mainly along the coastal areas, eastern and north eastern suburbs and highly vegetated areas.”

The average difference (°C) in land surface temperature to baseline temperature between

Aerial shot of Brimbank in Melbourne’s Northwest, the city’s hottest LGA (Engage Victoria 2025).
Dark rooves, no tree canopy coverage, and little native vegetation in Botanic Ridge contribute to higher land surface temperatures (My Junction 2021).
Melbourne LGAs (Sun et al. 2019).

Disadvantage is higher in hotter areas

Index of Relative Socio-economic Advantage and Disadvantage 2021 by SA1

1:130,000

Land in the centre of the region, which has been cleared of native vegetation and has hotter land surface temperatures, also has higher levels of socioeconomic disadvantage.

The Index of Relative Socio-economic Advantage and Disadvantage (IRSAD) index summarises information about the economic and social conditions of people and households within an area, including both relative advantage and disadvantage measures. A low score indicates relatively greater disadvantage and a lack of advantage in general (ABS 2018). By comparing this map to the previous two pages, there is a clear correlation between the absence of native vegetation and parks, higher surface temperatures, and higher levels of socio-economic disadvantage.

Higher socio-economic households are located in areas with more native vegetation, and subsequently lower surface temperatures, towards the Dandenongs in the Northeast and the Mornington Peninsula towards the Southwest.

This trend is not isolated to this region, as research shows that access to nature is not equitably distributed, with wealthier communities often having greater proximity to better quality green spaces than lower-income or minority communities. Ultimately, wealthier communities enjoy the benefits that come with living in close proximity to nature (Sefcik et al. 2019).

Moreover, urban nature is inextricably linked to human health and well-being; people are more likely to suffer from depression, anxiety, obesity and heatstroke in urban areas with fewer trees and parks (Browning et al. 2024). Thus, the lack of native vegetation in urban areas contributes to the UHI Effect, which in-turn perpetuates the cycle of socioeconomic disadvantage and low health outcomes. This will be explored further in Part 2.

Hotter Melbourne LGAs are also the most disadvantaged (Latham 2023).

In their Comparison Of Disadvantage and Urban Heat Island Effect In Melbourne, Australia, Latham (2023. p. 6-7) found that “there is a correlation between disadvantage and living in an area with a high UHI effect in Melbourne. For example, the six disadvantaged LGAs (IRSD scores less than 1,000) were also within the eight hottest areas. This is concerning because people experiencing disadvantage are likely to be more vulnerable to extreme heat yet are more likely to live in the areas of Melbourne where they are most exposed”.

and most

The ‘top 5’ hottest
disadvantaged LGAs (Latham 2023).
Berwick North, one of Casey’s highest socio-economic areas, is also one of its greenest (Dubecki 2021).

Disrupted networks for non-humans

Land Subject to Inundation

1:130,000

Humans are not the only species impacted by the effects of urban development; native vegetation provides shelter and networks for animals and pollinators.

The clearing of land for agriculture and urban development have greatly reduced the amount of habitat available to wildlife in Victoria. The fragments of natural vegetation that remain are often small and isolated from one another by man-made environments, which can act as barriers to wildlife movement (DELWP n.d.). The area around the Dandenong Ranges and Koo Wee Rup have denser native vegetation coverage, providing intricate networks for wildlife movement. However, these networks are disrupted by urban development in the centre of the region.

Moreover, Land Subject to Inundation provides habitats for an abundance of animals and insects.

A Land Subject to Inundation Overlay (LSIO) is a type of planning control that identifies properties that may be affected by flood risk. An LSIO is designed to prompt the early consideration of flood risks in the planning process and provide guidance and standards on how these sites should respond to that flood risk (VPA 2021). Developments in these areas must adhere to specific conditions, and are much less common due to this permit process.

This means that these areas can provide the perfect networks for waterbirds, fish, and the invertebrates they live on (Melbourne Water 2025). Similarly, these networks have been disrupted by urban development towards the East of this region, but remain strong surrounding Koo Wee Rup and Western Port Bay.

Koo Wee Rup Wetlands are a haven for wildlife and ecology (Balance Enviro 2018).
Clearing of land for development in Botanic Ridge (taken by Ruby, 2025).

Our study area consists of the RBGC and the adjacent suburbs of Botanic Ridge and Junction Village.

The Royal Botanic Gardens Cranbourne hosts natural bushland alongside the Australian Garden, a contemporary botanic garden which celebrates the beauty and diversity of Australian landscapes and flora, and features over 100,000 plants from 1,900 plant varieties. The surrounding bushland has over 450 indigenous plant species and includes over 10km of walking tracks. It is a precious remnant of the vegetation that once covered the broader region and is actively managed to control the number of non-indigenous plants and exotic weeds (RBGV n.d.).

Cranbourne
Botanic Ridge
Junction Village
Royal Botanic Gardens Cranbourne (RBGC)
Cultural Ecology Local Base Map made by Ruby using QGIS and Illustrator (Source: ABS 2021, VicPlan 2025, DEECA 2025, DPC 2025).
Drone shot of the RBGV (RBGV n.d.).
Botanic Ridge and Junction Village to the South of the Gardens are newer estates which feature low-density housing typologies (photo by Yann Tan, 2025).

Uneven access to public open space

Proximity to Parks and Recreation 1:26,000

There are a large number of properties which are located outside of a 400m walking radius from parks and recreation reserves.

Established developments in central Cranbourne and Botanic Ridge West have higher access to public parks. Botanic Ridge East is a newer development, so the data used may not reflect the current zones in the area. Notwithstanding this, there is still a large portion of land in the locality which is not within a walking distance from a green space. As has been discussed earlier in Part 1 at the regional scale, proximity to green spaces has profound effects on land surface temperatures, socio-economic advantage and disadvantage, and health outcomes.

Proximity to Education 1:26,000

Not all schools have equal access to parks and recreation reserves.

Only about half of the education centres, including childcare centres and schools, in this locality are within a 400m walking radius of a public park. As discussed, there is a wide evidence base for the beneficial impacts of green spaces in supporting urban ecological and social systems, particularly in relation to health and wellbeing. Studies also show that regular access to natural environments has beneficial effects on children’s health, development and academic attainment (Walker et al. 2021).

Destruction of native vegetation over time

Ecological Vegetation Classes (EVCs) (1750) 1:26,000

Remnant Native Vegetation (2005) 1:26,000

Before colonisation, this area boasted abundant swamps, grasslands and woodlands. As of the 21st century, most of this vegetation has been destroyed for urban development.

EVCs are a level of classification which consist of one or a number of floristic communities that appear to be associated with a recognisable environmental niche. Each EVC is described by a combination of its structure, floristic, life-form and reproductive strategy features, and through an inferred fidelity to particular environmental attributes (GBCMA n.d.).

Remnant native vegetation exists largely within the RBGC and surrounding agricultural farmland on private property.

Gippsland Plain Bioregion

The RBGC and surrounds are located on the Gippsland Plain, which includes flat, low lying costal and alluvial plains with a gently undulating terrain dominated by barrier dunes, floodplains, and swampy flats. The soils in this region support the Lowland Forest ecosystem. The dunes are primarily sandy soils which support Heathy Woodland ecoystems. The fertile floodplains and swamps support Swamp Scrub, Plains Grassy Woodland, and Plains Grassland ecosystems. The bioregion is generally below 200m above sea level, while the coastline includes sandy beaches with dunes and cliffs, and shallow inlets with extensive mud and sand flats (DEECA 2024).

Prior to urban expansion, the area also had abundant

Victorian Bioregions Map (DEECA 2024) showing study area.
Before colonisation and urban development, our study area hosted bountiful Swampy Riparian Woodlands (EVC 83) (Yarra Ranges Council n.d.).
Grassy Woodlands (EVC 175) (Crisfield Landscape n.d.)

Data Visualisation

Assessing Ecology, Equity and Urban Growth in the City of Casey

Cross-Scale Analysis

Comparing Growth Corridors: Casey and Hume in Focus

Our site surrounding the Royal Botanic Gardens Cranbourne (RBGC) in the City of Casey, and Hume City Council in Melbourne’s North West, are both Growth Corridors experiencing Greenfield development.

The site surrounding the RBGC falls within the Victorian Planning Association’s (VPA) South East Growth Corridor Plan. Likewise, parts of Hume City Council form part of both the Sunbury Growth Corridor Plan and the North Growth Corridor Plan. These plans aim to guide the delivery of key housing, employment and transport infrastructure in Melbourne’s new suburbs and provide a clear strategy for the development of the growth corridors over the next 30 to 40 years (VPA 2012).

Similarly, both local government areas are part of the Victorian Government’s ‘10-year plan for Melbourne’s greenfields’, which sets out the state government’s commitment of achieving 30% of new homes delivered in greenfields areas. This plan provides the framework for industry to plan for 180,000 homes (DTP 2024).

As such, Hume City Council has been selected to provide a comparison to City of Casey, as a local government area geographically on the other side of Melbourne but undergoing similarly rapid development. Demographics of Casey and Hume will also be compared to Victoria as a whole, and the suburbs of Botanic Ridge and Junction Village which sit to the South of the RBGC and form our study area.

Botanic
Aerial shot of Craigieburn in Hume (Hume City Council n.d.).

Cross-Scale Analysis

The median age in the City of Casey is 34. Similarly, in Hume is it 33, and 32 in Botanic Ridge. These are all lower than the Victorian state median which is 38. The clear outlier here is Junction Village, where the median age is 54. This is most likely due to the Botanic Gardens Retirement Living Village, which is actually located in Junction Village.

The average household size in the City of Casey and in Hume is 3.1, and is 3.2 in Botanic Ridge. These are both higher than the Victorian state average of 2.5. Unsurprisingly, the outlier again here is Junction Village at 2.2, reflecting the older demographic who likely live as couples with no children.

Botanic Ridge is a wealthy suburb, with the median household income being $2,552 per week. This is significantly higher than the Casey median which is $1,918 per week, and the medians for Hume and Victoria which are $1,759 and $1,703 per week. Once again, the outlier is Junction Village at $1,080 per week, reflecting the older, likely retired population who live in the retirement village. It is important to note here that income data is not necessarily a measure of wealth (Profile ID, 2021). These households may be on low incomes but may have large capital wealth.

Ultimately, these demographics tell us a story about the area we are studying. The City of Casey is a middle-class, middle-aged local government area with the highest population in Victoria but spread over a large geographic area, similar to Hume City Council. Botanic Ridge is a wealthier, younger, and family-oriented suburb. Finally, Junction Village is residents are on lower incomes and are much older, largely consisting of 1 to 2 person households.

$1-$149 ($1-$7,799)

$150-$299 ($7,800$15,599)

$300-$399 ($15,600$20,799)

$400-$499 ($20,800$25,999)

$500-$649 ($26,000$33,799)

$650-$799 ($33,800$41,599)

$800-$999 ($41,600$51,999)

$1,000-$1,249 ($52,000$64,999)

$1,250-$1,499 ($65,000$77,999)

$1,500-$1,749 ($78,000$90,999)

$1,750-$1,999 ($91,000$103,999)

$2,000-$2,999 ($104,000$155,999)

$3,000-$3,499 ($156,000$181,999)

$3,500 or more ($182,000 or more)

Long term health x Personal income in Casey

(expressed

LTHP Type of Long-term Health Condition

Evidence supports the close relationship between people’s health outcomes and their socioeconomic environment.

The National Strategic Framework for Chronic Conditions (DHDA 2017, p.6) notes that “various terminology is used to describe chronic health conditions, including ‘chronic diseases’, ‘noncommunicable diseases’, and ‘long-term health conditions’”. It encompasses a broad range of chronic and complex health conditions across the spectrum of illness, including mental illness, trauma, disability and genetic disorders. This broad definition is intended to move the focus away from a disease-specific approach.

The World Health Organisation (WHO) (2023) defines the social determinants of health as “the conditions in which people are born, grow, live, work and age, and people’s access to power, money and resources [which] have a powerful influence on health inequities”. At all income levels, health outcomes and illness follow a social gradient: those in lower socioeconomic positions tend to experience poorer health outcomes. Limited access to quality housing, education, social protection and job opportunities significantly increases the risk of illness and mortality. The WHO (2023) says that these social determinants can outweigh genetic influences or healthcare access in terms of influencing health.

At the international scale, there is a difference of 18 years of life expectancy between high- and low- income countries. This trend is extended all the way down to the micro-level in the City of Casey and can be seen in the heat map table to the left here. Higher outcomes of long-term health conditions seen in red are clustered around lower personal incomes. Of particular note are Arthritis, Diabetes and Mental Health conditions with particularly high proportions in the personal income bracket of under $41,600 a year.

Only 5.21% of

or more each year high-income earners on have a Mental Health Condition $182,000

Long term health x Personal income in Casey

(expressed as a percentage of the total number of people in each income bracket)

Long-term Health Condition

This alternative representation of the previous heat map table supports the close relationship between people’s health outcomes and their socioeconomic environment.

This chart shows that chronic health conditions peak in the personal income bracket of $400-499 per week (or $20,800-25,999 per year). This income range falls under the Australian Tax Office’s (ATO 2025) lowest taxable income bracket of $18,201-$45,000 for the 2020-21 financial year.

The rate of health conditions tend to decline after $1000 per week (or $52,000 a year), falling under the middle income bracket of $45,001$120,000 for the 2020-21 financial year.

Thus, it can be concluded that in Casey, lower-income residents are more likely to suffer from long-term health conditions than their wealthier neighbours.

Heart disease

Kidney disease

Lung condition

Mental health condition Stroke

each year low-income earners on have Arthritis $15,600$25,999 38.15% of

Long term health x Level of education in Casey

(expressed

LTHP Type of Long-term Health Condition

Lower-educated residents experience higher rates of chronic health problems

Educational attainment is another social determinant of health which is commonly used to measure socioeconomic position.

Research supports that adults with higher educational attainment have better health and lifespans compared to their less-educated peers (Raghupathi & Raghupathi 2020). This trend is evident in the heat map table to the left where higher rates of chronic health conditions are clustered at the top around lower education levels.

For example, smoking is a leading preventable cause of chronic disease and death in Australia. Using National Health Survey Data 2014-15, the Department of Education (2019) found that the likelihood of people never smoking significantly increased with educational attainment:

Moreover, regular physical activity is important for the health and wellbeing of adults and results in a reduced risk of chronic disease. In 2014-15, the recommended amount of exercise was a minimum of 150 minutes over 5 sessions per week. The Department of Education (2019) found that the likelihood of meeting these recommended exercise guidelines significantly increases with higher educational attainment:

Proportion of 30-64 year olds who met exercise guidelines, by highest level of educational attainment, 2014-15 (Department of Education 2019).
Proportion of 30-64 year olds that have never smoked, by highest level of educational attainment, 2014-15 (Department of Education 2019).

Dwelling types over time

Dwelling Types in the City of Casey

Separate house

Other (semi-detached, row or terrace house, townhouse, flat, unit, or apartment)

Year

The above chart shows the changes in dwelling types over time in the City of Casey. Detached houses have remained the vast majority of housing typology since at least 2001, increasing rapidly after 2016. Other dwelling types, such as semi-detached, row or terrace houses, townhouses, flats, units, and apartments are increasing at a much slower rate and represent a significantly smaller portion of housing types in Casey.

Like income and education, environmental factors like housing and the built environment also play a major role in human health (AIHW 2024). However, limited research exists surrounding the effects of indoor housing conditions on human health, with much of the research focused on outdoor conditions. Understanding the indoor effects is crucial as it is estimated that in developed countries, people spend more than 90% of their time indoors (Palacios et al. 2021). Most of the literature on the health outcomes of indoor housing conditions are focused on issues such as the built structure or quality of houses, with a large gap in the research on housing typologies. One study by Gan et al. (2016) found that in the United States, compared with living in single family houses, apartment-living was associated with better respiratory health outcomes.

The vast majority of houses in the City of Casey are detached, single-family homes.

The built environment shapes health through housing.

The AIHW (2024) describes that the built environment is a determinant of health due to its ability to affect health outcomes through activity levels, access to nutritious food and clean water, the houses we live in, where we work, contact with nature and the spaces we have for social interactions. It also affects the air we breathe and the water we drink and shelters us from the weather. They note that access to housing that is affordable, sustainable and appropriate has a profound impact on people’s health and wellbeing: housing provides shelter, safety, security and privacy, enabling people to participate in the social, economic and community aspects of their lives.

The Dahlgren-Whitehead rainbow (left) is a model for determining health inequalities which maps the relationship between the individual, their environment, and health. Housing can be seen here as an environmental factor which influences health, in the bottom right corner.

Low-density, detached housing is the standard in Botanic Ridge (photo by Yann Tan 2025).
The main determinants of health. Source: Dahlgren & Whitehead 2021
One row of terrace houses in Botanic Ridge (photo by Yann Tan 2025).
Housing and the built environment play a major role in shaping human health.
Chart and graphics made by Ruby using Excel, Google Sheets and Illustrator (Source: ABS 2001, 2006, 2011, 2016 & 2021).

Junction Village residents experience significantly higher rates of chronic health conditions

The above chart was created by providing Co-Pilot with the number of long-term health conditions in Botanic Ridge and Junction Village and asking it to create a pyramid graph.

Long-term health in Botanic Ridge v Junction Village

I created a pyramid chart myself due to the inaccuracy and messiness of the Co-Pilotgenerated graph.

Unsurprisingly, Junction Village residents experience a significantly higher proportion of chronic health conditions, likely due older residents in the retirement village, with Arthritis, Mental Health conditions, Asthma and Dementia being the highest.

Chart made by CoPilot (Source: ABS 2021).
Chart made by Ruby using TableBuilder, Excel, Google Sheets and Illustrator (Source: ABS 2021).

Long-term health and access to public parks and recreation in Casey

Long Term Health Conditions in Casey

The most common chronic health conditions in Casey are Asthma, Mental Health conditions, Arthritis and Diabetes.

Public open space includes a variety of green and blue spaces in the urban environment such as parks, nature reserves, gardens, plazas, beaches and riverbanks that are accessible by the public. The AIHW (2024) recognises that they are important for recreation, enjoyment and social connection purposes, as well as enhancing the environmental quality of neighbourhoods and providing a cooling effect.

In 2021, data from the Australian Urban Observatory found that in all capital cities, only around half of dwellings were within 400m of a public open space 1.5 hectares or greater in size.

Furthermore, green space, which includes areas of public and private land that feature some form of vegetation, such as nature reserves, public parks, residential gardens and outdoor sporting facilities, have profound positive impacts on physical and mental health. Research in Australia has found an association between green space and health outcomes which indicate a three-fold increase in the likelihood of doing any moderate-vigorous physical activity if more than 95% of dwellings in the suburb were within 400m of a park (Mavoa et al. 2016). Moreover, access to a larger park within 1.6km of home increased the likelihood of recreational walking for 150 minutes or more in a week.

The City of Casey and Hume experience similar levels of long-term health conditions.

Casey residents experience higher levels of Asthma, Cancer, Mental Health conditions, whereas Hume residents experience higher levels of Arthritis, Diabetes, Heart Disease, Kidney Disease and Lung Conditions, but the variances are minimal.

Green spaces and tree canopy cover can mitigate long-term health conditions.

Green space, particularly tree canopy cover, has also been associated with a range of health benefits such as reduced cardiovascular disease and lower psychological distress (AIHW 2024). Given that green spaces can mitigate air pollution, regulate urban thermal comfort, create relaxing environments, improve cognitive functions, provide spaces for physical activities, and improve social ties, Zhang and Luo (2025) note that they play a crucial role in chronic disease prevention. Their research found that while green spaces do not exhibit significantly direct health benefits regarding overall chronic disease incidence rates, they are “notably effective in mitigating specific diseases such as dementia and diabetes, with street view greenness demonstrating the most prevalent health benefits among the three green space indicators”.

Chart made by Ruby using TableBuilder, Excel, Google Sheets and Illustrator (Source: ABS 2021).
Long-term health conditions in Casey vs Hume (Profile ID 2021), edited by Ruby using Illustrator.
Tree canopy cover map made by Ruby using QGIS (Source: ABS 2021, DEECA 2025).
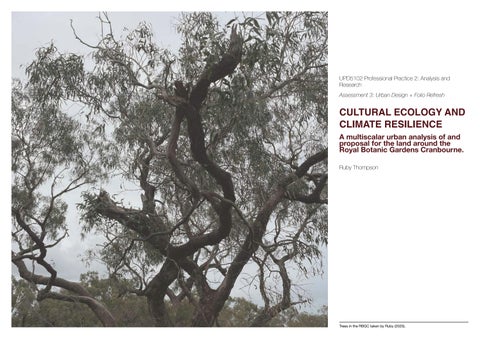
Trees in the RBGC taken by Ruby (2025).

Further investigation needed into relationship between health and access to parks in our study area

Proximity to Parks and Recreation

1:26,000

There are a large number of properties which are located outside of a 400m walking radius from parks and recreation reserves in our study area.

As examined earlier in Part 1, there is a large portion of land in the locality which is not within a walking distance from a green space. Proximity to green spaces has profound effects on land surface temperatures, socio-economic advantage and disadvantage, and health outcomes.

Mental Health Condition by SA1 (total number of responses)

1:26,000

No direct correlation can be determined between levels of mental health conditions and proximity to public parks and recreation in our study area.

Further investigation into the quality and size of green spaces, as well as comparisons to other areas and scales, may be needed to confidently conclude that residents in our study area who live closer to public parks experience lower rates mental health conditions.

Higher rates of mental health conditions in hotter areas

Metropolitan Melbourne Urban Heat Islands 2018 by Mesh Block 1:26,000

Earlier research in Parts 1 and 2 found that urban areas experience hotter land surface temperatures due to the Urban Heat Island (UHI) Effect.

As examined earlier, the City of Casey is the second hottest local government area in Metropolitan Melbourne. One of the major exacerbators for the UHI Effect is low-vegetated areas (Sun et al. 2019) away from native vegetation and open green spaces.

Mental Health Condition by SA1 (total number of responses) 1:26,000

There is a correlation between hotter land surface temperatures and Mental Health Conditions in our study area.

The above map shows higher rates of mental health conditions in Botanic Ridge to the south of the RBGC, as well as the wider Cranbourne area to the north of the Gardens. These areas are also some of the hottest places in Metropolitan Melbourne, seen on the map to the left. This correlation is corroborated by Tong et al. (2021) who state that the “effects of urban heat include increased mortality and morbidity from cardiopulmonary diseases, kidney disease, and mental illness”.

Similarly, further analysis at different scales and compared to different regions may be needed to confidently conclude this link, however it does appear that there are higher rates of mental health conditions in hotter areas at this local scale.

Income and access to green spaces in Casey

Total Personal Income in Casey

The City of Casey and Hume have similar weekly household incomes.

Number of people

The highest weekly personal income bracket in the City of Casey is $10001249 ($52,000-64,999 per year).

Research has shown that lower socioeconomic neighbourhoods are less likely to have green space availability, and hence fewer opportunities to use these spaces. Astell-Burt et al. (2014) found that in Australia, “green space availability was substantively lower in SA1s with a higher percentage of low income residents”.

Higher-income households live closer to goodquality parks and recreation.

Sharifi et al. (2021) have found that “access to green space is skewed towards more affluent neighborhoods” in Melbourne. They also found that the mobility of low-income populations is moving towards the lower green access neighbourhoods. Their results are “strongly suggestive of initiatives to control and reduce green space inequalities, but it is left to future study to more definitively identify these”.

Additionally, Zhang and Luo (2025) suggest that green spaces, particularly parkland, can help mitigate chronic health risks in lower socioeconomic areas, especially in regions with higher proportions of ageing populations. Their study found that ensuring sufficient parkland in lower socioeconomic areas is crucial, however it may lead to green gentrification. They suggest that local governments may consider integrating park development with affordable housing projects, and that public-private partnerships should be established to prevent green spaces from being disproportionately oriented toward advantaged populations.

Berwick North, one of Casey’s highest earning areas, is also one of its greenest (User kbsoon88 2017).
Chart made by Ruby using TableBuilder, Excel, Google Sheets and Illustrator (Source: ABS 2021).
Weekly household income in Casey vs Hume (Profile ID 2021), edited by Ruby with Illustrator.
Green Space Index in Metropolitan Melbourne by Statistical Area 2 (SA2) (Sharifi et al. 2021).
Casey residents earn slightly more than Hume residents but the differences are minimal.
Bushland in the RBGC taken by Ruby (2025).

Wealthier households live closer to higher tree percentages

Percentage of all Tree Types by Mesh Block

1:26,000

Our study area has an uneven distribution of tree coverage.

High Income Earners by SA1 (total number of responses)

1:26,000

Botanic Ridge has the largest number of high-income earners in our study area. It also borders the RBGC and a golf course which have a relatively higher tree coverage.

The data used is a combined percentage of all trees over 3m in height (Sun et al. 2019). Higher percentages of trees can be seen in the RBGC, the Settler’s Run Golf Course directly to the west of the gardens, and the larger lifestyle plots to the south west of the study region. Similarly, Botanic Ridge East is a newer development, so the data used may not reflect the current canopy in the area.

The above map supports the correlation between high-income earners and living closer to trees and vegetation. The area around the golf course, RBGC, and race course all have a comparatively higher percentage of tree coverage, and are home to the highest earners in the locality. This is supported by Astell-Burt et al. (2014), who found that green space availability was higher in SA1s with a higher percentage of high-income residents.

Likewise, further research and comparison to other localities at different scales may be needed to investigate the relationship between wealth and access to green spaces.

PART 3

Urban Design

Integrating Shade, Play, Housing, and Habitat in Botanic Ridge

Issues: Disconnected urban fabric, unshaded play & absent ecology

Aerial Map A3 @ 1:2500

Roads directly adjacent to the powerline easement.

No vegetation apart from nonnative lawn on the easement.

Concrete path running down the easement.

No shade over basketball court.

Tanbark, concrete, synthetic rubber flooring, and no shade covering playground.

Easement separated by road and multuple concrete paths.

Low-density, detached, one to two storey housing which consume the majority of the lot availability.

Map made by Ruby using QGIS (VicMap 2025, NearMap 2025).
Local base map showing study area.
Tiny backyards with little room for native planting.
Wide road next to the park with no pedestrian or active transport infrastructure. Fence creating separation from public and private space.
Car-centric housing typologies which are unresponsive to the local context.

Issues: Disconnected urban fabric, unshaded play & absent ecology

The City of Casey has had a historically low tree canopy cover, which was measured at only 11.3% in 2018 (Casey 2024). This is considerably lower than the average Melbourne LGA which records 19.26% canopy cover.

The cumulative effects of low tree canopy and climate change is a hotter, drier urban landscape, known as the Urban Heat Island effect, which was explored in Parts 1 and 2.

Station Creek Way Park in the centre of the study area consists of a basketball court, skate park, BMX path, and playground, all of which are unshaded and completely exposed to the elements. A study of surface temperatures of sun-exposed playground equipment and floor materials by Pfautsch et al. (2022) in Sydney found that surfaces were “frequently well above contact burn thresholds for skin, even with very short contact times of just a few seconds”, with some dark surfaces reaching up to 88.0°C on hot days.

With regard to floor materials, the Station Creek Way park consists of synthetic rubber, concrete and tanbark. The study also found, measured on a 43°C day, that black rubber had the highest mean surface temperature of 72.6°C, followed by dark-coloured rubber, synthetic turf, natural dry turf, bark mulch, light-coloured rubber, brick, and concrete. By far the coolest surface found was that of natural green turf, which had a mean surface temperature of 35.8°C which was always similar to ambient air temperature.

The powerline easement has been identified as a potential linkage for bandicoots and other wildlife in multiple reports, including the Sub-regional Species Strategy for the Southern Brown Bandicoot 2014, the Botanic Ridge Development Plan 2016, and the City of Casey Biolinks Plan 2025 (Draft). The ideal habitat for bandicoots consists of tussocky grasses and shrubs, where they can hide from predators and make nests close to the ground (RBGV n.d.).

Objective 2.2 of the Botanic Ridge Development Plan (Casey 2016) outlines “the establishment and planting of indigenous vegetation to create wildlife linkages in conjunction with… the power-line easement”. Yet, a decade on, the area remains a 120m wide easement of non-native lawn.

On top of this, the easement is bordered either side by streets, has a concrete footpath running north/ south through it, and is intersected by multiple roads. This is particularly problematic given the context of native wildlife roadkill deaths in Victoria, which rose 24% between 2022-23 (Wildlife Victoria, n.d.).

The typical housing typology in Botanic Ridge is car-centric and low-density, with dwellings which take up the vast majority of lot space, and are ultimately unresponsive to the local environment and wildlife. Botanic Ridge is expected to see a 176.9% population increase between 2021 and 2046 (Forecast ID 2025), yet 95.6% of dwellings are detached houses (ABS 2021). Not only is this typology unsuitable for the suburb’s forecasted population growth, but it is not integrated into the local environment, with wide roads and no pedestrian or active transport infrastructure separating the playground from the housing.

Moreover, these large dwellings leave little space for native planting to support local wildlife and to mitigate the effects of the urban heat island. In fact, the City of Casey has identified that residential land, which makes up almost a third of Casey’s land area, has only an 18.9% urban forest cover and 11.8% tree canopy cover (Casey 2024).

Tanbark, concrete, synthetic rubber flooring, and no shade covering playground or basketball court (Botanic Ridge, n.d.).
Concrete path and road cutting through powerline easement, along with no native vegetation or shade (taken by Ruby, 2025).
Typical low-density, detached housing which consume the majority of the lot space (photo by Yann Tan, 2025).
Urban Heat Island Map at the local scale showing study area made by Ruby using QGIS (Source: DataVIc 2019).

Issues: Disconnected urban fabric, unshaded play & absent ecology

Map A3 @ 1:600

The private and public realms are isolated from each other, separated by wide roads and fences; the

Concrete path and road cutting through powerline easement, along with no native vegetation or shade (taken by Ruby, 2025).

Issues: Disconnected urban fabric, unshaded play & absent ecology

Opportunities: Integrating shade, play, housing & habitat

Imagine if we could...

Close and retrofit roads directly adjacent to the powerline easement.

Revegetate the easement.

Aerial Map A3 @ 1:2500

Create a bush path on the edge of the easement.

Provide shade over basketball court.

Install natural green turf under the playground with a shade on top.

Remove vehicular access from roads which cut through.

cars from the typical housing typology.

Remove fences to better integrate public and private space.

Install pedestrian and active transport infrastructure on roads, particularly those near parks and habitats.

Build medium-density housing to free up lot availability.

planting on private property.

Mandate native
De-centre
Map made by Ruby using QGIS (VicMap 2025, NearMap 2025).
Local base map showing study area.

Opportunities and Proposal: Integrating shade, play, housing & habitat

A transformed park with shade and trees, alongside boulders for risky play, to provide a cooler environment and connect neighbours.

Pfautsch et al. (2022) make two overarching recommendations for application in their study: “provide shade over the entire play area with consideration given to changes in daily and seasonal sun angles to ensure adequate cover when needed”; and “choose floor surface materials to minimise heat absorption and radiation to reduce surface temperatures”. They note that trees and other natural vegetation can also form an integral part of a shade provision strategy, and will additionally provide further cooling of ambient air temperature.

In line with these recommendations, my proposal features three large, leaf-like shades over the playground, along with another over the basketball court. The shades are inspired by the existing shade over the barbecue area, and are intended to be light-weight and open-air.

My proposal is inspired by the open-air sails of the Wangun Amphitheatre on Gunaikurnai Country, by Gunaikurnai Land and Waters Aboriginal Corporation (GLaWAC), Nikhila Madabhushi, and Robert Lees. Named after the Gunaikurnai word for boomerang, the amphitheatre features a roof design inspired by this concept, and the structure’s five sails symbolise the five Gunaikurnai clans. The design was shaped through a highly participatory process involving cultural exchanges on Country with Traditional Custodians and GLaWAC staff to ensure culturally sensitive placemaking. The open-air performance space features a roof and stage structure inspired by the Wangun form, with projection art illuminating the roof at night and natural light animating it by day, creating a dynamic canvas for cultural storytelling across seasons and festivities (Equity Office 2024).

Another concept for shading the park is inspired by the House in the Hills by Sean Godsell in Barrabool. The house is shaded by a 900m2 parasol, a light metal structure covered with wooden louvers, which provides protection against wind and deflecting it, while simultaneously giving shade and direct natural light, depending on the time of day and year (Cosentino, n.d.).

Alongside native tree planting, both of these precedents provide opportunities for shade, while still bringing in natural light to avoid dark, closed-off spaces. Perhaps once the surrounding trees grow to a mature height with a thicker canopy, the sails could be relocated to another new park in the area.

Moreover, challenge, adventure, and risky play have repeatedly been found to be learning environments that positively shape childhood well-being and development (Eager et al., 2025). To facilitate this, my project includes elements from ‘Rocks on Wheels’, which is a boulder risk-play park in Southbank by Mike Hewson. The park contains 24 massive rough-hewn bluestone boulders on furniture dolleys, with slides, swings, monkey bars, ropes, and a linear sandpit connecting the spaces in and around the boulders (Bickersteth 2023).

The new boulder playground will be accompanied by replacing the existing synthetic rubber flooring with natural green turf to further reduce playground surface temperatures.

This new playground with shade aims to provide a cool environment for children to engage in risky play, simultaneously bringing the community together to connect and socialise.

Wangun Amphitheatre, Gunaikurnai Country by GLaWAC, Nikhila Madabhushi & Robert Lees (Equity Office, 2024).
House in the Hills, Barrabool by Sean Godsell (Carter, 2018). ‘Rocks on Wheels’, Southbank by Mike Hewson (Bickersteth, 2023).

Opportunities and Proposal: Integrating shade, play, housing & habitat

A revegetated powerline easement and housing which responds to the natural environment, to extend wildlife habitats into local surroundings and improve housing diversity.

Key Direction 2 of the Implementation Plan for the Southern Brown Bandicoot Sub-Regional Species Strategy 2016 is to “create bandicoot friendly suburbs in Botanic Ridge and Devon Meadows”. The strategy outlines that this will involve the mitigation of roadkill by building culverts under roads, establishing large vegetated median strips, and initiating speed-limit reductions and abatement devices. Additionally, habitat connectivity corridors will be established to enable movement from the RBGC into neighbouring suburbs. This will be achieved through revegetation and landscaping the “public open space corridor running south from RBGC to Brown’s Rd and the power line easement in Botanic Ridge Stage 1”.

Additionally, Key Direction 4 of the strategy is to “create a habitat connectivity network” which would involve the acquisition of parcels of land which provide habitat and/or key connectivity between habitat areas.

In line with these recommendations, my proposal features a revegetated powerline easement to provide connectivity for wildlife, as well as the acquisition of private land to extend this habitat and build medium-density housing.

To revegetate the powerline easement, inspiration is sought from the restoration of the Merri Creek and adjacent powerline. A collaborative project led by the Merri Creek Management Committeee, in conjunction with Friends of Merri Creek, Melbourne Water, and adjoining local councils, restoration began in the 1970s by removing invasive weeds and replacing them with tubestock grown from locally collected seeds and cuttings of native grasses, wildflowers, shrubs and trees (Bush 2024). This was ultimately a grassroots, community-led project which transformed the once weed-infested, polluted and threatened creek into the flourishing biodiversity network that it is today, just meters away from a powerline easement.

While not next to a creek, my proposal aims to similarly revegetate the powerline easement by planting lowlying shrubs and grasses native to the Gippland Plain Bioregion, such as Kangaroo Grass and Tussock Grass (DSE 2004), to a provide safe and protected connection for bandicoots and other wildlife.

My proposal to acquire properties which are in close proximity to the easement and playground is inspired by two projects by Six Degrees Architects: Heller St Park & Residences, a former tip remediated and transformed into 10 dwellings which stand side by side, with each of the private terraces expanding without clear borders into the public realm (Six Degrees, 2011); and Clyde Mews, which saw the sustainable subdivision of two suburban blocks into an ‘eco-village’ featuring eight 1-, 2- and 3-bedroom townhouses and apartments (Excelon 2018).

Both of these projects prioritise family-centric, community-focussed, and environmentally considered medium-density housing. Clyde Mews was designed with passive design principals, maximising the site’s orientation to provide sustainable and comfortable residences. Vehicle parking is consolidated at the site’s edges to maximise space for communal gardens and shared outdoor areas. Refurbished and recycled materials were used throughout the construction (Excelon 2018).

Finally, new medium density housing will also be inspired by the ‘Terraces 04’ by Other Architects x NMBW as part of the NSW Housing Pattern Book. The design consists of 3 homes arranged side-byside made up of 3 buildings: one at the street, one at the centre and one at the rear of the site. Outdoor areas between each building provide light, air and a green outlook to each home (Government Architect NSW, 2025).

All three of these medium-density typologies allow for more space to be dedicated to native vegetation, providing an opportunity to blur the lines between private residences, wildlife habitats, and the public realm. Additionally, higher densities will provide more housing and diversity to the suburb which is expected to see a major increase in population over the next few decades, and shared amenities will bring neighbours together. These changes would also be accompanied by pedestrian and active transport infrastructure by de-centring cars from their design.

Revegetation along Merri Creek powerline easement in Brunswick East by Merri Creek Management Committee (taken by Ruby, 2025).
Clyde Mews, Thornbury by Six Degrees Architects (Hutchison, 2018).
Illustrative street view of Terraces 04, NSW by Other Architects & NMBW (NSW Housing Pattern Book, 2025).

Proposal: Integrating shade, play, housing & habitat

The removal of boundaries between the public realm, private residences, and wildlife habitats, highlights their fluid and interconnected relationship; while shade over recreational spaces provides climate refuges and welcoming gathering spaces. Ecology and wildlife are central, with native vegetation spanning the entire easement, and in abundance on private

Testing the proposed urban form

The built form elements in my proposal were created and tested by overlaying precedent projects to scale in Illustrator, then tracing over them. This process ensured that I was not arbitrarily drawing lines on a map, but grounding my design decisions in real-world spatial relationships, proportions, and contextual evidence drawn from Australian examples.

Aerial shot of Heller St Park & Residences (Source: NearMap 2025).
Aerial shot of Clyde Mews (Source: NearMap 2025).
Ground floor floor plan for Terraces 04 (Source: NSW Housing Pattern Book, 2025)

Proposal: Integrating shade, play, housing & habitat

Proposed Conditions Cross-Section A3 @ 1:200

Proposed conditions map showing cross-section slice.

Proposal: Integrating shade, play, housing & habitat

Proposed Conditions Cross-Section A3 @ 1:200

A reimagined Station Creek Way Playground with sails and trees for shade, boulders for risky play, bike lanes to encourage active transport, and housing which provides higher densities and more space for nature.

This drawing shows a transformed playground with a large, open-air sail and natural green turf to provide shade and a cooler environment to support children’s development and wellbeing. Boulders with slides, ropes and ladders inspire adventurous play, encouraging more time spent outdoors, in-turn bringing neighbours together. Hayloft Way is revamped with painted bike lanes to support cyclists, and WSUD initiatives like rain gardens on either side to improve permeability and stormwater management, as well as the overall aesthetic of the street.

Generous building setbacks of 3.5m will support native planting and biodiversity on private property, while the two-storey building heights still fit in with the neighbourhood character of the area. Townhouses and apartments will share communal facilities like gardens to maximise space and promote socialisation, while still having personal balconies for privacy.

Cross-section made by Ruby using Illustrator.

Clyde Mews, Thornbury by Six Degrees Architects (Hutchison 2018).
Wangun Amphitheatre, Gunaikurnai Country by GLaWAC, Nikhila Madabhushi & Robert Lees (Equity Office, 2024).
‘Rocks on Wheels’, Southbank by Mike Hewson (Mamma Knows Melbourne, 2023).

Bringing the plans to life: Exploring three-dimensions

Before After

Driveways take up the majority of the front yard creating a sense of isolation and hostility.

No pedestrian infrastructure across from the park is unsafe for children.

No active transport infrastructure means people rely on cars.

Before and after renderings made by Ruby using SketchUp.

Bringing the plans to life: Exploring three-dimensions

Before After

Fences and roads create barriers between public realm and private residences.

Before and after renderings made by Ruby using SketchUp.
Low-density and car-centric housing leaves little room for native planting.
Minimal trees to provide shade and refuge from the heat

Endnotes

Bibliography

Astell-Burt, T, Feng, X, Mavoa, S Badland, H.M. & Giles-Corti, B (2014) ‘Do low-income neighbourhoods have the least green space? A cross-sectional study of Australia’s most populous cities’, BMC Public Health, vol. 14, no. 292 https://doi. org/10.1186/1471-2458-14-292.

Australian Bureau of Statistics (ABS) (2018) ‘IRSAD’, 2033.0.55.001 - Census of Population and Housing: SocioEconomic Indexes for Areas (SEIFA), Australia, 2016, accessed 11 November 2025, https://www.abs.gov.au/ausstats/ abs@.nsf/Lookup/by%20Subject/2033.0.55.001~2016~Main%20Features~IRSAD~20.

Australian Institute of Health and Welfare (AIHW) (2024), ‘What are determinants of health?’, Australian Government, accessed 28 September 2025, https://www.aihw.gov.au/reports/australias-health/what-are-determinants-of-health.

Australian Institute of Health and Welfare (AIHW) (2024), ‘Built environment and health’, Australian Government, accessed 28 September 2025, https://www.aihw.gov.au/reports/australias-health/built-environment-and-health.

Australian Taxation Office (ATO) (2025), ‘Tax rates – Australian resident’, Australian Government, accessed 26 September 2025, https://www.ato.gov.au/tax-rates-and-codes/tax-rates-australian-residents.

AVEO (n.d.) ‘Botanic Gardens Retirement Living’, Retirement Villages, accessed 8 September 2025, https://www.aveo. com.au/retirement-villages/vic/melbourne/botanic-gardens/#collage-gallery.

Balance Enviro (2018) ‘Koo Wee Rup Wetlands: Thriving Solutions for Wetland Creation and Management’, Balance Enviro, accessed 11 November 2025, https://balanceenviro.com.au/project/koo-wee-rup-wetlands/.

Bickersteth, P (2023) ‘Mike Hewson installs giant boulders on wheels for “risk play” space in Melbourne’, Dezeen, accessed 4 November 2025, https://www.dezeen.com/2023/01/04/mike-hewson-rocks-on-wheels-bouldersmelbourne/.

Botanic Ridge (n.d.) ‘The Original Story’, Botanic Ridge, accessed 28 August 2025, https://botanicridge.com.au/lifestyle/.

Browning, M, et al. (2024) ‘Measuring the 3-30-300 rule to help cities meet nature access thresholds’, Science of The Total Environment, vol. 907, https://doi.org/10.1016/j.scitotenv.2023.167739.

Bush, J (2024) ‘Making merry: how we brought Melbourne’s Merri Creek back from pollution, neglect and weeds’, The Conversation, accessed 5 November 2025, https://theconversation.com/making-merry-how-we-brought-melbournesmerri-creek-back-from-pollution-neglect-and-weeds-226231.

Carter, E (2018) ‘House in the Hills, Barrabool’, Arquitectura Viva, accessed 5 November 2025, https://arquitecturaviva. com/works/house-in-the-hills.

City of Casey (Casey) (2016) Botanic Ridge Development Plan, version 3, accessed 4 November 2025, https://www. casey.vic.gov.au/sites/default/files-public/user-files/Property%20%26%20planning/Planning%20services/Growth%20 areas/Docs/Botanic-Ridge-Development-Plan_Version-3%20(3).pdf.

City of Casey (Casey) (2024) GREENING CASEY: A plan for building our climate resilience and creating places people love, accessed 3 November 2025, https://hdp-au-prod-app-csy-conversations-files.s3.ap-southeast-2.amazonaws. com/9017/2229/4692/21782_COC_Greening_Casey_final_1.pdf.

Cosentino (n.d.) ‘House in the Hills’, Cosentino, accessed 5 November 2025, https://www.cosentino.com/en-au/blog/ house-in-the-hills/.

Crisfield Landscape (n.d.) ‘Indigenous Design: A pre 1750s EVC mapping applied to a backyard in Melbourne’, Crisfield Landscape, accessed 11 November 2025, https://crisfieldlandscape.com.au/indigenous-design-a-pre-1750s-evcmapping-applied-to-a-backyard-in-melbourne/.

Dahlgren, G & Whitehead, M (2021) ‘The Dahlgren-Whitehead model of health determinants: 30 years on and still chasing rainbows- external site opens in new window’, Public Health, vol. 199, https://doi.org/10.1016/j.puhe.2021.08.00900333506/.

Department of Climate Change, Energy, the Environment and Water (DCCEEW) (2021) ‘Climate Change’, Australia: State of the Environment, accessed 3 November 2025, https://soe.dcceew.gov.au/urban/pressures/climate-change.

Department of Energy, Environment and Climate Action (DEECA) (2022) ‘Healthy Country, Healthy Mob’, Central and Gippsland Region Sustainable Water Strategy 2022, https://www.water.vic.gov.au/__data/assets/pdf_file/0032/668471/ central-and-gippsland-region-sustainable-water-strategy-chapter-five.pdf.

Department of Energy, Environment and Climate Action (DEECA) (2024) ‘Bioregions and EVC benchmarks’, Victoria State Government, accessed 11 November 2025, https://www.environment.vic.gov.au/biodiversity/bioregions-and-evcbenchmarks.

Department of Environment, Land, Water and Planning (DELWP) (n.d.) ‘Land for Wildlife: Voluntary Wildlife Conservation’, Victoria State Government, https://www.wildlife.vic.gov.au/__data/assets/pdf_file/0036/692586/Land-for-WildlifeTechnical-Notes.pdf.

Department of Environment, Land, Water and Planning (DELWP) (2016) ‘Implementation Plan for the Southern Brown Bandicoot Sub-Regional Species Strategy’, Victoria State Government.

Department of Health, Disability and Ageing (DHDA) (2017) ‘National Strategic Framework for Chronic Conditions’, Australian Government, https://www.health.gov.au/resources/publications/national-strategic-framework-for-chronicconditions.

Department of Transport and Planning (DTP) (2023) ‘Cooling and greening Melbourne map’, Data, spatial and insights, accessed 11 November 2025, https://www.planning.vic.gov.au/guides-and-resources/Data-spatial-and-insights/coolingand-greening-melbourne-map.

Department of Transport and Planning (DTP) (2024) ‘A 10-year plan for Melbourne’s greenfields’, Victoria State Government, accessed 5 September 2025, https://www.planning.vic.gov.au/guides-and-resources/strategiesand-initiatives/housing/a-10-year-plan-for-melbournes-greenfields.

Dubecki, L (2021) ‘Berwick: The country-style suburb that has turned bougie’, Domain, accessed 11 November 2025, https://www.domain.com.au/news/berwick-the-country-style-suburb-that-has-turned-bougie-1041693/.

Eager, D, Gray, T, Little, H, Robbé, F & Sharwood, LN (2025) ‘Risky Play Is Not a Dirty Word: A Tool to Measure Benefit–Risk in Outdoor Playgrounds and Educational Settings’, International Journal of Environmental Research and Public Health, 22(940), https://doi.org/10.3390/ijerph22060940.

Engage Victoria (2025) ‘Sunshine Precinct’, Department of Transport and Planning, accessed 11 November 2025, https://engage.vic.gov.au/sunshine.

Equity Office (2024) ‘Wangun Amphitheatre’, Equity Office, accessed 5 November 2025, https://equity-office. com/projects/wangun-amphitheatre/.

Forecast ID (2025) ‘City of Casey’, .idcommunity, accessed 5 November 2025, https://forecast.id.com.au/ casey/population-summary.

Bibliography

Gan, W.Q., Sanderson, W.T., Browning, S.R. & Mannino, D.M. (2017) ‘Different types of housing and respiratory health outcomes’, Preventative Medicine Reports, vol. 7, https://doi.org/10.1016/j.pmedr.2017.05.018.

Goulburn Broken Catchment Management Authority (GBCMA) (n.d.) ‘Introduction to the Ecological Vegetation Class (EVC) Information’, EVCs, accessed 11 November 2025, https://www.gbcma.vic.gov.au/downloads/EVCs/ IntroductiontoEVCInformationSheets.pdf.

Greg (2011) ‘East Sherbrooke Forest Walk, Dandenongs Ranges’, Hiking Fiasco, accessed 10 November 2011, https:// hikingfiasco.com/2011/03/06/east-sherbrooke-forest-walk-dandenongs-ranges/.

Hume City Council (n.d.) ‘Hume Integrated Growth Area Plans’, Hume City Council, accessed 27 September 2025, https://www.hume.vic.gov.au/Building-and-Planning/Strategic-Planning/Strategic-Plans-and-Policies/Hume-IntegratedGrowth-Area-Plans.

Hutchison, A (2018) ‘Clyde Mews’, Excelon, accessed 5 November 2025, https://excelon.com.au/clyde-mews.

Intergovernmental Panel on Climate Change (IPCC) (2018) Special Report on Global Warming of 1.5 °C, accessed 3 November 2025, https://www.ipcc.ch/site/assets/uploads/sites/2/2019/06/SR15_Full_Report_High_Res.pdf.

Mamma Knows Melbourne (2025) ‘Boulder Risk-Play Park, Southbank’, accessed 5 November 2025, https:// mammaknowsmelbourne.com.au/playgrounds/boulder-risk-play-park-southbank.

Management (2019) ‘Melaeuca Spits at Cranbourne Gardens’, TripAdvisor, accessed 28 August 2025,https:// www.tripadvisor.com/Tourism-g552156-Cranbourne_City_of_Casey_Greater_Melbourne_Victoria-Vacations.html#/ media/552156/?albumid=101&type=0&category=101.

Mavoa S, Badland H, Learnihan V, Boruff B, Pettit C, Astell-Burt T, Feng X, Hooper P, Rachele J, Eagleson S, David S and Giles-Corti B (2016) ‘The Australian National Liveability Study’, The Australian Prevention Partnership Centre, accessed 28 September 2025, https://preventioncentre.org.au/resources/the-australian-national-liveability-study-final-report/.

Melbourne Water (2025) ‘Assessing opportunities for blue carbon ecosystems around Western Port’, Port Phillip & Western Port Regional Catchment Strategy, accessed 10 November 2025, https://portphillipwesternport.rcs.vic.gov.au/ prospectus/western-port-biosphere-blue-carbon/.

Melbourne Water (2025) ‘Marine Environments’, Port Phillip & Western Port Regional Catchment Strategy, accessed 11 November 2025, https://portphillipwesternport.rcs.vic.gov.au/themes/marine/.

Municipal Association of Victoria (2021) Habitat connectivity supplement for the Southern Brown Bandicoot, Government of Victoria, Melbourne, accessed 4 November 2025, https://www.msa.vic.gov.au/__data/assets/pdf_file/0019/620272/ habitat-connectivity-supplement-for-the-southern-brown-bandicoot.pdf.

My Junction (2021) ‘New Botanic Ridge Shopping Centre Due to Open Early 2022’, The Junction at Botanic Ridge, accessed 10 November 2025, https://myjunction.com.au/new-botanic-ridge-shopping-centre-due-to-open-early-2022/.

Palacios, J, Eichholtz, P, Kok, N & Aydin, E (2021) ‘The impact of housing conditions on health outcomes’, Real Estate Economics, vol. 49, no. 4, https://doi.org/10.1111/1540-6229.12317.

Pfautsch, S, Wujeska-Klause, A & Walters, J (2022) ‘Outdoor playgrounds and climate change: Importance of surface materials and shade to extend play time and prevent burn injuries’, Building and Environment, 223, https://doi. org/10.1016/j.buildenv.2022.109500.

Profile ID (2021) ‘City of Casey Household income’, Community Profile, accessed 28 September 2025, https://profile.

id.com.au/casey/household-income?BMID=260.

Profile ID (2021) ‘City of Casey Long term health conditions’, Community Profile, accessed 28 September 2025, https:// profile.id.com.au/casey/long-term-health?BMID=110.

Raghupathi, V & Raghupathi, W (2020) ‘The influence of education on health: an empirical assessment of OECD countries for the period 1995–2015’, Archives of Public Health, vol. 78, no. 20, https://doi.org/10.1186/s13690-020-00402-5.

Royal Botanic Gardens Victoria (RBGV) (n.d.) ‘Cranbourne Gardens’, Royal Botanic Gardens Victoria, accessed 11 November 2025, https://www.rbg.vic.gov.au/cranbourne-gardens/.

Royal Botanic Gardens Victoria (RBGV) (n.d.) ‘Meet the Southern Brown Bandicoot’, accessed 5 November 2025, https:// www.rbg.vic.gov.au/initiatives/southern-brown-bandicoot/bandicoot-brigade/all-about-southern-brown-bandicoots/.

Sefcik, J et al. (2019) ‘Perceptions of Nature and Access to Green Space in Four Urban Neighborhoods’, International Journal of Environmental Research and Public Health, vol. 16, no. 13, doi: 10.3390/ijerph16132313.

Sharifi, F, Nygaard, A, Stone, W.M. & Levin, (2021), ‘Accessing green space in Melbourne: Measuring inequity and household mobility’, Landscape and Urban Planning, vol. 207, https://doi.org/10.1016/j.landurbplan.2020.104004.

Sun, C, Hurley, J, Amati, M, Arundel, J, Saunders, A, Boruff, B & Caccetta, P (2019) ‘Urban Vegetation, Urban Heat Islands and Heat Vulnerability Assessment in Melbourne, 2018’, Clean Air and Urban Landscapes Hub, accessed 3 November 2025, https://www.planning.vic.gov.au/__data/assets/pdf_file/0032/655826/UHI-and-HVI2018_Report_ v1.pdf.

Tong et al. (2021) ‘Urban heat: an increasing threat to global health’, BMJ, no. 2467. doi:10.1136/bmj.n2467.

User kbsoon88 (2017), ‘Beautiful garden especially during autumn’, TripAdvisor, accessed 28 September 2025, https://www.tripadvisor.com.au/Attraction_Review-g552140-d7374454-Reviews-Wilson_Botanic_Park-Berwick_ City_of_Casey_Greater_Melbourne_Victoria.html#/media/7374454/?type=ALL_INCLUDING_RESTRICTED&albumid=160&category=-160.

Victorian Planning Authority (VPA) (2012) ‘Growth Corridor Plans’, VPA, accessed 5 September 2025, https://vpa.vic.gov. au/strategy-guidelines/strategy-guidelines-2/growth-corridor-plans.

Victorian Planning Authority (VPA) (2021) What is the Land Subject to Inundation Overlay (LSIO)?’, VPA, accessed 11 November 2025, https://vpa.vic.gov.au/faq/what-is-the-land-subject-to-inundation-overlay-lsio-2/.

World Health Organisation (WHO) (2023) ‘Social determinants of health’, WHO, accessed 28 September 2025, https:// www.who.int/health-topics/social-determinants-of-health#tab=tab_1.

Walker, E, et al. (2021) ‘Assessing challenges and opportunities for schools’ access to nature in England’, Urban Forestry & Urban Greening, vol. 61, https://doi.org/10.1016/j.ufug.2021.127097.

Yarra Ranges Council (n.d.) ‘30 Swamp Gum Swampy Riparian Woodland (EVC 83)’, Plant Communities, accessed 11 November 2025, https://www.yarraranges.vic.gov.au/PlantDirectory/Plant-Communities/30-Swamp-Gum-SwampyRiparian-Woodland-EVC-83.

Zhang, Y & Luo, F (2025) ‘ ‘How are green spaces associated with chronic disease incidence in Australia? Direct health benefits and interactive effects with socioeconomic status based on multiple green space indicators’, Sustainable Cities and Society, vol. 121, https://doi.org/10.1016/j.scs.2025.106229.

Statement of AI Use

Microsoft Co-Pilot (https://copilot.microsoft.com/) has been used for the editing and proofing of written text to enhance expression and to brainstorm headings and subheadings in this assignment. All AI-generated content was critically evaluated and modified to ensure that ideas remained my own.

Edge of urban development in Botanic Ridge (taken by Ruby, 2025).

Turn static files into dynamic content formats.

Create a flipbook
Professional Practice 2: Analysis and Research focused on Ecology by MADAUPD - Issuu