
3rd Quarter 2025

3rd Quarter 2025
Employment data for September which is usually available in late October for the 3rd quarter has been delayed indefinitely due to the government shutdown. Initially expected to be available upon the government’s return to work in mid-November, it is now expected to be released in mid-December, according to the Louisiana Workforce Commission. Therefore, without complete 3rd quarter data, this analysis is limited to using the latest available which is July and August.
• Employment in theAlexandria MSA in theAugust was 61,807, down slightly from 61,881 in July, while the unemployment rate in theAlexandria MSAinAugust was 4.0% compared to 4.3% statewide.
• InAugust 2025, the unemployment rate in theAlexandria MSAdeclined to 4.0%, falling below the statewide rate of 4.3%. This signals improving labor market conditions, likely supported by seasonal hiring and continued job growth across business services, retail, and health-related sectors.
• Employment in Natchitoches Parish inAugust was 13,423, up slightly from 13,405 in July. The unemployment rate in Natchitoches Parish was 5.9% inAugust (the latest available data), compared to 4.3% statewide.
• Initial unemployment claims across Louisiana declined in Q3 compared to Q2, while continued claims stabilized—a labor market signal that layoffs remain limited and displaced workers are re-entering employment more quickly. Overall, Q3 2025 reflects a steady and resilient regional employment environment heading into the final quarter of the year.

• Sales tax revenue inAlexandria declined 2% from Q2 and was 4% below the same quarter in 2024. Year-to-date collections remain 2% lower than 2024, indicating that despite a strong start earlier in the year, consumer spending in the city softened in Q3. Pineville experienced a 4% decrease in sales tax revenue over Q2; however, receipts were 8% higher year-over-year and 5% above 2024 year-to-date totals. Despite quarterly cooling, Pineville remains positive on both annual and cumulative trends, pointing to continued consumer strength and a solid retail environment.
• Rapides Parish posted a 1% quarterly decline, but revenue remained 4% higher year-over-year and 4% above 2024 year-todate. Like Pineville, Rapides shows stability even with a modest short-term slowdown, suggesting that consumer spending remains resilient at the parish level.
• Natchitoches saw its first pullback of the year, with sales tax revenue decreasing 4% from Q2. Still, collections were 6% higher than Q3 2024, and 8% higher year-to-date, signaling that the Q3 dip follows unusually strong gains earlier in the year. Local spending remains well above prior-year levels.
• Vehicle sales tax activity was mixed across the region in Q3. Rapides Parish saw a 1% monthly decline but remained 11% above last year. Across most parishes, year-over-year gains suggest consumer demand for durable goods remains solid, even as monthly volatility continues.
• Remote Sellers Tax collections, which capture online retail activity, continued to demonstrate steady consumer demand across Central Louisiana. In Q3 2025, online sales tax revenue increased 4% compared to Q2 and remained 6% higher than the same quarter in 2024. Year-to-date, collections are up 18%, indicating consistent growth in e-commerce throughout 2025.
• Hotel occupancy tax collections across Central Louisiana were mixed in Q3 2025, reflecting a slower travel season following strong gains earlier in the year. Natchitoches Parish led regional performance with a 10% increase over Q2 and a 36% yearover-year gain, bringing year-to-date collections up 18%. This continued momentum indicates sustained tourism activity tied to festivals, campus-related travel, and heritage tourism.
• Avoyelles Parish saw a 8% quarterly decline and a 28% year-over-year decrease, with year-to-date hotel occupancy tax revenue down 7%. After a strong Q2 rebound, activity cooled sharply in late summer, suggesting fewer overnight stays or shifting visitor patterns.
• Rapides Parish also experienced a slowdown, with hotel tax revenue falling 8% from Q2, but still posting 19% year-over-year growth and 19% year-to-date gains. Despite a softer quarter, Rapides remains one of the region’s stronger performers for 2025 overall, pointing to continued strength in leisure and business travel.
• Vernon Parish reported the steepest decline, dropping 22% from Q2 and 18% year-over-year, resulting in a 7% year-to-date decrease. Travel in Vernon remains below 2024 levels.
• Overall, Q3 reflects a moderation in hotel activity across most of Central Louisiana following a strong spring season, with Natchitoches remaining the region’s primary growth center while other areas experienced seasonal cooling or reduced travel activity.
• As of October 30, 2025, the 30-year fixed mortgage rate stood at 6.17%, with the 15-year rate at 5.41%.Ayear ago, the 30-year rate stood at 6.72%..
• Alexandria (Rapides Parish):
Home Sales saw a significant increase of nearly 20% from Q2 to Q3 (from 246.00 sales to 294.00 sales). The total number of Active Listings decreased by about 5% between Q2 and Q3. Median Sale Price slightly increased between quarters, with the YTD average settling at approximately $207K.
• Natchitoches:
The average Days on the Market dropped sharply from Q2 to Q3 (from 69.0 days to 47.67 days) which is a sign of strength. Active Listings decreased by nearly 10%. Natchitoches experienced a pullback in price in Q3, with the average Median Sale Price dropping from approximately $264K in Q2 to $255K in Q3. Home Sales totals remained relatively flat, decreasing slightly by 1.64%.
• Fort Polk South (Leesville area): This locale showed a dramatic increase in the average Days on the Market, rising from 35.0 days in Q2 to 75.33 days in Q3. BothActive Listings (up 6.65%) and Home Sales (up 13.33%) increased from Q2 to Q3. The Median Sale Price also saw an uptick of over $6,000 between Q2 and Q3, contributing to a YTD average of approximately $214K.
• Quarterly business applications in Louisiana were up 4% Year-over-Year (YoY) for Q3, though the Year-to-Date (YTD) change for Q3 showed a decrease of -3%. Business applications saw a 0.4% increase for Q3, compared to Q2. This data reflects business applications, which are seasonally adjusted, and not necessarily business formations.
• Rapides Parish established 86 new businesses in Q3. New businesses established in Q3 were up 6.2% from a year ago, and the Year-to-Date new business growth in Rapides is up 1.5% over 2024. The number of new businesses established in Rapides Parish saw a -10% change in Q3 compared to Q2
• The CENLAEconomic Dashboard has transitioned to a quarterly publication which will allow for a clearer narrative around economic trends, smoothing out short-term fluctuations and emphasizing sustained changes in employment, business growth, and consumer activity. However, in some instances data are reported monthly when complete quarterly data is not available.
• Employment data for September was not available at the time of publication and thus limited a quarter-over-quarter comparisons for some metrics.

Employed persons in the Alexandria MSA from 2020 – 2025.
▪ Employment in theAlexandria MSAin theAugust was 61,807, down slightly from 61,881 in July.
▪ The unemployment rate in the Alexandria MSAinAugust was 4.0%, compared to 4.3% statewide.
Source: Labor Market Statistics, Louisiana Workforce Commission. October 2025
Employed Persons in Alexandria, LA MSA 2020 - 2025
Employed persons in Natchitoches parish from 2020 – 2025.
▪ Employment in Natchitoches Parish in August was 13,423, up slightly from 13,405 in July.
▪ The unemployment rate in Natchitoches Parish was 5.9% inAugust (the latest available data), compared to 4.3% statewide.
Source: Labor Market Statistics, Louisiana Workforce Commission, October 2025
Employed Persons in Natchitoches 2020-2025
The table below shows August 2025 unemployment rate, labor force, and employment data for Metropolitan Statistical Areas in the state.
▪ Lafayette MSAhad the lowest metro area unemployment rate in the state inAugust at 3.7%.
▪ Alexandria remained third among the MSAs with an unemployment rate of 4.0% inAugust.
▪ Louisiana’s unemployment rate in August was 4.3%, unchanged from May.
Data Source: Labor Market Statistics, Louisiana Workforce Commission. October 31, 2025
The table below shows August 2025 unemployment rate, labor force, and employment data for central Louisiana parishes.
▪ InAugust 2025, the parishes in central Louisiana had an unemployment rate of 4.6%, which was above the state unemployment rate of 4.3%.
Data Source: Labor Market Statistics, Louisiana Workforce Commission. October 31, 2025
2025
Initial and continued unemployment claims in Louisiana from 2024 to 2025.
▪ Initial unemployment claims in Louisiana fell 19% in Q3, while continuing unemployment claims fell 16%.
▪ In Q3 2025, initial claims averaged 1,533 compared to 1,884 in Q2.
▪ In Q3 2025, continued claims averaged 9,138 compared to 10,888 in Q2.


Source: Louisiana Workforce Commission, October 31, 2025

Data Source: LED, Louisiana Military Economic Impact Analysis, June 2025.
An overview of sales, vehicle sales, and hotel occupancy taxes collected in the Q3 2025 with comparison data.
Notes: Quarterly sales tax revenue reflects the period in which taxes are collected, which is delayed a month. * Data represents the prior month. n/a = Not currently available
Data Source noted in detailed reports.
An overview of sales tax revenue collected in Ball and Woodworth from 2023 - 2025.
Sales tax revenue in Q3 over Q2 is unchanged in Ball and down 10% in Woodworth. On a year-to-date basis, sales tax revenue in 2025 is up 10% in Ball and 7% in Woodworth compared to the same period in 2024.
Note: Current tax revenue reflects sales activity in prior month.
Data Source: Rapides Parish Police Jury Treasurer’s Reports, October 2025.
(TR) Alexandria total sales tax revenue collected in the most recent quarter with previous quarter, year, and YTD comparisons.
(BR) Alexandria total monthly sales tax revenue from 2023 to present.
YoY -4%
Q3 YTD -2%
Note: Quarterly sales tax revenue reflects the period in which taxes are collected, which is delayed a month.
Data Source: Rapides Parish Police Jury Treasurer’s Reports, October 2025.
Avoyelles Parish total sales tax revenue collected in the most recent quarter with previous quarter, year, and yearto-date comparisons. Vehicle and hotel tax revenues are excluded.
Note: Quarterly sales tax revenue reflects the period in which taxes are collected, which is delayed a month.
Data Source: Avoyelles Parish School Board. October 2025.
Avoyelles Parish vehicle sales tax revenue collected in the most recent quarter with previous quarter, year, and year-to-date comparisons.
Note: Quarterly sales tax revenue reflects the period in which taxes are collected, which is delayed a month.
Data Source: Avoyelles Parish School Board. October 2025
Catahoula Parish total sales tax revenue collected in the most recent quarter with previous quarter, year, and year-to-date comparisons.
YTD
Note: Quarterly sales tax revenue reflects the period in which taxes are collected, which is delayed a month.
Data Source: Catahoula Parish Tax Administrator, October 2025
Concordia Parish total sales tax revenue collected in the most recent quarter with previous quarter, year, and year-to-date comparisons.
Note: Quarterly sales tax revenue reflects the period in which taxes are collected, which is delayed a month.
Data Source: Concordia Parish Tax Administrator. October 2025
Evangeline Parish total sales tax revenue collected in the most recent month with previous month, year and YTD comparisons.
Note: Current sales tax revenue reflects sales activity in prior month.
Data Source: Evangeline Parish Sales Tax Commissioner. October 2025
Evangeline Parish vehicle sales tax revenue collected in the most recent month with previous month, year and YTD comparisons.
Note: Current sales tax revenue reflects sales activity in prior month.
Data Source: Evangeline Parish Sales Tax Commissioner. October 2025
(TR) Grant sales tax revenue collected in the most recent quarter with previous quarter, year, and YTD comparisons.
(BR) Grant monthly sales tax revenue from 2023 to present.
4% Q3 YoY 6% Q3 YTD 5%
Note: Quarterly sales tax revenue reflects the period in which
Data Source: Grant Parish Sheriff’s Office, October 2025.
La Salle Parish total sales tax revenue collected in the most recent quarter with previous quarter, year, and year-to-date comparisons.
Q3 YTD -6%
Note: Quarterly sales tax revenue reflects the period in which taxes are collected, which is delayed a month.
Data Source: La Salle Parish Tax Administrator, October 2025
(TR) Natchitoches sales tax revenue collected in the most recent quarter with previous quarter, year, and YTD comparisons.
(BR) Natchitoches monthly sales tax revenue from 2023 to present.
-2% Q3 YoY 6% Q3 YTD 7%
Natchitoches Parish Sales Tax Revenue
Note: Quarterly sales tax revenue reflects the period in which taxes are collected, which is delayed a month.
Data Source: Natchitoches Parish Tax Commission, October 2025.
(TR) Natchitoches vehicle sales tax revenue collected with previous month, year, and YTD comparisons.
(BR) Natchitoches monthly vehicle sales tax revenue from 2023 to present.
Note: Current sales tax revenue reflects sales activity in the prior month.
Data Source: Natchitoches Parish Tax Commission, October 2025.
Vehicle Sales Tax Revenue
(TR) Pineville sales tax revenue collected in the most recent quarter with previous quarter, year, and YTD comparisons.
(BR) Pineville monthly sales tax revenue from 2023 to present.
-4% Q3 YoY 8% Q3 YTD 5%
Note: Quarterly sales tax revenue reflects the period in which taxes are collected, which is delayed a month.
Data Source: Rapides Parish Police Jury Treasurer’s Reports, October
(TR) Rapides Parish sales tax revenue collected in the most recent quarter with previous quarter, year, and YTD comparisons.
(BR) Rapides monthly sales tax revenue from 2023 to present.
-1% Q3 YoY 0% Q3 YTD 4%
Note: Quarterly sales tax revenue reflects the period in which taxes are collected, which is delayed a month.
Data Source: Rapides Parish Police Jury Treasurer’s Reports, October 2025.
Rapides Parish vehicle sales tax revenue collected in the most recent quarter with previous quarter, year, and YTD comparisons.
Note: Quarterly sales tax revenue reflects the period in which taxes are collected, which is delayed a month.
Data Source: Rapides Parish Police Jury Treasurer’s Reports, October 2025
St. Landry Parish sales tax revenue collected in the most recent quarter with previous month, year, and YTD comparisons.
Note: Quarterly sales tax revenue reflects the period in which taxes are collected, which is delayed a month.
Data Source: Tax revenue data from St. Landry Parish School Board. October 2025
St. Landry Parish vehicle sales tax revenue collected in the most recent quarter with previous quarter, year, and YTD comparisons.
Note: Quarterly sales tax revenue reflects the period in which taxes are collected, which is delayed a month.
Data Source: Tax revenue data from St. Landry Parish School Board. October 2025
Vernon Parish sales tax revenue collected in the most recent quarter with previous quarter, year, and year-to-date comparisons.
Note: Quarterly sales tax revenue reflects the period in which taxes are collected, which is delayed a month.
Data Source: Vernon Parish Sales Tax Department. October 2025.
Vernon Parish vehicle tax revenue collected in the most recent quarter with previous quarter, year, and year-to-date comparisons.
Note: Quarterly sales tax revenue reflects the period in which taxes are collected, which is delayed a month.
Data Source: Vernon Parish Sales Tax Department. October 2025.
Remote sellers tax revenue by parish by quarter, with quarter over quarter, and YTD comparisons.
Q3 2025 online sales tax collections in central Louisiana increased 2% over Q2 and 18% YTD.
Note: Quarterly sales tax revenue reflects the period in which taxes are collected, which is delayed a month.
Data Source: Louisiana Sales and Use Tax Commission for Remote Sellers.August 2020 – October 2025
Central Louisiana Economic Dashboard
30-Year Fixed Rate Mortgage Average in the United States from 2023 – 2025.
▪ On October 30, 2025 the 30year fixed mortgage rate was 6.17%, while the 15-year mortgage rate stood at 5.41%.
Data Source: Fed Reserve Economic Database, St. Louis Federal Reserve Bank, October 31, 2025
30 Yr Fixed Mortgage Rate 2023 - 2025
The graphic shows the median sales price of houses for Alexandria, Leesville, Natchitoches, and Opelousas over the past year.
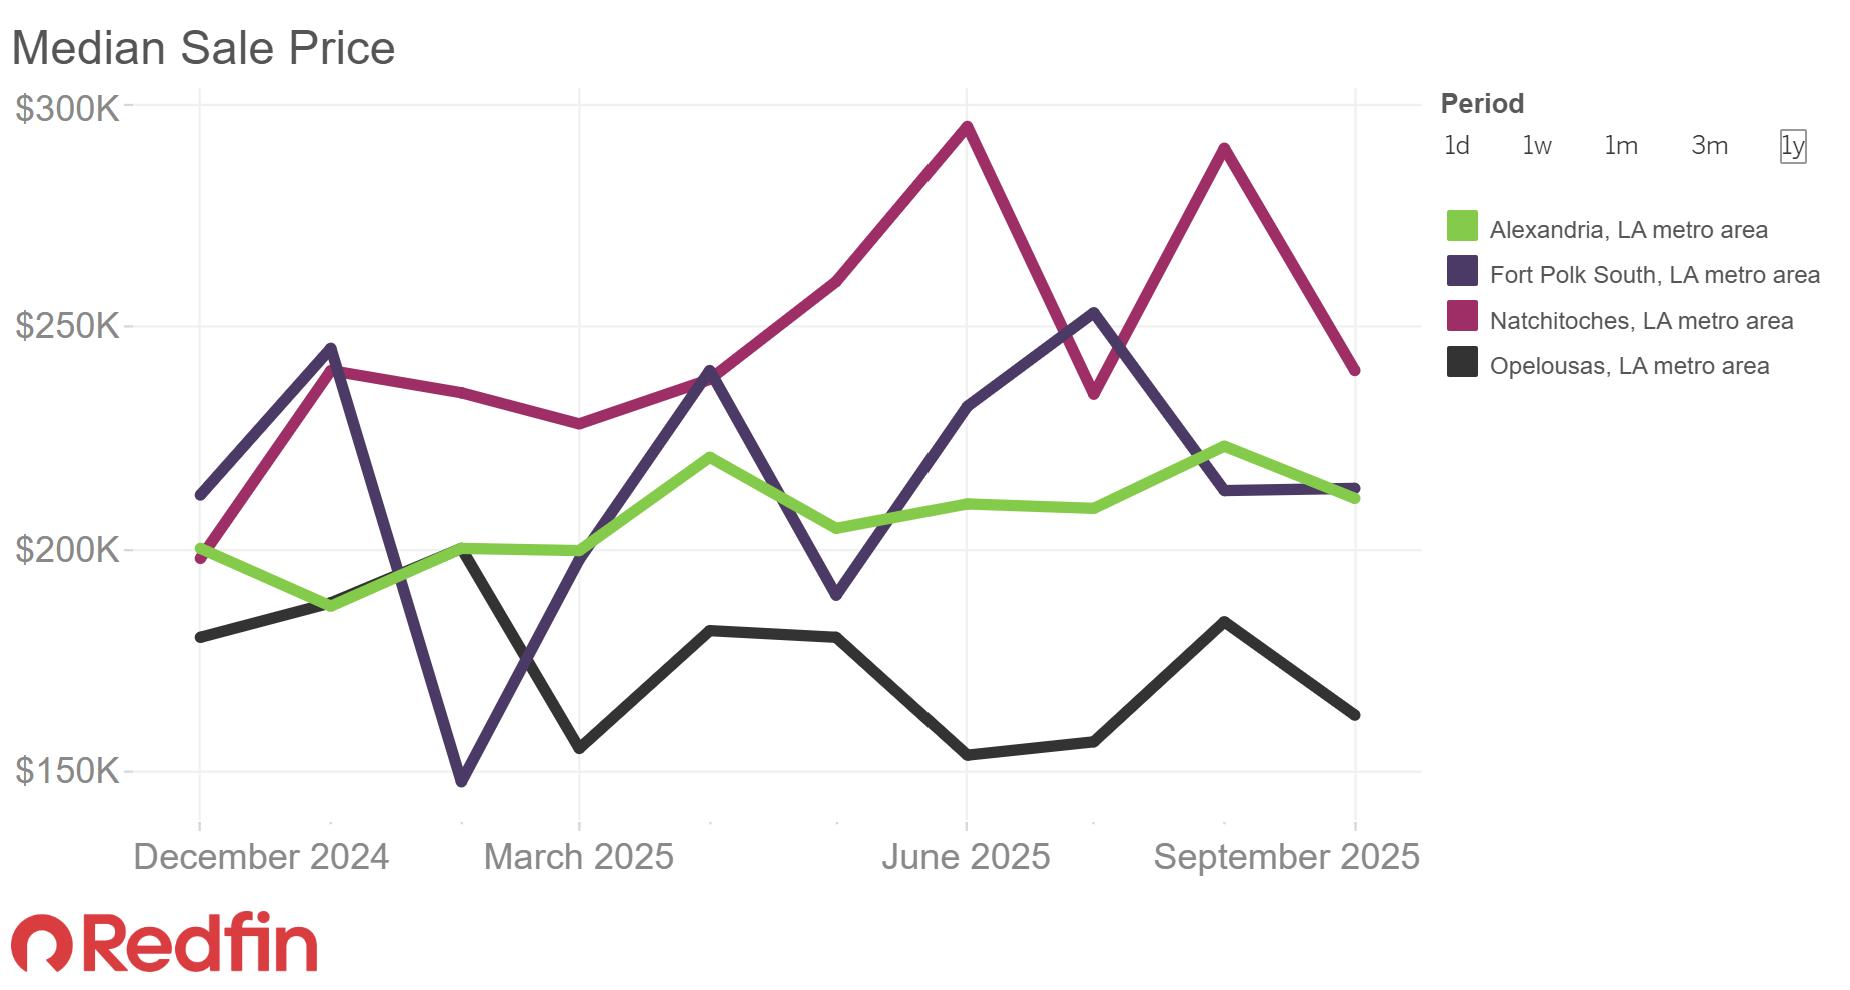
Data Source: Redfin. Retrieved October 31, 2025
The graphic shows the median sales price per square feet of houses for Alexandria, Leesville, Natchitoches, and Opelousas over the past year.
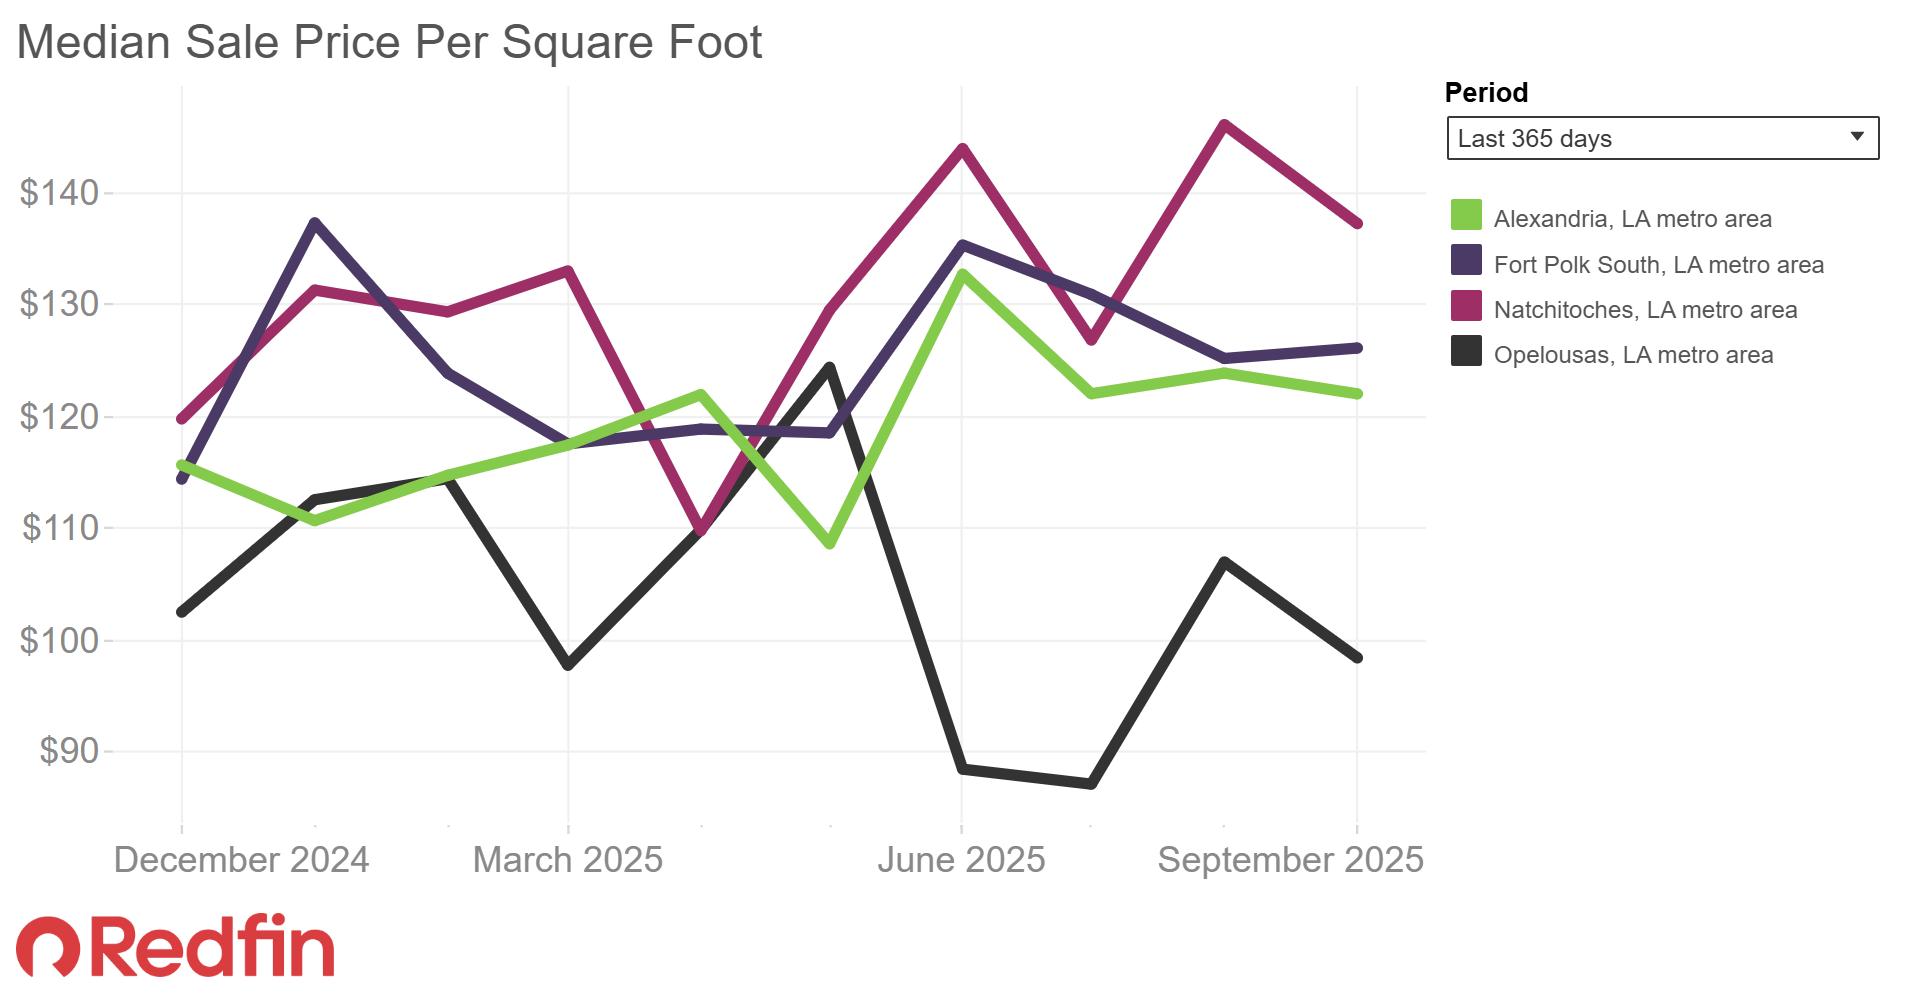
Data Source: Redfin.com. Retrieved October 31, 2025
The graphic shows the count of active single-family and condo/townhome listings for Alexandria, Leesville, Natchitoches, and Opelousas over the past year.
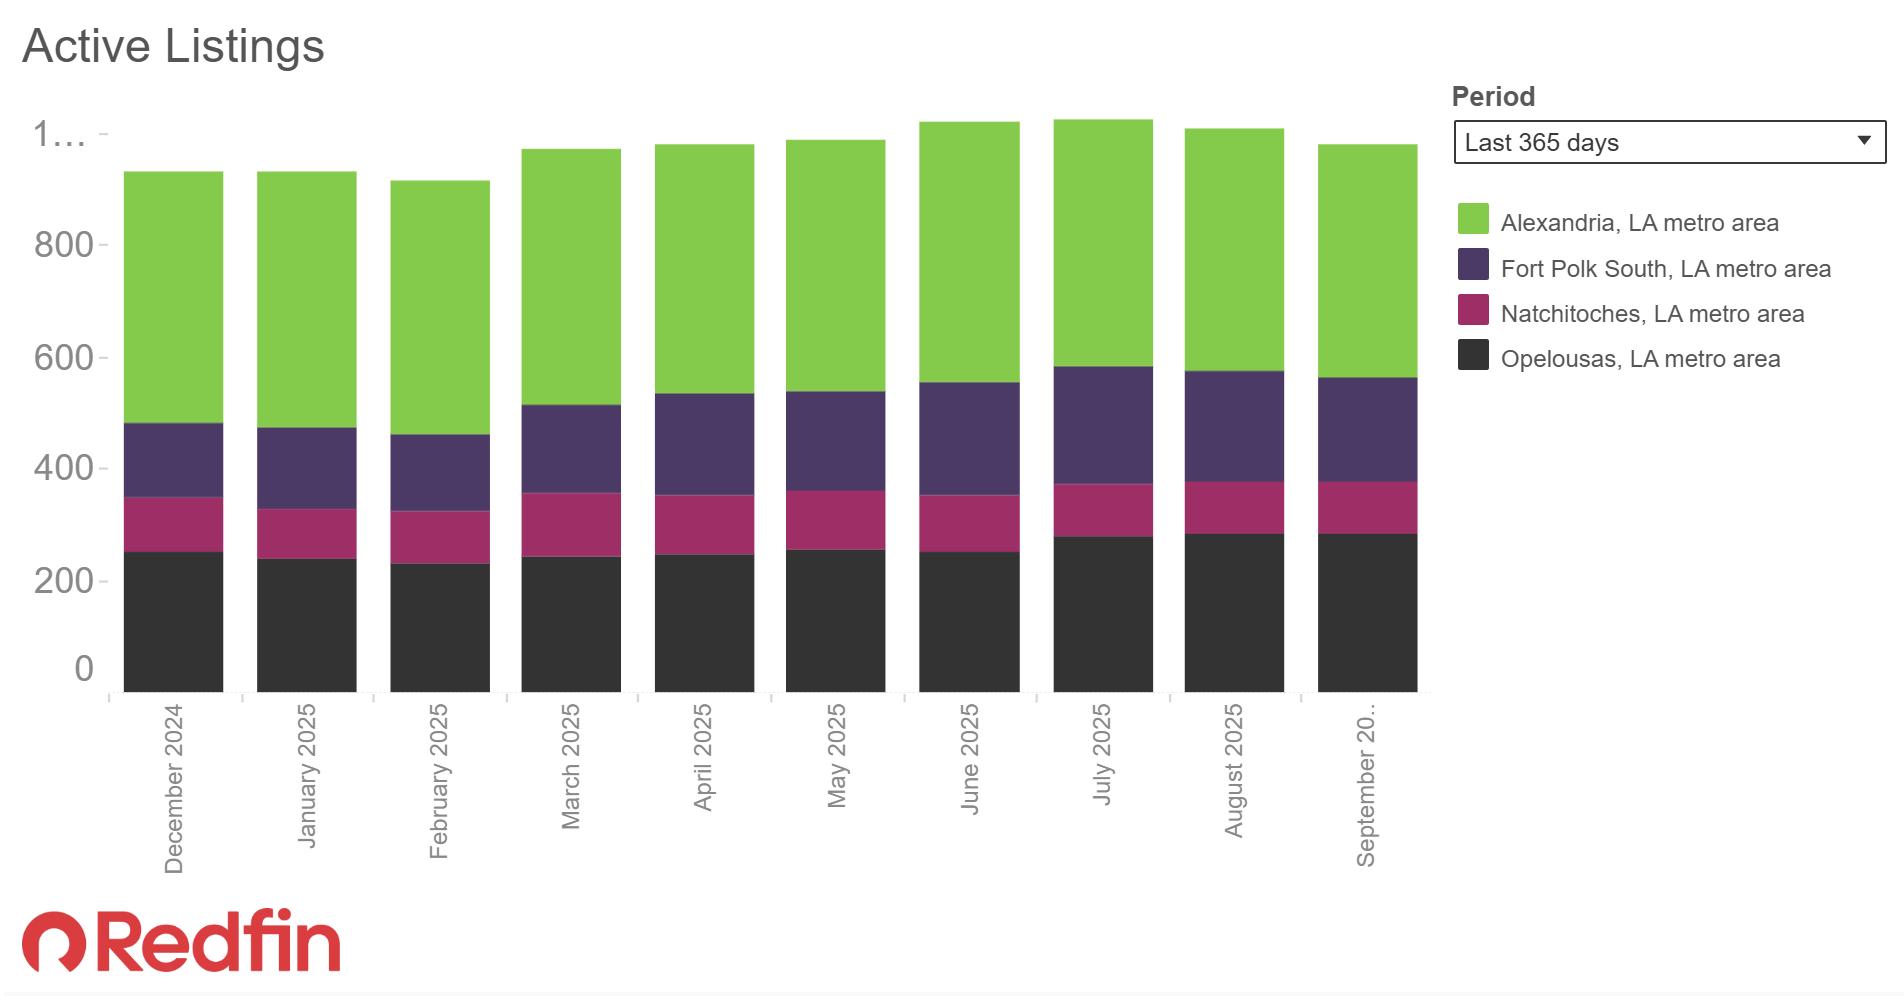
Data Source: Redfin.com. Retrieved October 31, 2025
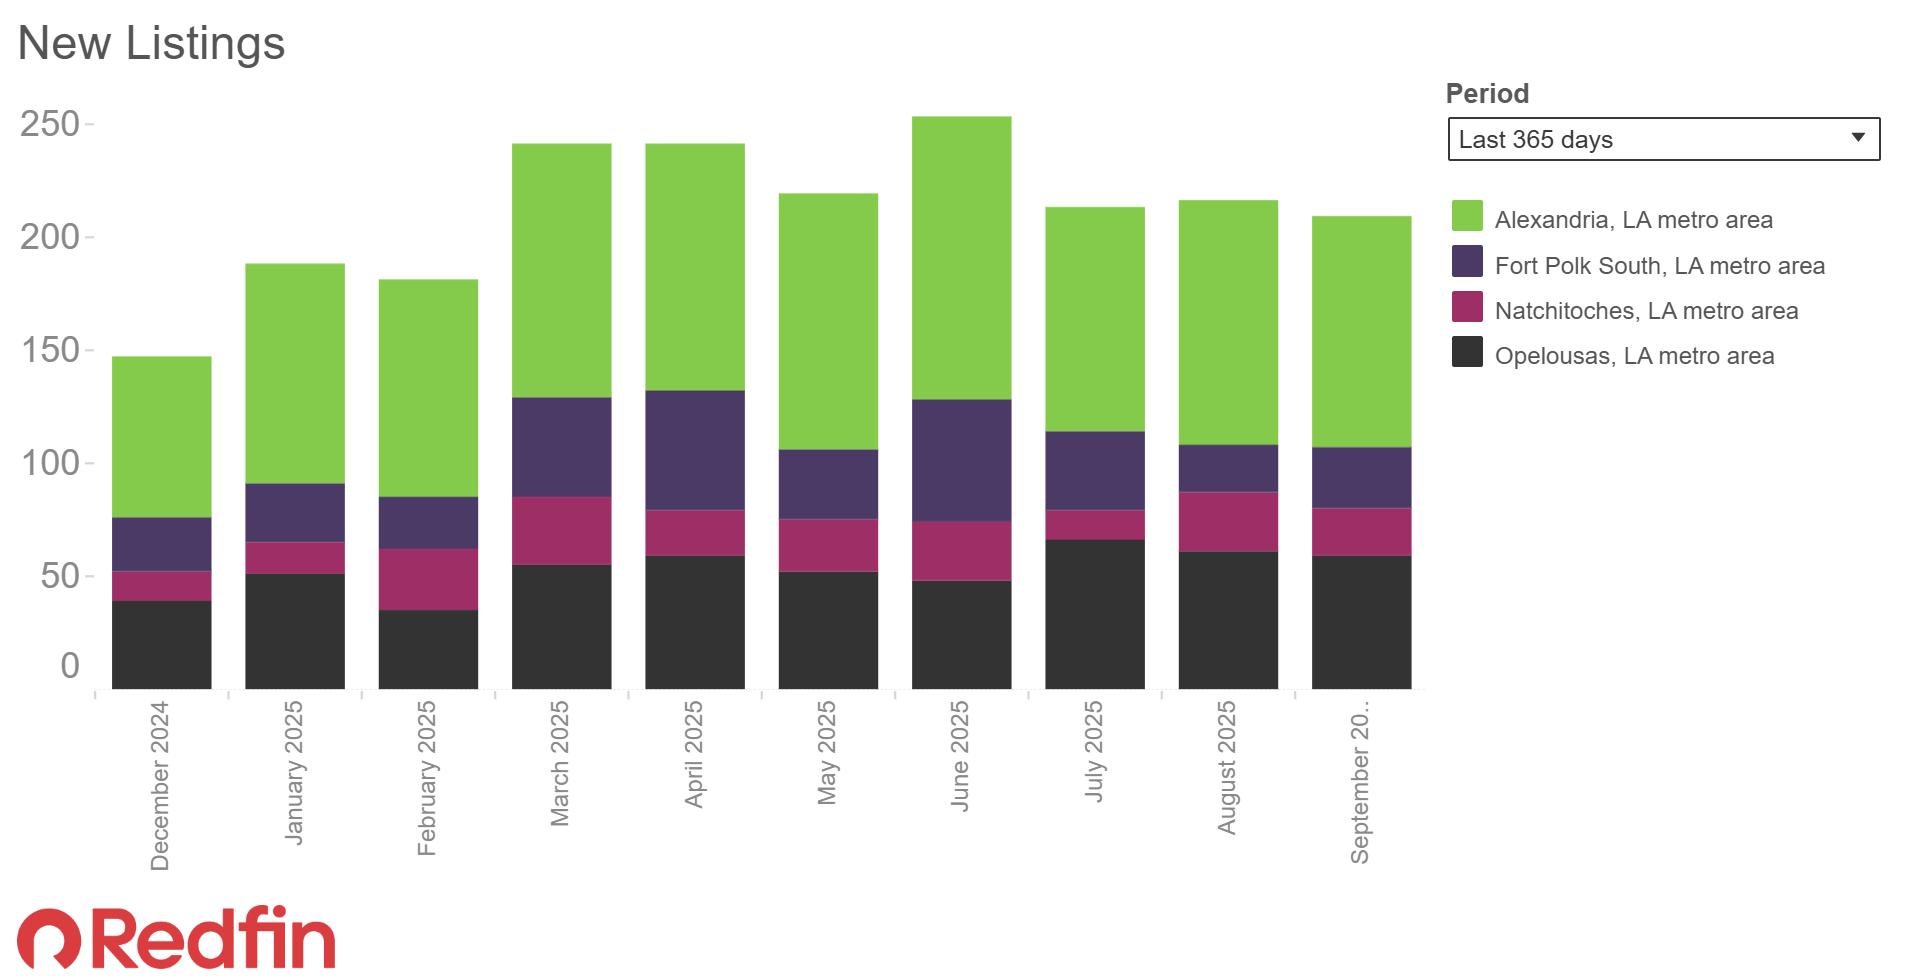
The graphic shows the number of new listings for Alexandria, Leesville, Natchitoches, and Opelousas over the past year. Data Source: Redfin.com. Retrieved October 31, 2025
The graphic shows the number of days property listings spend on the market for Alexandria, Leesville, Natchitoches, and Opelousas over the past year.
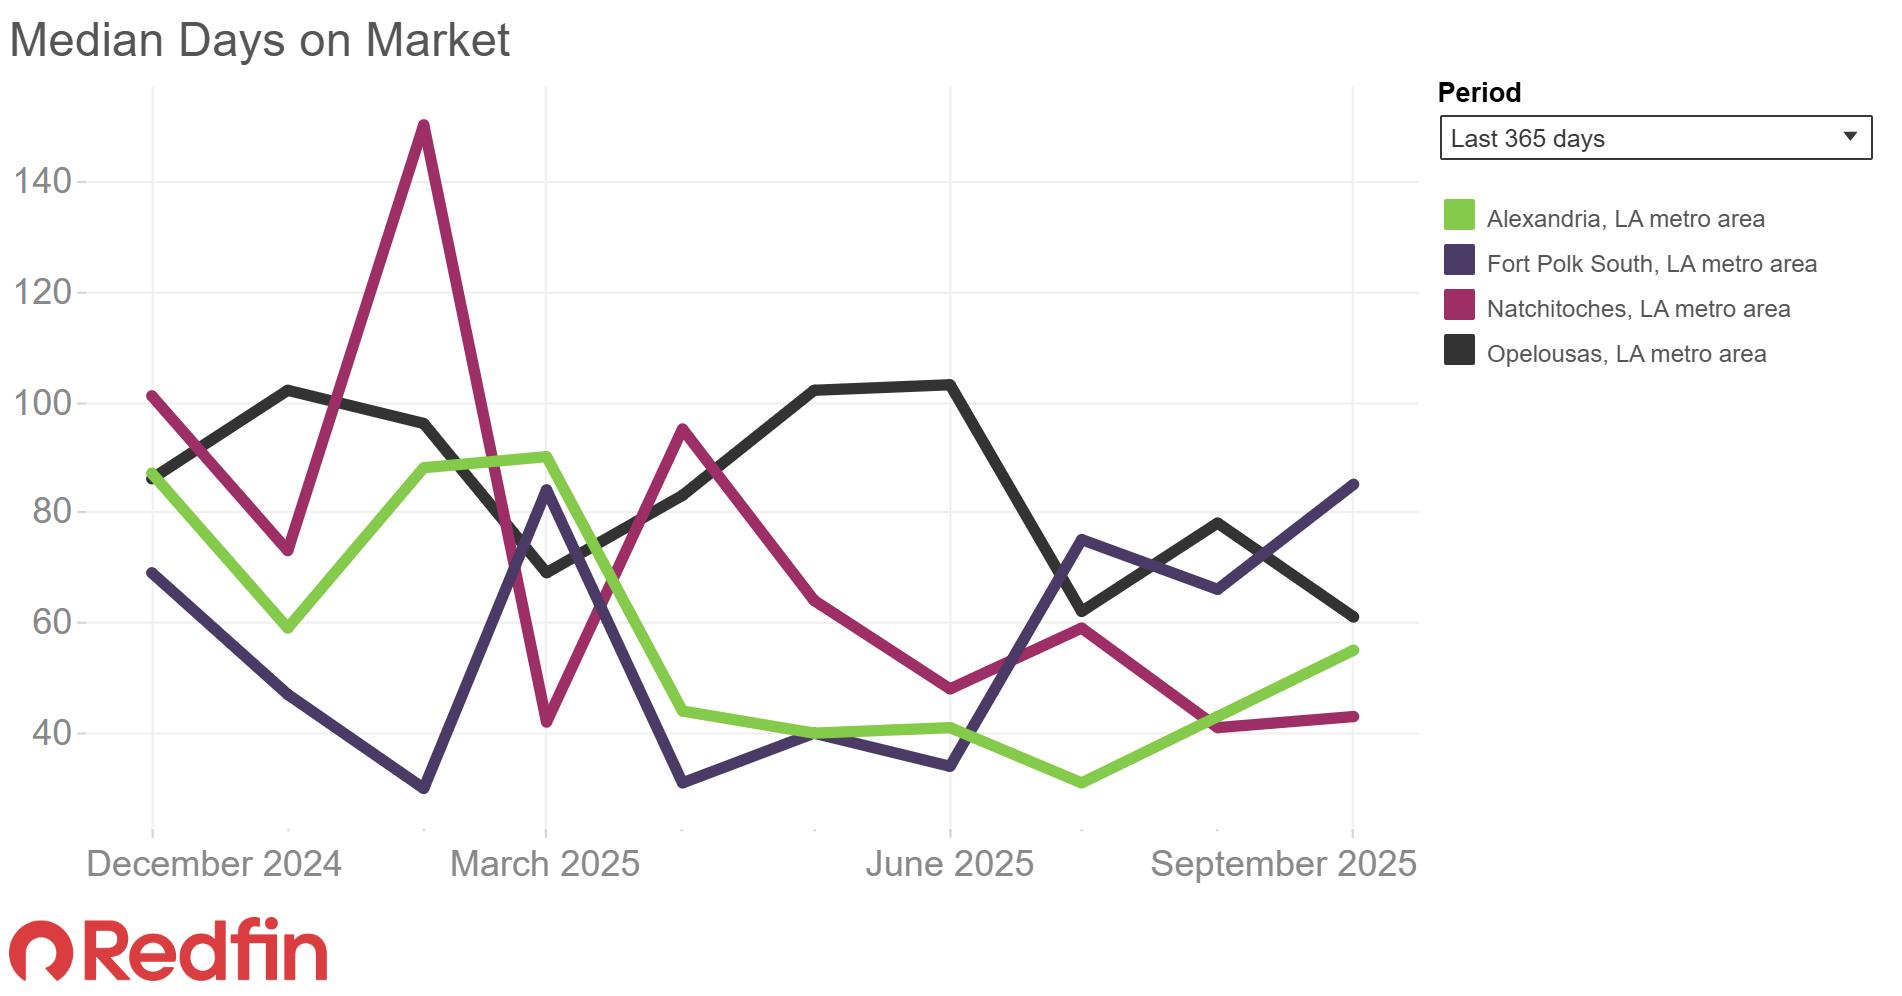
Data Source: Redfin.com. Retrieved October 31, 2025
Avoyelles Parish hotel occupancy tax revenue with previous quarter, year, and year-to-date comparisons.
Note: Quarterly sales tax revenue reflects the period in which taxes are collected, which is delayed a month.
Data Source: Avoyelles Parish School Board, October 2025.
Natchitoches Parish hotel occupancy tax revenue with previous quarter, year, and YTD comparisons.
Note: Quarterly sales tax revenue reflects the period in which taxes are collected, which is delayed a month.
Data Source: Natchitoches Parish Tax Administrator, October 2025.
Rapides Parish hotel occupancy tax revenue for the most recent quarter with previous quarter, year, and YTD comparisons.
Note: Quarterly sales tax revenue reflects the period in which taxes are collected, which is delayed a month.
Data Source: Rapides Parish Police Jury Treasurer’s Reports, October 2025.
Vernon Parish hotel, motel, and RV occupancy tax revenue with previous quarter, year, and year-to-date comparisons.
Note: Quarterly sales tax revenue reflects the period in which taxes are collected, which is delayed a month.
The chart below represents the number of new businesses applications in Louisiana from 2023-2025 by quarter (seasonally adjusted).
Note: Data reflects businesses applications, not necessarily business formations.
Data Source: U.S. Census Bureau, Business Applications: Total forAll NAICS in Louisiana, Retrieved October 31, 2025.
The chart below represent the number of new businesses established each month in Rapides from January 2023 through September 2025.
▪ 86 new businesses were established in Q3.
▪ New businesses established in Q3 were up 6% from a year ago. ▪ YTD, new business growth in Rapides is up 2% over 2024.
Note: Data reflects businesses established in the current quarter.
Data Source: Rapides Parish Sales and Use Tax Department, October 2025.
New Businesses in Rapides 2023-2025
The data presented throughout the CENLA Economic Dashboard reflects contributions from the following local organizations.
• Rapides Parish Policy Jury Treasurer
• Rapides Sales TaxAdministrator
• Avoyelles Parish School Board
• Alexandria International Airport
• Alexandria / Pineville Area CVB
• City ofAlexandria Planning Division
• Evangeline Parish Sales Tax Commissioner
• Concordia, Catahoula, & La Salle TaxAdministrator
• St. Landry Parish School Board
• Grant Parish Sheriff’s Office
• Natchitoches Parish Tax Commission
• Natchitoches Parish Planning and Zoning
• City of Natchitoches Planning
• Vernon Parish Sales Tax Department
Also, special thanks to the following partners for distributing the dashboard.
• LSUAFoundation
• Central Louisiana Regional Chamber of Commerce
• Marksville Chamber of Commerce
• Bunkie Chamber of Commerce
• Evangeline Chamber of Commerce
• Concordia Chamber of Commerce
• Greater Vernon Chamber of Commerce
• Natchitoches Chamber of Commerce
• Next Issue: Week of February 2, 2026
To subscribe to new releases, email rdupont@lsua.edu.
Current and past issues of the CENLAEconomic Dashboard can be found at https://www.lsua.edu/about-us/university-publications/cenlaeconomic-dashboard