SARASOTA Real Estate Report Third Quarter | 2024 Data based on Downtown Sarasota, West of Trail, Bird Key, Lido Key, and Longboat Key. All data compiled from Stellar MLS. Please contact LRMGroup@elliman.com for Sarasota County at-large trends or tailored market metrics.
Q3 2024 PRICE TRENDS YEAR-OVER-YEAR & LONG TERM Price reductions remained a factor in Q3, as in prior periods this year. The average price for August was the lowest of the quarter and the lowest of any month in our market since August 2021, a major reflection of the downshift in buyer activity this summer, and affluent home buying in particular. AVERAGE SALE PRICE BY MONTH - 5+ YEAR TREND
AVERAGE SALE PRICE BY MONTH - 2 YEAR TREND
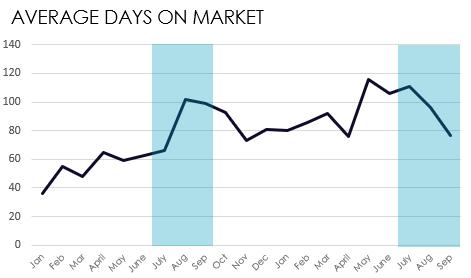
Q3 2024 The number of expired and withdrawn listings is a key figure that we are examining right now. As buyer activity waned significantly over the second and third quarters, the number of properties removed from the market spiked, clearly shown in the 2024 graph segment. These surges are a marked contrast to prior years when eager buyers absorbed nearly all inventory rapidly. We expect far fewer expirations and withdrawals in the fourth and first quarters, but sellers must regard the risk that overpricing in current market conditions will stagnate buyer interest and prolong days on market.
LONG-TERM TREND - EXPIRED AND WITHDRAWN LISTINGS
Average sale price for Q3 fell relative to the second quarter by 18 percent and relative to last year’s third quarter by 4.3 percent. This represents the lower buyer engagement during this year’s summer months. Because of higher performance in the first quarter, the average annual sale price year-to-date is 15 percent higher than last year’s despite the downtrend on the quarter. The graph at right offers a clear depiction of how significantly the early months of 2024 outperformed their prior year counterparts, and how markedly the trend shifted downward over the course of the year. Long-term, the average Q3 price has risen 56 percent in the last five years. AVG PRICE / SQ FT BY MONTH - 5+ YEAR TREND
AVG LIST & SALE PRICE BY MONTH - 2 YEAR TREND
Price per square foot fell by nearly 11 percent relative to the same point in time last year. One contributing factor is that the drop-off in activity during the summer months contributed to price negotiation; another is that homes in elevated price brackets represented a larger share of withdrawn listings.
The widened gap between the light blue background - average list price - and the dark blue bars - average sale price illustrates that, in general, listings have been overpriced for the current market. We expect this delta to narrow during the peak winter season as more buyers engage, and more high-end sales transact without the prolonged days on market of Q3.
Q3 NEW CONTRACTS - YEAR-OVER-YEAR ALL OF SARASOTA COUNTY
2024
2023
NOTE: this data reflects SF and townhome/condo transactions for the entirety of Sarasota County. Year-to-date, the number of new listings is on par with last year’s benchmark. While listings have remained on par, the number of closings and pending contracts have fallen. Year-over-year, the number of pending contracts dropped by 3.5 percent and the number of closings dropped by 8.5 percent.