COPYRIGHT © 2017 LOUGHS AGENCY OF THE FOYLE CARLINGFORD AND IRISH LIGHTS COMMISSION
LOUGHS AGENCY OF THE FOYLE CARLINGFORD AND IRISH LIGHTS COMMISSION
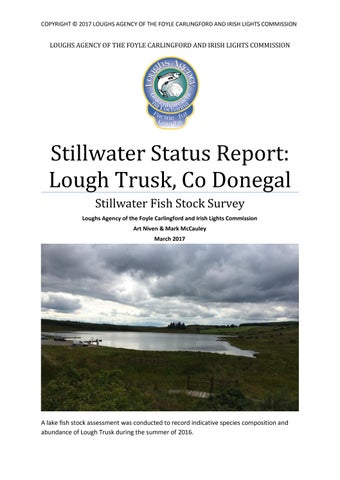
Stillwater Status Report: Lough Trusk, Co Donegal Stillwater Fish Stock Survey Loughs Agency of the Foyle Carlingford and Irish Lights Commission Art Niven & Mark McCauley March 2017
A lake fish stock assessment was conducted to record indicative species composition and abundance of Lough Trusk during the summer of 2016.
COPYRIGHT © 2017 LOUGHS AGENCY OF THE FOYLE CARLINGFORD AND IRISH LIGHTS COMMISSION
Headquarters 22, Victoria Road Derry~Londonderry BT47 2AB Northern Ireland Tel: +44(0)28 71 342100 Fax: +44(0)28 71 342720 general@loughs-agency.org www.loughs-agency.org
Regional Office Dundalk Street Carlingford Co Louth Republic of Ireland Tel+353(0)42 938 3888 Fax+353(0)42 938 3888 carlingford@loughs-agency.org www.loughs-agency.org
Report Reference LA/Lake/09/17 CITATION: Niven, A.J. & McCauley, M. (2017) Stillwater Status Report: Lough Trusk, County Donegal Loughs Agency, 22, Victoria Road, Derry~Londonderry Page 2 of 28
COPYRIGHT © 2017 LOUGHS AGENCY OF THE FOYLE CARLINGFORD AND IRISH LIGHTS COMMISSION
DOCUMENT CONTROL
Name of Document
Stillwater Status Report: Lough Trusk, Co Donegal
Author (s):
Art Niven & Mark McCauley
Authorised Officer:
John McCartney
Description of Content:
Stillwater Fish Stock Assessment
Approved by:
John McCartney
Date of Approval:
March 2017
Assigned review period:
5 Years
Date of next review:
March 2021
Document Code
LA/LAKE/09/17
This documents comprises
TOC
Text List of tables Table of Figures
X
X
X
No. Appendices
X
Version Control Table Version No. Version 1
Status Draft
Author (s) Art Niven M. McCauley
Reviewed by
Approved by
Date of issue
John McCartney
John McCartney
March 2017
Revision 2 Revision 3 Version 3
Page 3 of 28
COPYRIGHT © 2017 LOUGHS AGENCY OF THE FOYLE CARLINGFORD AND IRISH LIGHTS COMMISSION
TABLE OF CONTENTS
TABLE OF CONTENTS ......................................................................................... 4 ACKNOWLEDGEMENTS ...................................................................................... 6 PROJECT STAFF 2016.......................................................................................... 6 EXECUTIVE SUMMARY ....................................................................................... 7 1.0
INTRODUCTION ........................................................................................ 8 Fig 1. Stillwater Fish Survey being carried out on Lough Trusk, 2016. ........ 8
2.0
BATHYMETRY SURVEY .............................................................................. 8 Fig 3. Lough Trusk East with logged transects. ......................................... 10 Fig 4. Lough Trusk bathymetry map. ........................................................ 11
3.0 METHODS .................................................................................................. 13 Fig 5. Details of survey nets deployed on Lough Trusk. ............................ 13 Fig 6. Nets being prepared at Loughs Agency headquarters for survey on Lough Trusk. ............................................................................................. 13 Fig 7. Lough Trusk with 50m x 50m grid, bathymetry and randomly selected net locations. ........................................................................................... 14 Fig 8. Map of Lough Trusk detailing net locations and net type. .............. 15 4.0 RESULTS ..................................................................................................... 16 4.1 SPECIES RICHNESS .................................................................................. 16 Fig 9. Number of each species captured by each gear type during the survey of Lough Trusk.......................................................................................... 16 4.2 FISH ABUNDANCE................................................................................... 16 Fig 10. Mean (± S.E.) CPUE and BPUE for all fish species recorded on Lough Trusk, 2016. ............................................................................................. 16 Fig 11. Gill net being hauled on Lough Trusk, 2016. ................................. 17 Fig 12. Fyke net being hauled on Lough Trusk, 2016. ............................... 17 Fig 13. Mean (± S.E.) CPUE for all fish species captured in Lough Trusk 2016 (Eel CPUE based on Fyke nets only). ......................................................... 18 Page 4 of 28
COPYRIGHT © 2017 LOUGHS AGENCY OF THE FOYLE CARLINGFORD AND IRISH LIGHTS COMMISSION
Fig 14. Mean (± S.E.) BPUE for all fish species captured in Lough Trusk 2016 (Eel BPUE based on Fyke nets only).......................................................... 18 4.3 MINNOW STOCK DENSITY & POPULATION STRUCTURE ......................... 19 Fig 15. Length frequency Minnow, Lough Trusk 2016 (N=71). .................. 19 4.4 EEL STOCK DENSITY & POPULATION STRUCTURE ................................... 19 Fig 16. Mean CPUE for all Eels captured ................................................... 20 Fig 17. Mean BPUE for all Eels captured ................................................... 20 Fig 18. Eel mean length and mean weight comparison for lakes surveyed 2010 – 2016. ............................................................................................ 21 Fig 19. Length frequency Eel, Lough Trusk 2016 (N=31). .......................... 21 4.5 BROWN TROUT STOCK DENSITY & POPULATION STRUCTURE ................ 22 Fig 20. Mean CPUE for all Brown trout captured ...................................... 22 Fig 21. Mean BPUE for all Brown trout captured ...................................... 23 Fig 22. Length frequency Brown trout, Lough Trusk 2016 (N=48). ........... 23 4.6 FISH AGE AND GROWTH ......................................................................... 24 Fig 23. Growth curve showing back calculated length at age for Brown trout, Lough Trusk. ............................................................................................. 24 Fig 24. Comparitive growth curve showing back calculated length at age for Brown trout, Lough Muck (Donegal) 2012, Lough Nambraddan 2014 and Lough Trusk 2016. .................................................................................... 24 4.7 BROWN TROUT STOMACH ANALYSIS ..................................................... 25 Fig 25. Brown trout stomach analysis, Lough Trusk 2016. ........................ 25 5.0 DISCUSSION ............................................................................................... 25 6.0 INVASIVE SPECIES ....................................................................................... 26 7.0 BIOSECURITY .............................................................................................. 28 8.0 RECOMMENDATIONS ................................................................................. 28 9.0 REFERENCES ............................................................................................... 29
This document and its contents are copyright of the Loughs Agency ©2017 Page 5 of 28
COPYRIGHT © 2017 LOUGHS AGENCY OF THE FOYLE CARLINGFORD AND IRISH LIGHTS COMMISSION
ACKNOWLEDGEMENTS The Loughs Agency sponsoring departments, board and staff are gratefully acknowledged for the funding, support and assistance provided to conduct stillwater fish stock assessments and status reporting in the Foyle and Carlingford areas. Land owners and angling associations are also gratefully acknowledged for their co-operation. PROJECT STAFF 2016 Fisheries Biologist/Project Manager
Art Niven
Assistant Scientific Officer
Mark McCauley
GIS Manager
Rachel Scott
Fisheries Intern
Dineka Maguire
Fisheries Intern
Seanan Maguire
Fisheries Intern
Amy McCollum
For further information contact art.niven@loughs-agency.org
@ArtNiven
Loughs Agency TV
© LOUGHS AGENCY OF THE FOYLE CARLINGFORD AND IRISH LIGHTS COMMISSION 2017
Page 6 of 28
COPYRIGHT © 2017 LOUGHS AGENCY OF THE FOYLE CARLINGFORD AND IRISH LIGHTS COMMISSION
EXECUTIVE SUMMARY A Water Framework Directive compliant stillwater fish stock assessment was carried out on Lough Trusk in August 2016. The Loughs Agency commenced a small rolling programme of lake fish surveys in 2010 to gain a better understanding of fish composition and abundance of the standing waterbodies within the Foyle and Carlingford areas. The information collected can be used for many purposes ranging from formal Water Framework Directive classification, a baseline survey for use in the scrutiny of any future development proposals and for contributing towards the sustainable development of the angling amenity. Lough Trusk is situated approximately 4.5km south of Ballybofey, Co. Donegal. The lough is nestled in a picturesque area which is popular with walkers and is also used as a recreational resource for water based activities including jet skiing, model power boating and angling. No previous baseline fisheries scientific survey has been conducted and no accurate depth (bathymetry) data was available. In order to be able to follow the WFD survey methodology it was necessary to complete a bathymetric survey prior to the commencement of the lake fish survey. The 2016 fish stock assessment noted the presence of several fish species in Lough Trusk including Brown trout, European eel and Minnow with a total of 165 individual fish captured during the survey. Minnow (Phoxinus phoxinus) were the most common fish species encountered in the lough. This is the first lake survey report on Lough Trusk and provides a baseline survey of species and their relative abundance to fishery managers and anglers alike. It is anticipated that this survey report could significantly contribute towards any future sustainable development of angling initiatives, infrastructure or development plans for the lough by providing the basis for an evidence based approach to the fisheries management of the lough. If access to the Fish in Lakes 2 Water Framework Directive classification tool was available a WFD compliant classification could also be derived for Lough Trusk
Page 7 of 28
COPYRIGHT © 2017 LOUGHS AGENCY OF THE FOYLE CARLINGFORD AND IRISH LIGHTS COMMISSION
and provided to the Environmental Protection Agency for national reporting purposes. 1.0 INTRODUCTION Lough Trusk is located approximately 4.5km south of Ballybofey, in the Foyle catchment. The lake is located at an altitude of approximately 164 metres above sea level and its principal dimensions are; · Length: 600m long, maximum width 370 metres · Surface area: 15.2 hectares · Maximum depth: 9.4 metres
Fig 1. Stillwater Fish Survey being carried out on Lough Trusk, 2016.
2.0 BATHYMETRY SURVEY Prior to the lake fish survey being carried out it was essential to obtain accurate depth data for the lake. It is a prerequisite of any WFD compliant lake fish survey to have detailed bathymetry data, so that the survey can be carried out in accordance with the standard sampling methods for the assessment of ecological status in freshwater lakes across the island of Ireland (Eco-region 17). The area of the lake (ha) and the maximum depth are used to determine the distribution and number of gill nets required for the survey. A Midas Surveyor, Page 8 of 28
COPYRIGHT © 2017 LOUGHS AGENCY OF THE FOYLE CARLINGFORD AND IRISH LIGHTS COMMISSION
integrated echo sounder, GPS and data logger was used to collect raw depth data linked to geographical location. This logged data was then used to produce a lake bathymetric chart. The echo sounder transducer was secured to a pole which was then attached to the gunnel of the survey boat using a clamp. The transducer was positioned below the surface of the water with the GPS antennae attached to the top of the pole. Both were connected by cables to the echo sounder logging unit. The bathymetry survey consisted of covering transects of approximately 20m spacing across the lough. Depth and location were recorded at a resolution of three records per second. The raw data was downloaded from the echo sounder back in the office and imported into ArcMap 10. The data points were then extrapolated to produce an overall bathymetry map for Lough Trusk.
Fig 2. Echo sounder recording data points during the bathymetry survey of the lough
Page 9 of 28
COPYRIGHT © 2017 LOUGHS AGENCY OF THE FOYLE CARLINGFORD AND IRISH LIGHTS COMMISSION
Fig 3. Lough Trusk East with logged transects.
Page 10 of 28
COPYRIGHT © 2017 LOUGHS AGENCY OF THE FOYLE CARLINGFORD AND IRISH LIGHTS COMMISSION
Fig 4. Lough Trusk bathymetry map.
Page 11 of 28
COPYRIGHT © 2017 LOUGHS AGENCY OF THE FOYLE CARLINGFORD AND IRISH LIGHTS COMMISSION
3.0 METHODS Lough Trusk was surveyed over one night from the 1st of August 2016 according to the methodology described in the Water Framework Directive compliant NS Share Methods Manual for systematic surveying of lakes for fish (NSSHARE, 2008). A total of 11 nets were set as summarised in Figure 5 below. Net type Dutch fyke nets (3)
No. Deployed 3
Water depth (m) 0 – 2.9
Multi-mesh gill nets
2
0 – 2.9
Multi-mesh gill nets
2
3 – 5.9
Multi-mesh gill nets
2
6 – 11.9
Multi-mesh floating nets
2
6 – 11.9
Fig 5. Details of survey nets deployed on Lough Trusk.
Fig 6. Nets being prepared at Loughs Agency headquarters for survey on Lough Trusk.
Survey locations were chosen within randomly selected 50m X 50m grid squares overlaid on a bathymetric map of the lough (Figure 7). The location and depth of each net is also shown. A handheld Trimble Geo HT GPS was used to record the precise location of each net (Figure 8). Any fish which were alive and in good condition were measured and released live after removal from the nets, this included all eels. All other fish were removed from the nets and identified and measured at Loughs Agency headquarters. Page 13 of 28
COPYRIGHT © 2017 LOUGHS AGENCY OF THE FOYLE CARLINGFORD AND IRISH LIGHTS COMMISSION
Fig 7. Lough Trusk with 50m x 50m grid, bathymetry and randomly selected net locations.
Page 14 of 28
COPYRIGHT © 2017 LOUGHS AGENCY OF THE FOYLE CARLINGFORD AND IRISH LIGHTS COMMISSION
Fig 8. Map of Lough Trusk detailing net locations and net type.
Page 15 of 28
COPYRIGHT © 2017 LOUGHS AGENCY OF THE FOYLE CARLINGFORD AND IRISH LIGHTS COMMISSION
4.0 RESULTS 4.1 SPECIES RICHNESS A total of three fish species were recorded on Lough Trusk in August 2016 with a total of 165 fish captured during the survey. A list of species encountered and captured by each gear type is presented in Figure 9. Minnow (Phoxinus phoxinus) were the most common fish species encountered in the benthic gill nets. 31 European eels were caught in the fyke nets.
Common name
Scientific name
Benthic gill nets
Fyke nets
Total
Brown trout
Salmo trutta
38
10
48
Minnow
Phoxinus phoxinus
43
43
86
Eel
Anguilla anguilla
0
31
31
Fig 9. Number of each species captured by each gear type during the survey of Lough Trusk.
4.2 FISH ABUNDANCE Fish abundance, mean catch per unit effort (CPUE) was calculated as the mean number of fish caught per metre of net. Fish biomass, mean biomass per unit effort (BPUE) was calculated as the mean weight of fish caught per metre of net. For all fish species with the exception of eels CPUE/BPUE is based on all nets including fyke nets. For all eels CPUE/BPUE is based on fyke nets only. Weights were not available from those fish which were released alive. In such cases weights were calculated from the length weight relationship of recorded fish. A summary of CPUE and BPUE data for each species is shown in Figure 10. Common name Brown trout
Scientific name Salmo trutta
2016 CPUE 0.145 (0.058)
2016 BPUE 19.143 (7.165)
Minnow
Phoxinus phoxinus Anguilla anguilla
0.26 (0.14)
1.005 (0.777)
0.344 (0.04)
79.163 (14.274)
Eel
Fig 10. Mean (± S.E.) CPUE and BPUE for all fish species recorded on Lough Trusk, 2016.
Page 16 of 28
COPYRIGHT © 2017 LOUGHS AGENCY OF THE FOYLE CARLINGFORD AND IRISH LIGHTS COMMISSION
Fig 11. Gill net being hauled on Lough Trusk, 2016.
Fig 12. Fyke net being hauled on Lough Trusk, 2016.
Page 17 of 28
COPYRIGHT © 2017 LOUGHS AGENCY OF THE FOYLE CARLINGFORD AND IRISH LIGHTS COMMISSION 0.5
CPUE (Number of fish/m net)
0.4
0.3
0.2
0.1
0 Brown Trout
Species
Minnow
Eel
Fig 13. Mean (± S.E.) CPUE for all fish species captured in Lough Trusk 2016 (Eel CPUE based on Fyke nets only).
BPUE (Mean biomass (g) of fish/m net)
100
80
60
40
20
0 Brown Trout
Species
Minnow
Eel
Fig 14. Mean (± S.E.) BPUE for all fish species captured in Lough Trusk 2016 (Eel BPUE based on Fyke nets only).
Page 18 of 28
COPYRIGHT © 2017 LOUGHS AGENCY OF THE FOYLE CARLINGFORD AND IRISH LIGHTS COMMISSION
4.3 MINNOW STOCK DENSITY & POPULATION STRUCTURE The relative density (CPUE & BPUE) and length frequency distribution of Minnow is presented below. A total of 86 Minnows were recorded in Lough Trusk. Minnow were the most numerous species encountered during the survey, lengths ranged from 45mm to 90mm (mean length 67mm). Exactly half of the Minnows were caught in the gill nets with the other half caught in the fyke nets. 30
25
Frequency
20
15
10
5
110 -119
100 - 109
90 - 99
80 - 89
70 - 79
60 - 69
50 - 59
40 - 49
30 - 39
20 - 29
10 - 19
0-9
0
Length (mm)
Fig 15. Length frequency Minnow, Lough Trusk 2016 (N=71).
4.4 EEL STOCK DENSITY & POPULATION STRUCTURE The relative density (CPUE & BPUE) and length frequency distribution of Eels is presented below. Values are also compared with Eel data from other lakes which have been surveyed within the Foyle and Carlingford areas. A total of 31 Eels were recorded in Lough Trusk, lengths ranged from 305mm to 615mm (mean length 442mm). In terms of abundance, the number of Eels in Lough Trusk is highest in comparison to all other surveyed loughs. In terms of the overall Eel biomass Lough Trusk is the second highest after Camlough. Page 19 of 28
COPYRIGHT © 2017 LOUGHS AGENCY OF THE FOYLE CARLINGFORD AND IRISH LIGHTS COMMISSION
CPUE (Number of fish/m net)
0.5
0.4
0.3
0.2
0.1
0 Lough Lough Carn Lough Muck Lough Camlough Enagh Lough Lough Trusk Mourne 2010 2010 2012 Nambraddan 2016 East 2016 2016 (Donegal) 2014
Site Fig 16. Mean CPUE for all Eels captured in Lough Mourne 2010, Lough Carn 2010, Lough Muck 2012, Lough Nambraddan 2014, Camlough 2016, Enagh East 2016 and Lough Trusk 2016.
BPUE (Mean biomass (g) of fish/m net)
200 175 150 125 100 75 50 25 0 Lough Lough Carn Lough Muck Lough Camlough Enagh Lough Lough Trusk Mourne 2010 2010 2012 Nambraddan 2016 East 2016 2016 (Donegal) 2014
Site Fig 17. Mean BPUE for all Eels captured in Lough Mourne 2010, Lough Carn 2010, Lough Muck 2012, Lough Nambraddan 2014, Camlough 2016, Enagh East 2016 and Lough Trusk 2016.
Page 20 of 28
COPYRIGHT © 2017 LOUGHS AGENCY OF THE FOYLE CARLINGFORD AND IRISH LIGHTS COMMISSION
Lake Lough Mourne 2010 Lough Carn 2010
Number of Eels 13
Mean Length 465 mm
Mean Weight 231 g
1
605 mm
420 g
Lough Muck 2012 (Donegal) Nambraddan 2014 Camlough 2016
10
380 mm
123 g
12
409 mm
130 g
25
529 mm
764 g
Enagh Lough East 2016 Lough Trusk 2016
1
529 mm
720 g
31
442 mm
230 g
Fig 18. Eel mean length and mean weight comparison for lakes surveyed 2010 – 2016.
5
Frequency
4
3
2
1
630 - 639
600 - 609
570 - 579
540 -549
510 - 519
480 -489
450 - 459
420 - 429
390 - 399
360 - 369
330 - 339
300 - 309
270 - 279
240 - 249
210 - 219
180 - 189
150 -159
120 - 129
90 - 99
60 - 69
30 - 39
0-9
0
Length (mm)
Fig 19. Length frequency Eel, Lough Trusk 2016 (N=31).
Page 21 of 28
COPYRIGHT © 2017 LOUGHS AGENCY OF THE FOYLE CARLINGFORD AND IRISH LIGHTS COMMISSION
4.5 BROWN TROUT STOCK DENSITY & POPULATION STRUCTURE The relative density (CPUE & BPUE) and length frequency distribution of Brown trout is presented below. Values are also compared with other lakes which have been surveyed within the Foyle and Carlingford areas. A total of 48 Brown trout were recorded during the Lough Trusk survey, lengths ranged from 135mm to 325mm (mean length 224mm). The abundance of Brown trout in Lough Trusk compares very favourably to other surveyed loughs within the Foyle area. 2 Brown trout were recorded in Lough Mourne 2010, lengths ranged from 205mm to 220mm (mean length 213mm). 3 Brown trout were recorded in Lough Carn 2010, lengths ranged from 389mm to 422mm (mean length 405mm). 25 Brown trout were recorded in Lough Ash 2011, lengths ranged from 297mm to 421mm (mean length 343mm). 44 Brown trout were recorded in Lough Muck (Donegal) 2012, lengths ranged from 69mm to 212mm (mean length 168mm). 59 Brown trout were recorded in Lough Nambraddan 2014, lengths ranged from 55mm to 240mm (mean length 147mm).
CPUE (Number of fish/m net)
0.3
0.2
0.1
0 Lough Mourne 2010
Lough Carn 2010
Lough Ash 2011 Lough Muck Lough 2012 (Donegal) Nambraddan 2014
Lough Trusk 2016
Site
Fig 20. Mean CPUE for all Brown trout captured in Lough Mourne 2010, Lough Carn 2010, Lough Ash 2011, Lough Muck 2012, Lough Nambraddan 2014 and Lough Trusk 2016.
Page 22 of 28
COPYRIGHT © 2017 LOUGHS AGENCY OF THE FOYLE CARLINGFORD AND IRISH LIGHTS COMMISSION 50
BPUE (Mean biomass (g) of fish/m net)
45 40 35 30 25 20 15 10 5 0 Lough Mourne 2010
Lough Carn 2010
Lough Ash 2011 Lough Muck Lough 2012 (Donegal) Nambraddan Site 2014
Lough Trusk 2016
Fig 21. Mean BPUE for all Brown trout captured in Lough Mourne 2010, Lough Carn 2010, Lough Ash 2011, Lough Muck 2012, Lough Nambraddan 2014 and Lough Trusk 2016.
10
Frequency
8
6
4
2
330 - 339
300 - 309
270 - 279
240 - 249
210 - 219
180 - 189
150 -159
120 - 129
90 - 99
60 - 69
30 - 39
0-9
0
Length (mm)
Fig 22. Length frequency Brown trout, Lough Trusk 2016 (N=48).
Page 23 of 28
COPYRIGHT © 2017 LOUGHS AGENCY OF THE FOYLE CARLINGFORD AND IRISH LIGHTS COMMISSION
4.6 FISH AGE AND GROWTH Scales were taken from 29 Brown trout caught during this survey for fish aging and back calculated growth analysis. Figure 23 below outlines the average length at age for each year class, with the oldest Trout found to be in the 6+ age class. 30
Length (cm)
25 20 15 10 5
L6
L5
L4
L3
L2
L1
0 Length at age
Fig 23. Growth curve showing back calculated length at age for Brown trout, Lough Trusk. 30
Lough Muck
25
Lough Nambraddan Lough Trusk
Length (cm)
20 15 10 5
L6
L5
L4
L3
L2
L1
0 Length at age
Fig 24. Comparitive growth curve showing back calculated length at age for Brown trout, Lough Muck (Donegal) 2012, Lough Nambraddan 2014 and Lough Trusk 2016.
Page 24 of 28
COPYRIGHT © 2017 LOUGHS AGENCY OF THE FOYLE CARLINGFORD AND IRISH LIGHTS COMMISSION
4.7 BROWN TROUT STOMACH ANALYSIS A total of 21 Brown trout were examined for stomach contents. Of these only 2 fish were found to have empty stomachs and 11 contained unidentified digested matter. The remaining 8 fish had a mixed diet, feeding on a variety of items. Many were found to have consumed midge larvae (Chirononmidae), mayfly (Ephemeroptera), caddis (Trichoptera) and stoneflies (Plecoptera). One fish had also been feeding on bugs (Heteroptera) and dragon/damselflies (Odonata). 12
Frequency
9
6
3
Empty
Digested Matter
Length (mm)
Chirononmidae
Odonata
Heteroptera
Trichoptera
Plecoptera
Ephemeroptera
0
Fig 25. Brown trout stomach analysis, Lough Trusk 2016.
5.0 DISCUSSION Minnows were the most numerous species encountered during this survey. Minnow are very small in size and contribute little in terms of the overall biomass of the lough. It is likely that they are contributing to the abundance of potential prey species for both Brown trout and Eels within the lough. Lough Trusk holds good numbers of Brown trout when compared with other lakes within the Foyle area. The lough also holds a reasonable biomass of Brown trout, which is the second highest of all the lakes surveyed in the Foyle area since 2010. It is of note that no Brown trout under 13 centimetres were encountered during Page 25 of 28
COPYRIGHT © 2017 LOUGHS AGENCY OF THE FOYLE CARLINGFORD AND IRISH LIGHTS COMMISSION
the survey which may indicate little or no recruitment to the population in the past year. Eels were the most abundant fish species found during the survey. When compared to all other loughs surveyed within the Foyle & Carlingford areas since 2010, Lough Trusk also holds the greatest abundance of European eel. In terms of the biomass of eels in Lough Trusk, it is the second highest after Camlough. It is recommended that in any future survey that a number of braided nylon single panel floating gill nets are used in place of the monofilament floating gill nets used during this survey. Lough Trusk is an area of natural beauty and has what appears to be the native fish fauna expected for a lough of its type. While no large trout were caught or observed during this study the value of a wild fishery in such a scenic area cannot be underestimated. This report is a baseline survey of fish stocks in Trusk Lough and it is hoped that it can provide the basis for an evidence based approach to the management of the lough. Fishery managers and anglers should also have an opportunity to review the report and consider its recommendations when developing any future angling initiatives for Trusk Lough. The information presented in this report can also be used to compare stocks from any other water body where the same survey method has been used.
6.0 INVASIVE SPECIES Invasive non-native species are those which have been transported outside of their natural range. They are capable of spreading rapidly and colonising a wide range of habitats. They also exhibit competitive dominance by out-competing native flora and fauna for light, oxygen and food. There is growing evidence to suggest that invasive riparian plants are having an adverse effect on aquatic habitats and species by altering both in-stream processes and terrestrial-aquatic linkages. Invasive species threaten native species as direct predators or competitors, as vectors of disease, and by modifying the native habitats. Invasive species are now considered the second biggest threat after habitat loss to biodiversity worldwide by the Millennium Ecosystem Assessment in 2005. Water is an excellent transport medium for the dispersion of many of these species. Rivers and loughs with their banks and shorelines are amongst the most Page 26 of 28
COPYRIGHT © 2017 LOUGHS AGENCY OF THE FOYLE CARLINGFORD AND IRISH LIGHTS COMMISSION
vulnerable areas to their introduction, spread and impact. The focus for the Loughs Agency is predominantly on aquatic and riparian invasive species as these are a serious threat to our sensitive aquatic habitats. The spread of invasive species can also further threaten already endangered native species. In freshwater habitats the introduction of invasive species is considered the second leading cause of species extinctions. Invasive species are a global problem and once they are established eradication is often costly and extremely difficult. Previous studies suggest that early intervention is a more successful and cost-effective way of preventing the spread of invasive species. There are a multitude of invasive non-native species across the UK and Ireland at present, many of them with the potential to cause serious environmental harm. Three species in particular, Japanese Knotweed (Fallopia japonica), Himalayan Balsam (Impatiens grandulifera) and Giant Hogweed (Heracleum mantegazzianum) have become an established threat to the streams and rivers of the Foyle and Carlingford areas. Rivers are an excellent means of transporting, dispersing and spreading invasive species, therefore it is no great surprise to see a proliferation along our river corridors. There is a growing body of evidence demonstrating the damaging impacts of (INNS) invasive non-native species. The problem of excessive soil erosion along the riparian zone can have grave consequences for freshwater fish species. Atlantic salmon (Salmo salar) and Trout (Salmo trutta) are reliant upon finding appropriately sized spawning gravel to complete their life cycle. However, Himalayan Balsam will die back in winter time, leaving behind exposed river banks devoid of any natural vegetation. The lack of vegetation on the riparian zone leaves the bank highly susceptible to soil erosion at times of increases flows and floods. Excessive soil erosion will increase the sediment load into the stream reach and can potentially smother the eggs buried in the spawning gravel, starving them of oxygen. Atlantic salmon stocks are at unprecedented low levels and they are experiencing very high mortality rates during the marine phase of their life cycle. Increased sediment being introduced to rivers and streams has the potential to diminish juvenile abundance even further and merely exacerbates the problem still further.
Page 27 of 28
COPYRIGHT © 2017 LOUGHS AGENCY OF THE FOYLE CARLINGFORD AND IRISH LIGHTS COMMISSION
7.0 BIOSECURITY Invasive species are an ever present threat in our aquatic and riparian systems and it is imperative that none of our field operations exacerbate the risks to the environment and to the economy that are posed by these species. Fish parasites, pathogens and diseases also represent a significant threat to the health status of our watercourses. The introduction or transfer of such pathogens or diseases has the potential to wipe out large populations of fish in affected waters or catchments. Loughs Agency staff are required to be vigilant to help prevent the spread of fish diseases and invasive species. The agency has incorporated biosecurity protocols into its freshwater fisheries monitoring programme and these guidelines are also adhered to by fishery officers and field staff. The Loughs Agency biosecurity protocol for field operations was fully implemented during the Lough Trusk fish survey.
8.0 RECOMMENDATIONS · Repeat survey every 5 years · Compare results against any future surveys in the Foyle area to ascertain comparative growth rates across and within a range of stillwaters of the Foyle and Carlingford areas. · Incorporate electrofishing of inflowing and out flowing tributaries into any future survey. · Communicate findings internally to colleagues and externally to stakeholders. · Continue to conduct stillwater fish surveys temporally and spatially within the Foyle and Carlingford areas. · Ensure that any future evidence based management decisions or angling initiatives take account of the findings of this baseline report.
Page 28 of 28
COPYRIGHT © 2017 LOUGHS AGENCY OF THE FOYLE CARLINGFORD AND IRISH LIGHTS COMMISSION
· Promote Biosecurity awareness with angling community
9.0 REFERENCES Kelly, FL (2008) WFD Surveillance Monitoring Fish in Lakes (2007) Central and Regional Fisheries Board report. Kelly, F.L., Connor, L., Wightman, G., Matson, R., Morrissey, E O’Callaghan, R., Feeney, R., Hanna, G. and Rocks, K., (2009) Sampling fish for the Water Framework Directive – Summary Report 2008. Central and Regional Fisheries Board report. North South Share Aquatic Resource (NS Share). Methods Manual V Fish (2008) European CEN Standard. Water quality-Sampling of fish with multi-mesh gill nets (2005).
Page 29 of 28