This document and its contents are copyright of the Loughs Agency ©2012 LOUGHS AGENCY OF THE FOYLE CARLINGFORD AND IRISH LIGHTS COMMISSION
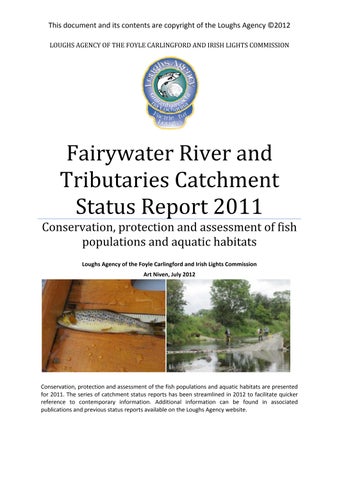
Fairywater River and Tributaries Catchment Status Report 2011 Conservation, protection and assessment of fish populations and aquatic habitats Loughs Agency of the Foyle Carlingford and Irish Lights Commission Art Niven, July 2012
Conservation, protection and assessment of the fish populations and aquatic habitats are presented for 2011. The series of catchment status reports has been streamlined in 2012 to facilitate quicker reference to contemporary information. Additional information can be found in associated publications and previous status reports available on the Loughs Agency website.
[Type Page 1a ofquote 36
COPYRIGHT © 2012 LOUGHS AGENCY OF THE FOYLE CARLINGFORD AND IRISH LIGHTS COMMISSION
Headquarters 22, Victoria Road Londonderry BT47 2AB Northern Ireland Tel: +44(0)28 71 342100 Fax: +44(0)28 71 342720 general@loughs‐agency.org www.loughs‐agency.org
Regional Office Dundalk Street Carlingford Co Louth Republic of Ireland Tel+353(0)42 938 3888 Fax+353(0)42 938 3888 carlingford@loughs‐agency.org www.loughs‐agency.org
Report Reference LA/CSR/07/12 Written and Prepared by Art Niven and Rachel Scott. For further information contact art.niven@loughs‐agency.org Page 2 of 36
COPYRIGHT © 2012 LOUGHS AGENCY OF THE FOYLE CARLINGFORD AND IRISH LIGHTS COMMISSION
TABLE OF CONTENTS
TABLE OF CONTENTS........................................................................................... 3 1.0
INTRODUCTION ......................................................................................... 5
2.0
ATLANTIC SALMON STOCKS SUMMARY .................................................... 7
2.1 NET FISHERIES......................................................................................... 8 2.2 ROD CATCH ............................................................................................. 9 Fig 2. Loughs Agency reported and corrected rod catch with % returns made ......................................................................................................... 10 Fig 3. Reported rod catch for salmon/grilse in the Loughs Agency area and 5 year average. .......................................................................................... 10 2.3 FISH COUNTERS .................................................................................... 11 2.4 REDD COUNTS ...................................................................................... 12 Figure 4. Annual redd counts and 5 year running average ....................... 12 Figure 5. Recent redd count data for the total Foyle area and Fairywater catchment ................................................................................................. 12 2.5 JUVENILE ABUNDANCE/ELECTROFISHING SURVEYS............................. 13 Fig 6. Fairywater salmon fry electrofishing index. Based on a fluctuating number of sites. ........................................................................................ 13 Fig 7. Foyle area salmon fry index comparison chart 2011 *the number of standard monitoring stations varies between catchments. Based on a fluctuating number of sites. ...................................................................... 13 Fig 8. Culdaff salmon fry electrofishing classification.............................. 14 2.6 MARINE SURVIVAL ................................................................................ 15 2.7 DISCUSSION .......................................................................................... 15 3.0
TROUT STOCKS SUMMARY ...................................................................... 16
3.1 ROD CATCH ........................................................................................... 17 Fig 9. Loughs Agency reported and corrected rod catch (Sea trout) with % returns made............................................................................................. 18 Page 3 of 36
COPYRIGHT © 2012 LOUGHS AGENCY OF THE FOYLE CARLINGFORD AND IRISH LIGHTS COMMISSION
Fig 10. Reported rod catch for Sea trout in the Loughs Agency area and 5 year average.............................................................................................. 18 3.2 JUVENILE ABUNDANCE/ELECTROFISHING SURVEYS............................. 19 Fig 12. Foyle area trout fry index comparison chart 2011 *the number of standard monitoring stations varies between catchments. Based on a fluctuating number of sites. ...................................................................... 19 Fig 13. Culdaff Trout fry classifications ..................................................... 20 3.3 DISCUSSION .......................................................................................... 21 4.0
SUMMARY OF OTHER SURVEYS AND FISH STOCK ASSESSMENTS ........... 22
4.1 WATER FRAMEWORK DIRECTIVE FISH MONITORING .......................... 23 Fig 14. Fish caught at Fairywater WFD surveillance station 2011 ............. 24 Fig 15. Length weight relationship of salmon n = 40................................. 24 Fig 16. Length weight relationship of trout n = 26 .................................... 25 Fig 17. Length frequency of salmon n = 40. .............................................. 25 5.0
WATER QUALITY SUMMARY .................................................................... 28 Fig 18. 2011 Ammonia classifications ....................................................... 29 Fig 19. 2011 BOD classifications ................................................................ 30 Fig 20. 2011 Phosphorous classifications .................................................. 31 Fig 21. 2011 suspended solids classifications............................................ 32
6.0 6.1
CONSERVATION AND PROTECTION SUMMARY ....................................... 33 CREW REPORT ON 2011..................................................................... 34
7.0
CATCHMENT INITIATIVES......................................................................... 34
8.0
ACTIONS FOR 2012/2013......................................................................... 35
This document and its contents are copyright of the Loughs Agency ©2012
Page 4 of 36
COPYRIGHT © 2012 LOUGHS AGENCY OF THE FOYLE CARLINGFORD AND IRISH LIGHTS COMMISSION
1.0
INTRODUCTION
The Loughs Agency series of catchment status reports outlining information collected and actions completed during 2011 have been restructured for reporting in 2012. It is anticipated that this will facilitate the same level and diversity of information dissemination provided in previous years while directing interested parties to more detailed sources of information available in other Loughs Agency publications. More detail on any of the topics included in this report can be found in previous status reports available on the Loughs Agency website. The joint themes for the 2012 series of catchment status reports are wild trout conservation and littering. Both of these contemporary issues are of great significance to the ongoing conservation and protection of our aquatic and riparian habitats and are important issues when attracting and informing responsible users to the local area. In 2011 the Loughs Agency has continued to participate in innovative ways to tackle the growing problem of littering. The “throw away” society has resulted in rivers acting as major conduits for discarded materials from varied sources. On their journey downstream these discarded items catch on trees and other vegetation resulting in both visual and unseen impacts upon our biodiversity and water quality. During 2011 the Loughs Agency in Partnership with Causeway Coast Kayak Association, Limavady Borough Council, Strabane District Council and Roe Angling Association conducted canoe and bank based river clean ups at key locations throughout the river corridors of both the River Roe and Glenelly River. Over three tons of mixed rubbish was removed during these two river clean up events. While the Loughs Agency does not have a legislatory remit to tackle the issue of littering it is eager to encourage a partnership approach to tackling this key issue. Within the Foyle and Carlingford areas the conservation of wild trout populations is of ever growing importance. Rod catch returns have shown a marked decline of Sea trout over recent decades. The Loughs Agency has been working with local partners in 2011 to monitor populations of brown trout and sea trout to collect information which can be used to develop conservation and Page 5 of 36
COPYRIGHT © 2012 LOUGHS AGENCY OF THE FOYLE CARLINGFORD AND IRISH LIGHTS COMMISSION
protection programmes. Targeted monitoring programmes have been ongoing within the Derg catchment, Burndennet catchments, Inishowen and Lough Foyle tributaries. This is in addition to ongoing annual electrofishing surveys which record the abundance and distribution of trout throughout the Foyle and Carlingford areas. The Loughs Agency promotes responsible use of the valuable aquatic resources of the Foyle and Carlingford areas. The protection of these resources can only be achieved through effective collaborative partnerships. If your organisation is interested in participating in “hands on” action please contact the Loughs Agency to discuss possible partnership development.
Page 6 of 36
This document and its contents are copyright of the Loughs Agency ©2012 2.0 ATLANTIC SALMON STOCKS SUMMARY • There were no net fisheries pursued for Atlantic salmon in the Foyle area in 2011. This is due to the continued failure of the River Finn to meet its conservation limits as outlined under the Foyle Area (Control of Fishing) Regulations 2010. Angling is permitted in the River Finn and River Foyle on a catch and release basis only. • Total declared Atlantic salmon rod catch for the Foyle and Carlingford area was 3533. Total declared rod catch for the Fairywater catchment was 0. Voluntary catch and release for the Foyle and Carlingford areas was 28 %. • Returning adult Atlantic salmon counts derived from an electronic fish counter on the River Mourne were 1342 salmon/grilse in 2011. This compares to a 5 year average of 3856. • Spawning redd counts for the Foyle area were 1313 in 2011 with 2 redds recorded within the Fairywater catchment • Juvenile electrofishing surveys within the Fairywater catchment at 14 sites recorded an average of 2 salmon fry (Young of Year).
Loughs Agency Management Strategy for Atlantic Salmon The Loughs Agency uses an audit point management system for monitoring the populations of Atlantic salmon within the Foyle and Carlingford areas. Population estimates and indices are derived for various life history stages including adult counts from electronic fish counters situated at key locations, spawning redd counts, juvenile electrofishing indices, rod catch and commercial net catches. Numbers of Atlantic salmon stocks particularly grilse (1SW fish) from southern populations of north east Atlantic stocks are currently at a low point. International research has highlighted climate change and marine ecosystem change as potential causes for this observed decline. The Loughs Agency is working with colleagues at regional, national and international levels to understand this decline and to implement best practice conservation actions.
Page 7 of 36
COPYRIGHT © 2012 LOUGHS AGENCY OF THE FOYLE CARLINGFORD AND IRISH LIGHTS COMMISSION
2.1
NET FISHERIES
Net fisheries have not been operated in the Foyle area since 2009 (Figure 1). The Foyle Area (Control of Fishing) Regulations 2010 provides various mechanisms for regulating both commercial and rod fisheries for salmon including under Section 3. (1) The Commission shall make a declaration.....if it is satisfied that...... (d) the number of salmon which have migrated upstream of the River Finn fish counter during each of any two of the previous five calendar years has not exceeded 5,410. A declaration under this shall..... (d) in the case of sub‐paragraph (d), suspend netting in the River Foyle, Lough Foyle and seaward of Lough Foyle and restrict angling in the River Finn to angling on a catch and release basis only from the date and time specified in the declaration....The Commission can make the relevant declaration ending the suspension of netting and restriction on angling if it is satisfied that the number of salmon migrating upstream of the relevant counter during each of any four of the previous five calendar years has exceeded the number of salmon for that river. 140000
Total Commercal Catch
120000
5 Year Average
Number of Salmon and Grilse
100000
80000
60000
40000
20000
1952 1954 1956 1958 1960 1962 1964 1966 1968 1970 1972 1974 1976 1978 1980 1982 1984 1986 1988 1990 1992 1994 1996 1998 2000 2002 2004 2006 2008 *2010
0
Year
Fig 1. Total commercial catch 1952‐2009 and 5 year average total commercial catch.
Page 8 of 36
This document and its contents are copyright of the Loughs Agency ©2012 2.2
ROD CATCH
Total rod catch returns continue to increase and were 46% in 2011 (Figure 2). A total of 3533 salmon/grilse were caught in the Foyle and Carlingford areas in 2011 (Figure 2 & 3). 0 salmon and grilse were reported caught in the Fairywater catchment (Figure 4). Salmon/Grilse caught and released were 28% in the Foyle and Carlingford area. Trends in rod catch have generally increased over recent years. This is largely due to a number of factors including an increased number of rod licenses being issued and a higher % of returns being made (Figure 2). It is your legal obligation to make an accurate and timely rod catch return. There are a number of important reasons for making rod catch returns. • • • • • • • • • • • • • •
How many fish were caught in YOUR RIVER OR LAKE? What % of fish were caught and released in YOUR RIVER OR LAKE? Is catch and release increasing? What species were caught? Essential for developing sustainable fishery management policy Screening of future developments (roads, hydro etc.) against fishery interests. An important tool for assessing strength of runs Aids with developing access and infrastructure (stiles etc) It is required by law that all rod licence holders make an accurate catch return Facilitates long term trend monitoring Participate in the management of your river (doing your bit) At a time of reduced marine survival for Atlantic salmon accurate information is essential for sustainable management Aids in ensuring good decision making so that future generations can enjoy the sport of fishing Ensuring that all species caught are sustainably managed now and in the future
An unreported fish is a wasted opportunity, for economic development, for conservation, for protection of our fishery resources, for education and for future generations. Page 9 of 36
This document and its contents are copyright of the Loughs Agency ©2012 Corrected Rod Catch
Rod Catch % Returns
90
2009
2006
0 2003
0 2000
10
1997
2000
1994
20
1991
4000
1988
30
1985
6000
1982
40
1979
8000
1976
50
1973
10000
1970
60
1967
12000
1964
70
1961
14000
1958
80
1955
16000
Rod Catch % Returns
Reported Rod Catch
1952
Number of Salmon
18000
Year
Fig 2. Loughs Agency reported and corrected rod catch with % returns made
8000
Reported Rod Catch
5 Year Average
7000 6000
Number of Salmon and Grilse
5000 4000 3000 2000 1000
1952 1954 1956 1958 1960 1962 1964 1966 1968 1970 1972 1974 1976 1978 1980 1982 1984 1986 1988 1990 1992 1994 1996 1998 2000 2002 2004 2006 2008 2010
0
Year
Fig 3. Reported rod catch for salmon/grilse in the Loughs Agency area and 5 year average.
Page 10 of 36
COPYRIGHT © 2012 LOUGHS AGENCY OF THE FOYLE CARLINGFORD AND IRISH LIGHTS COMMISSION
2.3
FISH COUNTERS
The Loughs Agency operates a network of electronic fish counters throughout the Foyle and Carlingford areas to monitor the migration of Atlantic salmon into freshwaters. The counters are used to assess the attainment of conservation limits and management targets for key catchments. In 2011 the Mourne fish count as recorded by the electronic fish counter was 1342 with a 5 year average of 3856 (Figures 5 & 6). The management target for the Mourne and upstream is 8000 and the conservation limit is 6400.
Page 11 of 36
COPYRIGHT © 2012 LOUGHS AGENCY OF THE FOYLE CARLINGFORD AND IRISH LIGHTS COMMISSION
2.4
REDD COUNTS
Atlantic salmon redds (spawning nests) are counted on an annual basis and have been shown to be a good indicator of returning population size. Annual redd counts and the 5 year running average are displayed in Figures 5 & 6. In 2011 there was a total count of 1313 redds with a five year running average of 3459. 2 redds were recorded in the Fairywater catchment in 2011/12. It should be noted that there was poor redd counting conditions in 2011/12. Redd counting has only recently been conducted in the Fairywater catchment. 25000
25000 Total Number of Redds 5 Year Average
20000
15000
15000
10000
10000
5000
5000
2006/7
2000
2003/4
Year
1997
1994
1991
1988
1985
1982
1979
1976
1973
1970
1967
1964
1961
1958
1955
1952
0
0
2009/…
Number of Redds
20000
Figure 4. Annual redd counts and 5 year running average 6000
Total Foyle Fairywater
5507
5354
Number of Redds
5000 4000 4000
3436 3039
3000 2000 1338
1313
1000 23
2
2010/11
2011/12
0 2005/6
2006/7
2007/8
2008/9 Year
2009/10
Figure 5. Recent redd count data for the total Foyle area and Fairywater catchment
Page 12 of 36
COPYRIGHT © 2012 LOUGHS AGENCY OF THE FOYLE CARLINGFORD AND IRISH LIGHTS COMMISSION
2.5
JUVENILE ABUNDANCE/ELECTROFISHING SURVEYS
Juvenile Atlantic salmon abundance is measured on an annual basis by following a standardised procedure (Crozier and Kennedy, 1996). A fixed number of sampling stations are monitored using this semi‐quantitative (5 minute timed) electrofishing methodology. Over many years an index has been developed to show trends for individual catchments (Figures 7 & 8). In 2011 the mean number of salmon fry (young of year) recorded at 14 standardised monitoring stations within the Fairywater catchment was 2.
Average Fry/5 Minute Fishing
4
3
2
1
0 2000
2001
2002
2003
2004
2005
2006
2007
2008
2009
2010
2011
Year
Fig 6. Fairywater salmon fry electrofishing index. Based on a fluctuating number of sites. 37
35
35
34
30 24
25
22
22 19
2
2
2
1
1
0 Foyle South
3
Owenreagh S
Catchment
5
Glenmornan
Drumagh
Camowen
Mourne
Derg
Burn Dennet
Owenkillew
Roe
Faughan
0
Glenelly
5
Fairywater
7
Strule
10
Culdaff
13
Deele
14
15
Finn
20
Owenreagh…
Average Salmon Fry/5 minute
40
Fig 7. Foyle area salmon fry index comparison chart 2011 *the number of standard monitoring stations varies between catchments. Based on a fluctuating number of sites.
Page 13 of 36
This document and its contents are copyright of the Loughs Agency ©2012
Fig 8. Culdaff salmon fry electrofishing classification
Page 14 of 36
This document and its contents are copyright of the Loughs Agency ©2012 2.6
MARINE SURVIVAL
Marine survival continues to be of significant concern throughout the southern range of Atlantic salmon in the North East Atlantic. The nearest monitoring station to the Foyle area which provides robust survival data to the International Council for the Exploration of the Seas Working Group on North Atlantic Salmon is the River Bush in Co Antrim. Marine survival rates for One Sea Winter (1SW) grilse pre the mid 1990’s was around 30%, in recent years this has fallen to extremely low levels with a marine survival rate of only 2.6% for the 2010 cohort returning to the river in 2011, this is the lowest on record. Multi Sea Winter (MSW) Atlantic salmon appear to be doing slightly better. The international SALSEA Merge project investigating the marine portion of the Atlantic salmon’s life cycle reported in 2011. Further information can be found at http://www.nasco.int/sas/salseamerge_documents.htm this will provide a firm platform on which to develop future salmon management strategy at an international level that takes into consideration the complex lifecycle of Atlantic salmon and its place within both freshwater and marine ecosystems.
2.7
DISCUSSION
Atlantic salmon have a complex lifecycle which can be impacted upon by many factors. The impacts cannot always be quantified making it difficult to accurately estimate the number of returning adult salmon/grilse to our rivers each year. An analysis of cohort/age class strength throughout its lifecycle from egg to spawning adult is complicated by numerous factors. These include varying egg survival rates, differing age at smolting, marine survival rates, time spent at sea/age at spawning and number of spawning migrations made. It is extremely difficult to infer from one life history stage or stages what the strength of any returning cohort will be. This is currently exacerbated by extremely low marine survival rates possibly as a result of altered marine food webs and oceanic prey distribution all in the context of climate change. Cohort analysis is not possible on the limited data set for the Fairywater catchment. Estimated adult returns cannot be made due to the lack of counter or rod catch data Page 15 of 36
COPYRIGHT © 2012 LOUGHS AGENCY OF THE FOYLE CARLINGFORD AND IRISH LIGHTS COMMISSION
3.0
TROUT STOCKS SUMMARY • In 2011 total declared Trout rod catch for the Foyle and Carlingford area was 315. Total declared rod catch for the Fairywater catchment was 0. • In 2011 juvenile electrofishing surveys within the Fairywater catchment at 14 sites recorded an average of 4 trout fry. • Sea trout stocks have declined significantly in the Foyle area over recent decades with most recent rod catches being the lowest on record. • Similar declines in sea trout stocks have been observed in other parts of Ireland and the west coast of Scotland. Diverse reasons for population declines have been proposed and are currently being investigated. • The Loughs Agency will be implementing a sea trout research project in 2012 which will monitor local sea trout populations. • Ongoing brown trout monitoring projects will continue in 2012 including a brown trout radio tracking study of the Lough Derg wild brown trout population
Development of a Loughs Agency Trout Management Strategy During 2011 the Loughs Agency consulted with stakeholders on the development of a trout strategy. The draft strategy contains 19 policies which relate to six main areas: • Habitat improvement • Exploitation • Stock management • Barriers to migration • Culverting • Water abstraction and impoundment At present Loughs Agency monitor stocks of trout in a number of ways including analysis of rod catch data, and juvenile electrofishing surveys. During 2011 a sea trout monitoring programme was instigated on a tributary of the Burndennet and the Lough Derg Wild Trout Conservation Project continued with the Loughs Agency working in partnership with Pettigo and District Angling Association.
Page 16 of 36
COPYRIGHT © 2012 LOUGHS AGENCY OF THE FOYLE CARLINGFORD AND IRISH LIGHTS COMMISSION
3.1
ROD CATCH
Sea trout are a prized quarry in both the Foyle and Carlingford areas but display very different life history strategies to both the resident brown trout and Atlantic salmon. Rod catch provides one of the key “audit points” for the management of this species. Declared rod catch has highlighted the significant declines over recent decades. It should be noted that sea trout populations fluctuate greatly and like many wild populations of animals they are prone to boom and bust cycles. Over the duration of the decline in sea trout populations various reasons for the decline have been suggested including spawning habitat loss, barriers to migration, increased numbers of sea lice due to salmon aquaculture, natural population fluctuations, inshore marine ecosystem change, over fishing, pollution of key spawning streams etc. All of these will have impacted the Sea trout populations to some extent. Within the Foyle area Sea trout average weight tends not to exceed 2‐3 lbs with larger specimens being quite rare. In the Carlingford area Sea trout are considerably larger with average weight somewhere between 5‐8lbs with larger double figure specimens encountered from time to time. The difference between west and east may be down to the quality and availability of suitable prey species. Irish Sea populations of Sea trout tend to be much larger and may be indicative of less impacted prey species populations. A parallel could be made between documented north coast of Ireland sea bird populations and Irish Sea populations, with Irish Sea populations doing better because of better availability of prey species. North coast of Ireland sea bird populations have been in decline over recent decades, in parallel with the plight of Sea trout. In the Foyle and Carlingford area the minimum size for retaining a Brown trout or Sea trout is 25.4cm. All Sea trout over 40cm must be tagged and there is a bag limit of 1 Sea trout per day, up to a maximum of 5 during the period from the start of the season to 31st May. A bag limit of 2 Sea trout over 40cm per day applies from the 1st June to the end of the season up to a maximum of 20. There is also a daily bag limit of 4 Brown trout or Sea trout of 40cm or less in length throughout the season. Stricter club/association rules may apply.
Page 17 of 36
This document and its contents are copyright of the Loughs Agency ©2012 Within the Foyle area there is generally a geographic north south divide with sea trout dominant in the northern catchments and brown trout dominant in the southern catchments. Historically the northern catchments and their associated small streams provided excellent spawning and nursery habitat and when associated with high densities of salmon may have been a major reason for seaward migration of juvenile trout in search of prey and less competition. The southern catchments still hold good populations of resident Brown trout with significant angling development potential. These populations however are more susceptible to pollution events. Figures 11 and 12 outline Sea trout rod catches for the Foyle and Carlingford areas. Reported Rod Catch
Corrected Rod Catch
Rod Catch % Returns
90
35000
80
30000
70
50
20000
40
15000
% Returns
60
25000
30
10000
20
5000
10
0
0 1952 1954 1956 1958 1960 1962 1964 1966 1968 1970 1972 1974 1976 1978 1980 1982 1984 1986 1988 1990 1992 1994 1996 1998 2000 2002 2004 2006 2008 2010
Numbert of Sea Trout
40000
Year
Fig 9. Loughs Agency reported and corrected rod catch (Sea trout) and 5 year average. 14000
Reported Rod Catch
5 Year Average
12000
Number of Sea Trout
10000 8000 6000 4000 2000 1952 1954 1956 1958 1960 1962 1964 1966 1968 1970 1972 1974 1976 1978 1980 1982 1984 1986 1988 1990 1992 1994 1996 1998 2000 2002 2004 2006 2008 2010
0
Year
Fig 10. Reported rod catch for Sea trout in the Loughs Agency area and 5 year average.
Page 18 of 36
COPYRIGHT © 2012 LOUGHS AGENCY OF THE FOYLE CARLINGFORD AND IRISH LIGHTS COMMISSION
3.2
JUVENILE ABUNDANCE/ELECTROFISHING SURVEYS
As for juvenile Atlantic salmon Trout abundance is measured on an annual basis by following the same standardised procedure (Crozier and Kennedy, 1996). A fixed number of sampling stations are monitored using this semi‐ quantitative (5 minute timed) electrofishing methodology. Over many years an index has been developed to show trends for individual catchments (Figure 13). In 2011 the mean number of trout fry (young of year) recorded at 14 standardised monitoring stations within the Fairywater catchment was 4.
Average Fry/5 Minute Fishing
5 4 3 2 1 0 2000
2001
2002
2003
2004
2005
2006
2007
2008
2009
2010
2011
Year
60 50
49
40 30
5
5
5
4
4
4
4
3
2
Mourne
Strule
Glenelly
Roe
Owenreagh S
Fairywater
Finn
Drumagh
Owenreagh…
Camowen
Burn Dennet
0
2
2
1 Owenkillew
5
Derg
6
Deele
6
Glenmornan
7
Culdaff
7
10
Faughan
20
Foyle South
Average Trout Fry/5 Minute
Fig 11. Fairywater trout fry index. Based on a fluctuating number of sites.
Catchment
Fig 12. Foyle area trout fry index comparison chart 2011 *the number of standard monitoring stations varies between catchments. Based on a fluctuating number of sites.
Page 19 of 36
This document and its contents are copyright of the Loughs Agency ©2012
Fig 13. Culdaff Trout fry classifications
Page 20 of 36
This document and its contents are copyright of the Loughs Agency ©2012 3.3
DISCUSSION
At present rod catch and juvenile electrofishing surveys are the two monitoring programmes conducted annually on Trout populations within the Foyle and Carlingford areas. In order to extend the baseline of information future expansion of the monitoring programmes could include the development of a Trout redd index on key tributaries. This would facilitate the analysis of trends over time and the effects of any remedial works. Adult Sea trout electrofishing surveys could also be conducted to gain key biological information which could assist with regulating catch size. The Fairywater catchment is significant habitat for trout. Within the Fairywater catchment there is competition with Atlantic salmon for feeding territories. While both species have slightly different habitat requirements at times they do overlap. The general trend in the Fairywater is that salmon dominate the main stem and swifter water while trout dominate the smaller tributaries. Ongoing monitoring is essential for the development of appropriate and contemporary regulation of the rod fishery.
Page 21 of 36
This document and its contents are copyright of the Loughs Agency ©2012 4.0 SUMMARY OF OTHER SURVEYS AND FISH STOCK ASSESSMENTS • Eight Water Framework Directive fish surveillance monitoring stations were surveyed within the Foyle area in 2011. One was within the Fairywater catchment. • The Fairywater WFD fish site was classified as good for fish. Further details can be found in the 2011 WFD Fish Surveillance Report on the Loughs Agency website under the publications section www.loughs‐agency.org • At present there is no declared rod catch on the Fairywater. The Loughs Agency is eager to see all catches reported under the terms and conditions that apply to the issue of a rod license. In the absence of catch data it is unknown how much of an angling effort takes place. Investment in access and infrastructure cannot be made to improve facilities in the absence of this information. • License checks were regularly made during the season in the Fairywater catchment. • Under the terms of issue of a rod license it is a requirement under the Foyle Fisheries Act to make a catch return including a nil return.
Additional Surveys and Fish Stock Assessments Fish stock assessments are an extremely important part of fishery management. They provide the information on which to develop policy and to implement appropriate legislation and regulation to ensure future sustainable management. During 2011 additional fish stock assessments were conducted for Water Framework Directive fish monitoring purposes. A quantitative electrofishing approach was used to monitor the main channel of the Fairywater at the lower end of the catchment. Quantitative electrofishing involves stop netting off of a section of river. Removal sampling by electrofishing is then conducted, the data collected can be used to calculate fish densities for the different species and age classes present. This method provides a good indicator of the species present, their abundance and age classes present.
Page 22 of 36
COPYRIGHT © 2012 LOUGHS AGENCY OF THE FOYLE CARLINGFORD AND IRISH LIGHTS COMMISSION
In 2011 the Loughs Agency continued to meet its obligations under a raft of national and international legislation. In addition to meeting its statutory duties the Loughs Agency plans its monitoring works to best inform current and future policy development and to deliver on conservation and protection targets as outlined in the Loughs Agency Corporate and Business Plans. In 2011 in addition to the collection of standard annual audit point fishery management information surveys were conducted on fish populations for WFD monitoring purposes within the Fairywater catchment.
4.1
WATER FRAMEWORK DIRECTIVE FISH MONITORING
The WFD is a key piece of European environmental legislation designed to facilitate improvements in our aquatic environments. The Loughs Agency under the guidance of the Northern Ireland WFD Fish Group is responsible for fish monitoring within the Foyle and Carlingford areas. This involves the monitoring of 24 surveillance monitoring stations on a rolling six year basis. Quantitative electrofishing is the preferred method where possible and the data collected is used to derive a fish classification which is then combined with the results from other monitored parameters to create an overall surface water body classification. This ranges from High Ecological Status through Good Ecological Status, Moderate Ecological Status, Poor Ecological Status to Bad Ecological Status. The target set by the WFD is that all water bodies must reach Good Ecological Status by 2015. In 2011 the Loughs Agency monitored eight surveillance stations within the Foyle area with one in the Fairywater catchment. The sample data below is for the Fairywater station.
Page 23 of 36
COPYRIGHT © 2012 LOUGHS AGENCY OF THE FOYLE CARLINGFORD AND IRISH LIGHTS COMMISSION 90 81 80 70
Number of Fish
60 50 50 40 32 30 20
13 8
10
7 1
0 0 Salmon 0+ Salmon 1+
Trout 0+
Trout 1+
Eel
Lamprey
Minnow
Stone Loach
Species
Fig 14. Fish caught at Fairywater WFD surveillance station 2011 45 40
y = 1E‐05x3.0223 R² = 0.9828
35
Weight (g)
30 25 20 15 10 5 0 0
20
40
60
80
100
120
140
160
Length (mm)
Fig 15. Length weight relationship of salmon n = 40
Page 24 of 36
COPYRIGHT © 2012 LOUGHS AGENCY OF THE FOYLE CARLINGFORD AND IRISH LIGHTS COMMISSION
140 y = 4E‐05x2.759 R² = 0.9655
120
Weight (g)
100 80 60 40 20 0 0
50
100
150
200
250
Length (mm)
Fig 16. Length weight relationship of trout n = 26 6 5
Frequency
4 3 2 1 0 50 54 58 62 66 70 74 78 82 86 90 94 98 102106110114118122126130134138142 Length (mm)
Fig 17. Length frequency of salmon n = 40.
Page 25 of 36
COPYRIGHT © 2012 LOUGHS AGENCY OF THE FOYLE CARLINGFORD AND IRISH LIGHTS COMMISSION
Page 26 of 36
COPYRIGHT © 2012 LOUGHS AGENCY OF THE FOYLE CARLINGFORD AND IRISH LIGHTS COMMISSION
Page 27 of 36
COPYRIGHT © 2012 LOUGHS AGENCY OF THE FOYLE CARLINGFORD AND IRISH LIGHTS COMMISSION
5.0
WATER QUALITY SUMMARY • 94 sites were monitored in the Foyle and Carlingford areas for water quality parameters during the summer of 2011. • 3 sites were monitored in the Fairywater catchment. • Ammonia results in the Culdaff catchment were classified as very good for all 3 sites. • 2 out of 3 sites on the Fairywater catchment were classified as good for BOD and 1 classified as fairly good. • Phosphorous results were classified as favourable for all sites. • Suspended solids were classified as favourable for nursery conditions for 1 out of 3 sites and acceptable for migratory passage for the remaining 1 site. • In the Fairywater catchment Macro invertebrates were not monitored in 2011 as part of the routine summer monitoring programme. They were monitored at the time of electrofishing
The Importance of Monitoring Water Quality The Loughs Agency conducts proactive and reactive pollution investigations within the Foyle and Carlingford areas. As part of this approach the Loughs Agency conducts a seasonal water quality monitoring programme. All results are collected and analysed by Loughs Agency staff at Loughs Agency facilities. Key chemical and biological parameters including macro invertebrate monitoring, Biological Oxygen Demand (BOD), suspended solids, ammonia and phosphorous are monitored on a monthly basis during summer. Results are available for all parameters monitored within 5 days and any follow up action can be conducted immediately. Rivers and lakes are important habitats for varied biodiversity including fish. The Loughs Agency monitors water quality during the sensitive summer period to inform investigations
Page 28 of 36
This document and its contents are copyright of the Loughs Agency ©2012
Fig 18. 2011 Ammonia classifications
Page 29 of 36
This document and its contents are copyright of the Loughs Agency ©2012
Fig 19. 2011 BOD classifications
Page 30 of 36
This document and its contents are copyright of the Loughs Agency ©2012
Fig 20. 2011 Phosphorous classifications
Page 31 of 36
This document and its contents are copyright of the Loughs Agency ©2012
Fig 21. 2011 suspended solids classifications
Page 32 of 36
This document and its contents are copyright of the Loughs Agency ©2012 6.0 CONSERVATION AND PROTECTION SUMMARY • In 2011 within the Fairywater catchment there were 48 patrols • There were 33 angling license checks within the Fairywater catchment in 2011. • There were 2 joint patrols in the Fairywater catchment in 2011 with local angling association personnel. • There were 74 site/premise visits within the Fairywater catchment in 2011. • There were no In‐channel and riparian habitat improvements conducted within the Fairywater catchment in 2011 • There were no seizures in the Fairywater catchment in 2011.
Conservation and Protection The Fairywater catchment is within the Loughs Agency Southern zone. The Southern crew is responsible for the conservation and protection of their zone in addition to other duties throughout the Foyle area. The Southern crew is composed of 1 senior fishery officer and 3 fishery officers. Each crew is responsible for amongst other tasks conducting a wide variety of conservation and protection duties including direct fishery protection, anti poaching patrols, license checks, pollution monitoring, redd counting, electrofishing and assisting with other stock assessments. Crews will liaise with staff and volunteers from relevant government departments and angling associations to ensure water quality is maintained and to monitor all potential impacts on the fishery and aquatic resources.
Page 33 of 36
COPYRIGHT © 2012 LOUGHS AGENCY OF THE FOYLE CARLINGFORD AND IRISH LIGHTS COMMISSION
6.1
CREW REPORT ON 2011
There were a few minor pollution incidents in the Fairywater catchment during 2011. These were predominantly from agriculture and consisted mainly of run‐ off from yards and fields. There were no habitat enhancement schemes carried out in this catchment during 2011. It is hoped to identify areas which would benefit from such schemes for consideration during 2012/2013.
7.0
CATCHMENT INITIATIVES
Integrated catchment management planning can only be delivered through the development of true partnerships between statutory and non statutory partners. An understanding of desired outcomes and methods of delivery is essential in matching requirements and expectations to actions. Exemplar catchment management planning is an iterative process developed and refined over time between parties who have fostered and developed productive working relationships. Environmental legislation in tandem with societal requirements dictates that steps are taken to improve our natural habitats. From an aquatic perspective the Water Framework Directive is the key driver towards integrated management of our aquatic environments. The Loughs Agency acknowledges this and is eager to encourage participatory approaches as a way to effectively and efficiently meet challenging objectives. In 2012/13 and beyond the Loughs Agency will aim to engage local stakeholders in participating in river corridor litter picks, the development of habitat improvement works and Sea trout monitoring programmes. We will also facilitate wider stakeholder engagement through participation in the CIRB invasive species project aimed at controlling Invasive Non Native Species and in supporting stakeholder events by providing premises for events. If you are a member of an organisation which may be interested in working on collaborative conservation and protection projects within the Fairywater Page 34 of 36
COPYRIGHT © 2012 LOUGHS AGENCY OF THE FOYLE CARLINGFORD AND IRISH LIGHTS COMMISSION
catchment please contact art.niven@loughs‐agency.org to discuss potential projects.
8.0
ACTIONS FOR 2012/2013
• Implement actions from the Trout Strategy once fully adopted • Conduct annual audit point monitoring programme • Conduct habitat improvement projects • Conduct water quality monitoring programme • Organise a river clean up event and engage stakeholders in collaborative projects • Continue to screen all planning applications within the Fairywater and catchment for potential impacts to the fishery and aquatic resources • Continue to maintain the high standards of conservation and protection within the Fairywater catchment • Target all areas/individuals brought to Loughs Agency attention • Conduct annual fish population surveys and spawning surveys Page 35 of 36
COPYRIGHT © 2012 LOUGHS AGENCY OF THE FOYLE CARLINGFORD AND IRISH LIGHTS COMMISSION
• Conduct ongoing pollution monitoring and investigate areas highlighted as being of concern • Develop potential habitat improvement projects including riparian buffer zone creation, fencing, native species planting and in‐channel habitat improvements including spawning bed and nursery habitat improvement • Monitor forestry operations adjacent to watercourses or areas likely to impact on watercourse
Page 36 of 36