TRENDS IN RACIAL/ETHNIC AND ECONOMIC SCHOOL SEGREGATION, 1991-2020
Ann Owens, sean f. reardon, Demetra Kalogrides, Heewon Jang, and Thalia Tom
KEY FINDINGS
U.S. schools remain highly segregated by race/ethnicity and economic status.
Most school segregation occurs between school districts, rather than between schools in the same district.
However, within-district racial/ethnic and economic segregation accounted for a growing share of total segregation over time.
In large school districts, White-Black and White-Asian segregation have increased substantially since 1991, while White-Hispanic segregation declined since the late-2000s.
Economic school segregation has increased nearly 50% since 1991 and over 30% since 1998 in large school districts.
Seventy years after legal decisions like Mendez v. Westminster and Brown v. Board of Education outlawed separate school systems on the basis of race, school segregation in the U.S. persists, with pernicious consequences for educational equity. Racial/ethnic and economic school segregation exist today due to largescale migration patterns, local residential segregation, and parents’ school enrollment choices. In this brief, we describe racial/ethnic and economic school segregation over the past three decades. Using the Longitudinal School Demographic Dataset, we estimate segregation among all regular, non-virtual public schools in the U.S.1 We first estimate segregation between students in the same grade to account for different demographic patterns and school capacity across grades, and we then average the grade-level estimates, weighting by grade enrollment of the relevant
groups (e.g., White + Black students), to generate nationaland school district-level segregation estimates.
There are two broad approaches to measuring segregation. First, exposure indices measure the school composition that the average student is “exposed” to — e.g., a BlackWhite exposure value of 0.27 implies that the average Black student attends a school that is 27% White. Interpreting exposure indices as measures of segregation is difficult without knowing the racial/ethnic composition of the population. The U.S. school population has become more racially and ethnically diverse and poorer over the past several decades, so we would expect — all else remaining equal — all students to be exposed to fewer White and more Hispanic students, in particular, and to more poor students over time. Hispanic-Hispanic exposure may therefore increase even while every school gained proportionally equal shares of Hispanic students.
Therefore, to measure trends over time, we use the second approach to measuring segregation — evenness indices Evenness indices evaluate how (un)evenly students of different racial/ethnic or economic groups are enrolled across schools, given their relative presence in the population. Specifically, we use the normalized exposure index, which compares two groups’ exposure to one of the groups. The White-Black normalized exposure index, for example, compares the proportion of White students in the average White student’s school to the proportion of White students in the average Black student’s school — ignoring the presence of other groups (i.e., proportion White = White students/(White + Black students)). A White-Black normalized exposure index of 0.5 would mean that the proportion of White students, as a share of total White and
1 The Longitudinal School Demographic Dataset draws on the National Center for Education Statistics’ Common Core of Data. Our team imputed missing and implausible race/ethnicity and free or reduced-price lunch data, improved school linkages over time, and geocoded charter schools to their geographic districts, among other data quality improvements. For more information, visit socialinnovation.usc.edu/segregation
Black student enrollment, in the average White student’s school is 0.5 points higher than in the average Black student’s school (on a scale from 0 to 1).
NATIONAL TRENDS IN RACIAL/ETHNIC AND ECONOMIC SCHOOL SEGREGATION
Figure 1 presents trends in racial/ethnic segregation among all public schools in the U.S. from the 1991-92 to 2020-21 school years.2

Nationally, White-Black school segregation increased slightly (by about 3%) from 1991 to 2000 and changed little from 2000 to 2020 — with small declines in the 2000s offset by small increases since 2010. By 2020, White-Black segregation was higher than segregation between White students and other groups — the share of White students (relative to Black students) in the average White student’s school was 0.52 higher than in the average Black student’s school. White-Hispanic segregation was highest in 1991 but decreased by 10% by 2020. The normalized exposure index was still high — 0.49 — in 2020. White-Asian segregation remains lower than segregation between other groups, though it increased the most, by 27%, from 1991-2020 3
We next turn to trends in economic school segregation. Schools do not report data on students’ family income or parents’ education, common definitions of socioeconomic status. Instead, they report eligibility for the National
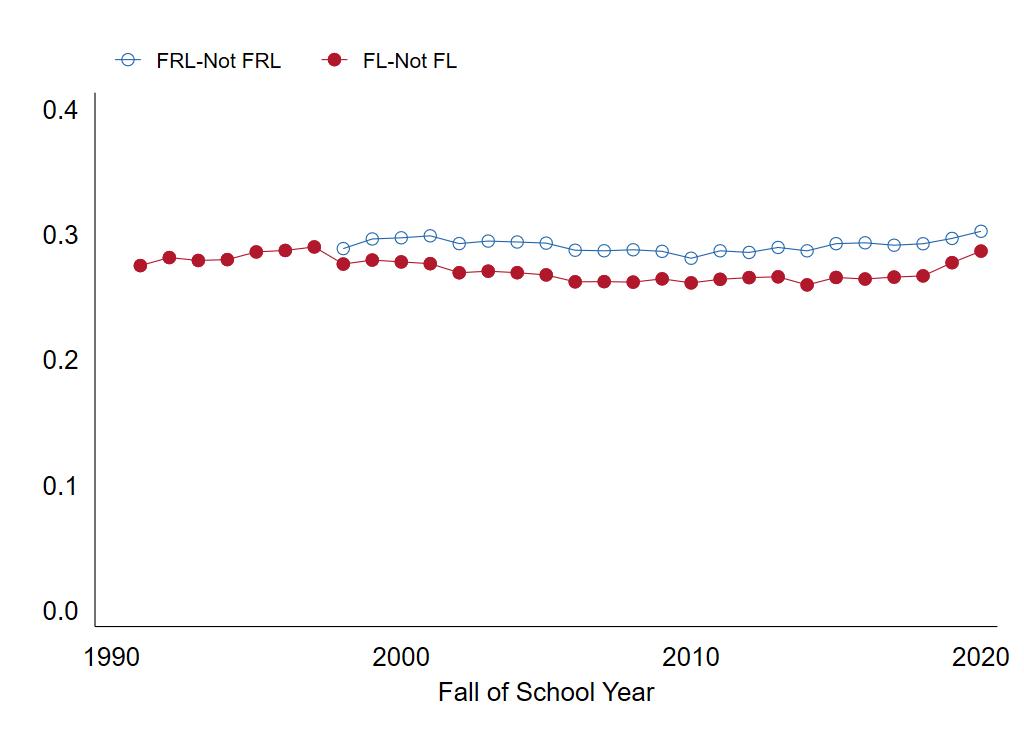
School Lunch Program, for either free lunch (FL, family income <130% of the federal poverty threshold for their family size) or reduced-price lunch (family income <185% of that threshold; reported since 1998). Figure 2 presents national trends in economic school segregation between students that are FL eligible and ineligible or free or reduced-price lunch (FRL) eligible and ineligible. Nationally since 1998, FRL-nonFRL segregation ranged from 0.28 to 0.30. The value of 0.30 in 2020 means that the FRL rate was 30 percentage points higher in the average FRL eligible student’s school than in the average ineligible student’s school. FL-non-FL segregation declined sharply in 1998, the first year of reporting reducedprice eligibility — this suggests some schools may have been reporting reduced-price eligibility as FL eligibility prior to 1998. From 1998 to 2020, FL-non-FL segregation increased by about 0.01, to 0.29

SCHOOL SEGREGATION WITHIN SCHOOL DISTRICTS
Nationally, both racial/ethnic and economic segregation between schools have persisted over the past several decades and remained high in 2020. National measures capture differences in school composition across all schools in the U.S. This masks variation in composition across states, metropolitan areas, and school districts. For example, in 2019, the public school population in West Virginia was 2% Hispanic and 89% White, compared to 62% Hispanic and
2 Note that 2020 data may reflect some enrollment anomalies due to COVID-19
3 Note that after 2009-10, the Asian category includes Pacific Islander and Hawaiian Native students. It is not clear how (or if) schools counted these students prior to 2010
FIGURE 3: SHARE OF NATIONAL SCHOOL SEGREGATION OCCURRING BETWEEN SCHOOL DISTRICTS, 1991 TO 2020

23% White in New Mexico. Large-scale immigration and internal migration flows are thus reflected in the patterns of national racial/ethnic segregation between schools. The decline in White-Hispanic segregation since 1991 is due in part to the migration of Hispanic families to a greater number of areas than traditional immigrant destinations.
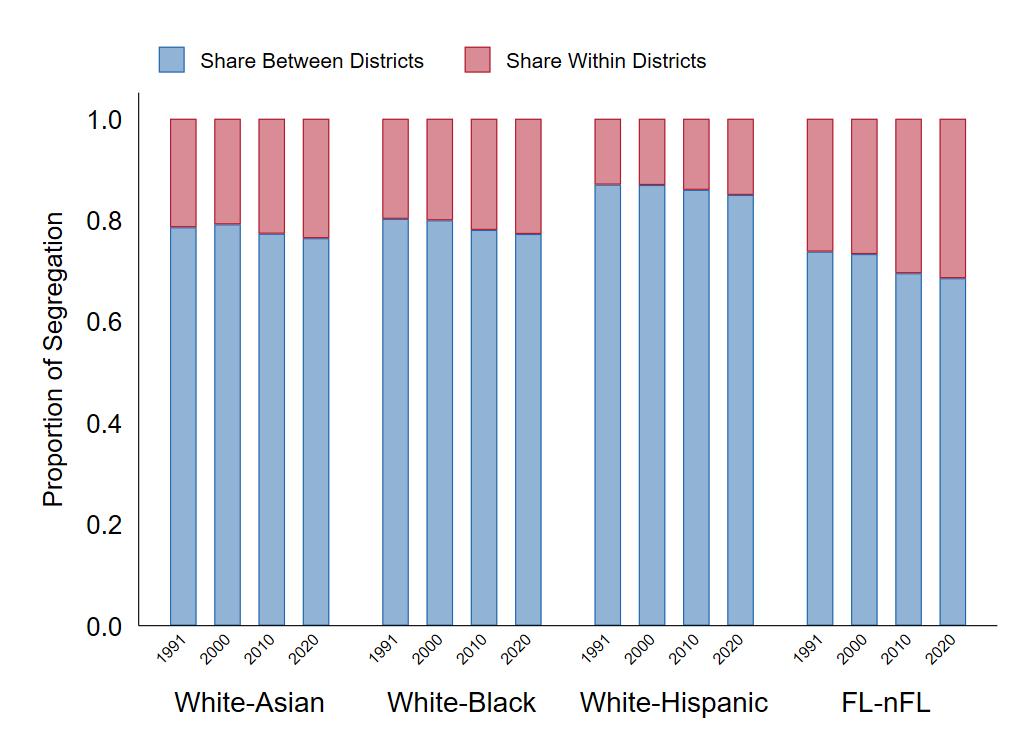
Therefore, we next examine how much of total school segregation in the U.S. is due to segregation between school districts. The U.S. is divided into over 13,000 school districts, each of which enrolls the students living in its local geographic area. School districts are important jurisdictional, geographic, and social boundaries for educational equity; school districts are the locus of school funding, curricular decisions, and enrollment policies. They are also bright lines that parents consider when deciding where to live and whether to enroll their child in local public schools. Our segregation measure can be decomposed into the sources of unevenness — e.g., whether students are unevenly enrolled by race/ethnicity between districts or between schools, within districts. Figure 3 presents the share of total racial/ethnic segregation between schools (presented in Figure 1) that occurs between school districts (blue portion of the bar) and within school districts (red portion) over time.4
The vast majority of total segregation between schools in the U.S. is due to sorting between school districts. While the share has declined slightly over time, over 85% of WhiteHispanic and over 75% of White-Asian and White-Black segregation occurs between districts — due to differences in school districts’ racial/ethnic compositions — in all years from 1991 to 2020
The remaining share of racial/ethnic segregation is due to students sorting between schools within school districts on the basis of race/ethnicity. We examine White-Black, White-Hispanic, and White-Asian segregation within the 100 school districts that enrolled the most Black, Hispanic, and Asian students, respectively, in 2019 5 Within-district segregation compares exposure between groups only among schools in that district, accounting for the fact that between-district segregation produces districts with very different compositions (e.g., Los Angeles Unified School District was 74% Hispanic and 11% White in 2019, while the neighboring Beverly Hills Unified School District was !% Hispanic and 69% White).
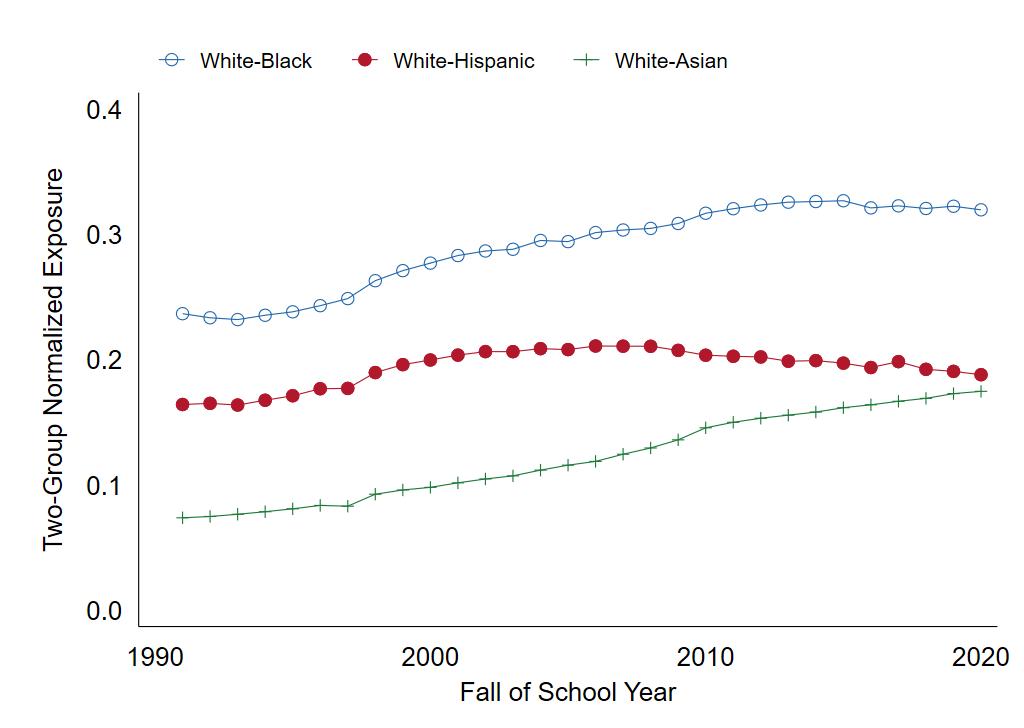
FIGURE 4: AVERAGE WITHIN-DISTRICT TRENDS IN RACIAL/ETHNIC SCHOOL SEGREGATION, 100 DISTRICTS ENROLLING THE MOST STUDENTS FROM EACH NONWHITE GROUP, 1991 TO 2020

Figure 4 presents the average trends in racial segregation in the 100 districts enrolling the most students from each non-White group. White-Black segregation is highest and increased by 35% from 1991 to 2020. White-Asian
4 Our sample includes charter schools, which may comprise their own local educational agency. We geocode charter schools and link them to their geographic school district.
5 We use 2019 enrollment rather than 2020 to avoid COVID-19-related enrollment anomalies and because school geocoordinates have not yet been published for 2020, so our geographic district identifier relies on 2019 data. The 100 districts enrolling the most Black students accounted for 44% of all Black students in U.S. public schools in 2019; the figures for Hispanic and Asian students are 37% and 44%, respectively.
3 Trends in Racial/Ethnic and Economic School Segregation, 1991-2020

segregation experienced a larger increase — more than doubling from 0.07 to 0.17. By 2020, White-Asian segregation in districts serving the most Asian students was nearly as high as White-Hispanic segregation in districts serving the most Hispanic students, on average. White-Hispanic segregation increased until the late 2000s and was 7% lower in 2020 than 2010. While segregation between districts accounts for the bulk of racial/ethnic school segregation in the U.S., the share occurring within districts increased over time, and White-Black and WhiteAsian segregation in large districts increased sharply over the past three decades.
Like racial segregation, most economic segregation occurs between school districts, due to school districts disproportionately enrolling either higher- or lowerincome students. However, the share of economic school segregation occurring within school districts increased from 26% in 1991 to 31% in 2020, as Figure 3 shows for FL segregation (the trend is similar for FRL segregation). We therefore examine segregation trends within the 100 districts serving the most FL or FRL eligible students in 2019
Economic segregation within large school districts increased considerably during this time. In 1991, the FL rate in the average FL eligible student’s school was 14 percentage points higher than in the average non-FL eligible student’s school in the same district. By 2020, segregation had increased by 47% to a gap of 21 percentage points in FL rates. The within-district gap in FRL rate between FRL eligible and ineligible students’ schools increased from 17 to 22 percentage points from 1998 to 2020. Since 1998, FL segregation has increased by 40% and FRL segregation has increased by 33%. While most economic segregation still occurs between districts, there are large and growing differences in the economic composition of higher- and lower-income students’ schools within the 100 districts serving the most low-income students.
CONCLUSIONS
Racial/ethnic and economic school segregation remained high in 2020. Most segregation occurred between school districts, creating challenges for policymakers. Individual school districts cannot control enrollment patterns across their boundaries, and past legal decisions thwart mandatory integration between school districts. However, the share of segregation occurring within districts has increased, and White-Black, White-Asian, and economic segregation have increased strikingly in large districts since 1991. Our findings, then, highlight the pressing need for school districts to act in ways they can control — voluntary integration programs, socioeconomic-based student assignment policies, and school choice policies that affirmatively promote integration. School segregation reflects inequality of opportunity and leads to inequality in outcomes. Monitoring and mitigating it, nearly seventy years after the landmark decision in Brown v. Board of Education, remains an urgent task for scholars and policymakers.
