REPUBLIC OF IRAQ Table 1
Key conditions and challenges
2020
P o pulatio n, millio n
40.2
GDP , current US$ billio n
153.7
GDP per capita, current US$
3823.4 a
14.8
a
52.4
Lo wer middle-inco me po verty rate ($ 3.2) Upper middle-inco me po verty rate ($ 5.5) Natio nal po verty rate
a
22.5
a
29.5
Gini index
Scho o l enro llment, primary (% gro ss)
b
b
108.7 70.6
Life expectancy at birth, years To tal GHG Emissio ns (mtCO2e)
229.4
Source: WDI, M acro Poverty Outlook, and official data. (a) M ost recent value (201 2), 201 1 PPPs. (b) WDI for School enrollment (2007); Life expectancy (201 9).
Economic growth is gradually recovering following last year’s pandemicrelated contraction, partly due to higher non-oil activity. Improved global oil market conditions are expected to reinforce growth in the medium term and to turn the fiscal and external balances to surpluses from 2021, and to reverse the recent surge in debt. Key downside risks relate to potential pandemic developments, oil price volatility, setbacks in the security situation, and the derailing of economic reform implementation.
Iraq is one of the most oil-dependent countries in the world. Over the last decade, oil revenues accounted for more than 99 percent of exports, 85 percent of government budget, and 42 percent of GDP. This excessive dependence on oil exposes the country to macroeconomic volatility while budget rigidities, linked to growing wage bill and transfers, restrict fiscal space and opportunities for counter cyclical policy. The COVID-19 pandemic had a significant impact on Iraq’s GDP in 2020, which contracted by 15.7 percent, and its budget revenues which shrank by 9 percentage points to 32 percent of GDP, leading to a severe reduction in public spending and investments. As of January 2021, the unemployment rate was more than 10 percentage points higher than the pre-pandemic level of 12.7 percent. Unemployment among the displaced, returnees and women jobseekers, and those pre-pandemic selfemployed and informal workers remains elevated. Food security concerns remained despite the recent upward trend in the share of households receiving public and private transfers including ration food from the Public Distribution System. Access to healthcare, including COVID-19 testing and vaccines continues to be a struggle for many Iraqis. While Iraq’s economic conditions are gradually improving as international oil
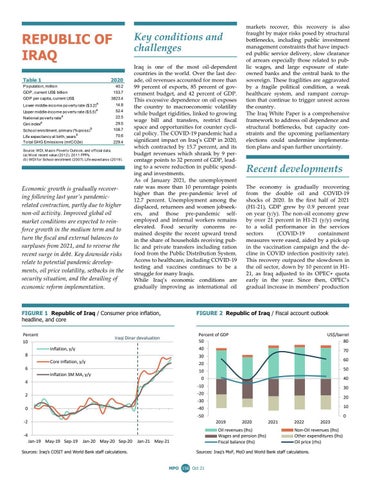
FIGURE 1 Republic of Iraq / Consumer price inflation, headline, and core Percent 10
markets recover, this recovery is also fraught by major risks posed by structural bottlenecks, including public investment management constraints that have impacted public service delivery, slow clearance of arrears especially those related to public wages, and large exposure of stateowned banks and the central bank to the sovereign. These fragilities are aggravated by a fragile political condition, a weak healthcare system, and rampant corruption that continue to trigger unrest across the country. The Iraq White Paper is a comprehensive framework to address oil dependence and structural bottlenecks, but capacity constraints and the upcoming parliamentary elections could undermine implementation plans and span further uncertainty.
Recent developments The economy is gradually recovering from the double oil and COVID-19 shocks of 2020. In the first half of 2021 (H1-21), GDP grew by 0.9 percent year on year (y/y). The non-oil economy grew by over 21 percent in H1-21 (y/y) owing to a solid performance in the services sectors (COVID-19 containment measures were eased, aided by a pick-up in the vaccination campaign and the decline in COVID infection positivity rate). This recovery outpaced the slowdown in the oil sector, down by 10 percent in H121, as Iraq adjusted to its OPEC+ quota early in the year. Since then, OPEC’s gradual increase in members’ production
FIGURE 2 Republic of Iraq / Fiscal account outlook
Percent of GDP 50
Iraqi Dinar devaluation
US$/barrel 80
40
Inflation, y/y
8
70
30
Core inflation, y/y
60
20
6 Inflation 3M MA, y/y 4
10
50
0
40
-10
30
-20
2
20
-30
10
-40
0
-50
-2
0 2019
Oil revenues (lhs) Wages and pension (lhs) Fiscal balance (lhs)
-4 Jan-19 May-19 Sep-19
Jan-20 May-20 Sep-20
Sources: Iraq’s COSIT and World Bank staff calculations.
2020
Jan-21 May-21
2021
2022
Non-Oil revenues (lhs) Other expenditures (lhs) Oil price (rhs)
Sources: Iraq’s MoF, MoO and World Bank staff calculations.
MPO 156 Oct 21
2023
quotas has allowed oil GDP to grow. Iraq’s headline and core inflation in JanJul 2021 reached 5.2 and 6.3 percent (y/y), respectively, owing to the increased domestic demand coupled with the effect of the 23 percent devaluation which took place last December. The pickup in inflation was dampened by lower import prices due to the depreciation of the Turkish and Iranian currencies, the main import partners of Iraq. Fiscal data for H1-21 shows important gains in budgetary revenues (up 42 percent y/y) as average oil export prices trended above US$64/barrel. These budgetary gains were also compounded by the fiscal effects of last year’s devaluation. Moreover, customs and tax administration reforms outlined in the 2021 budget law have started paying off, contributing to a 53 percent surge in domestic revenue mobilization. This was enough to turn the overall fiscal deficit (cash basis) into a small surplus of 0.6 percent of GDP despite spending rigidities. The fiscal balance calculated on accrual basis is considerably less favorable owing to the large size of unaccounted arears. On the external side, the current account deficit also turned into a surplus of 4.7 percent of GDP in Q1-21 (y/y), after a 6
percent of GDP deficit in 2020, due to a 66 percent (y/y) decline in imports, mainly related to private sector imports. As a result, gross official reserves increased by almost US$5 billion to reach US$58.5 billion in Q1-21 compared to US$54 billion at end-2020.
Outlook The prospects of Iraq’s economy have improved with the recovery in global oil markets, but the spread of new COVID-19 variants and climate change challenges are significant headwinds. The economy is forecast to gradually recover on the back of rising oil prices and OPEC+ production quotas which are planned to be phased out in 2022. Oil GDP will be the main driver of growth in the medium term. Non-oil GDP is forecast to recover but remain under 3 percent on average in 2021 -23 due to the impact of the new COVID19 Delta variant along with water and electricity shortages that impact agriculture and industries. Under this scenario, the fiscal balance is forecast to remain in surplus in the medium term leading the debt-to-GDP ratio to steadily improve.
TABLE 2 Republic of Iraq / Macro poverty outlook indicators
Real GDP growth, at constant market prices Private Consumption Government Consumption Gross Fixed Capital Investment Exports, Goods and Services Imports, Goods and Services Real GDP growth, at constant factor prices Agriculture Industry Services Inflation (Consumer Price Index) Current Account Balance (% of GDP) a Net Foreign Direct Investment (% of GDP) a Fiscal Balance (% of GDP)a Debt (% of GDP)a Primary Balance (% of GDP) a GHG emissions growth (mtCO2e) Energy related GHG emissions (% of total)
The surge in poverty will gradually reverse with the economic recovery and mass vaccination. However, the disproportional impact of COVID-19 on the pre-pandemic poor and vulnerable groups and the resulting inequality will be felt for a long time to come. The diverging trends between groups and regions that overlaps with Iraq’s existing ethnic and religious divisions makes the situation more precarious and calls for appropriate planning in the recovery phase, including in the implementation of an equitable vaccination program. Iraq’s economic outlook is mired by significant downside risks that call for accelerated implementation of structural reforms. These include: a potential decline in the oil price, a worsening COVID-19 crisis due to the spread of new variants, a deterioration in security conditions, the intensification of climate change shocks and additional macroeconomic volatility. Averting or mitigating the impact of downside risks depends on the policies of the future government and commitment to comprehensive reforms in line with those envisioned in the GoI White Paper. Progress on regional economic integration together with an improved security environment could provide new momentum for growth and diversification.
(annual percent change unless indicated otherwise) 2018 1.7 2.3 17.7 -75.4 6.3 16.6 2.6 37.7 -1.6 10.7 0.4 9.8 2.2 11.0 48.6 12.1 3.8 71.1
2019 5.2 1.5 25.2 -13.8 4.6 28.4 6.0 46.2 7.5 -0.7 -0.2 5.6 1.4 1.3 44.4 2.4 11.4 72.5
2020 -15.7 -9.0 -10.6 -40.0 -15.8 -9.4 -15.7 4.5 -16.9 -15.3 0.6 -5.8 1.8 -6.5 64.5 -5.3 -2.6 73.8
2021 e 2.6 2.0 5.3 10.0 3.0 3.0 2.6 4.0 2.9 1.7 7.5 4.8 1.7 1.5 55.0 2.9 4.5 74.7
So urce: Wo rld B ank, P o verty & Equity and M acro eco no mics, Trade & Investment Glo bal P ractices. Emissio ns data so urced fro m CA IT and OECD. No tes: e = estimate, f = fo recast. NA (a) Share o f facto r co st GDP .
MPO 157 Oct 21
2022 f 7.3 2.5 3.1 8.0 10.2 3.0 7.3 4.5 9.7 2.1 3.5 5.9 1.7 4.0 47.4 5.9 10.9 75.3
2023 f 6.3 3.0 3.0 8.0 8.2 3.5 6.3 4.8 7.9 2.6 3.1 5.2 1.7 3.2 42.5 5.6 9.0 75.2