we head into the thick of the growing season, you can feel things picking up all across Pennsylvania. Mowers are running, crews are back at it, and the long days are here. This is the time of year when all the planning and prep work from the winter starts to pay off—or at least gets put to the test—on golf courses, athletic fields, campuses, and properties across the state.
Spring always keeps us on our toes. One week it’s wet, the next it’s dry, and temperatures never seem to settle where we want them. On top of that, expectations don’t get any lower. Whether it’s golfers, coaches, students, or the public, people expect great conditions every day. That’s just the reality of the work we do. It’s not always easy, and it definitely doesn’t slow down this time of year.
That’s where the Pennsylvania Turfgrass Council comes in. At its core, PTC is here to support the men and women doing the work every day. We’re focused on helping you stay sharp, solve problems, and keep up with changes in the industry. From funding research to putting on educational events and keeping an eye on regulations that affect how we do our jobs, our goal is to make sure you have the tools and information you need.
The challenges we face aren’t getting any simpler. Between pests, weather, budgets, and increasing pressure to do more with less, it helps to have a network of people who understand exactly what you’re dealing with.
Some of the most valuable parts of PTC are the connections you make. Whether it’s at a field day, a meeting, or just talking shop with another member, there’s a lot to learn from each other. Sometimes the best advice doesn’t come from a book—it comes from someone who’s been through the same situation and figured out what works.
As things ramp up, I’d encourage you to stay involved. Show up when you can, share what you know, and don’t hesitate to lean on the group when you need help. That’s what this organization is all about.
On behalf of the Council, thanks for everything you do. This work isn’t always seen or appreciated the way it should be, but it matters. The fields we manage and the spaces we care for play a big role in our communities, and that’s something to be proud of.
Here’s to a safe, busy, and successful season.
Sincerely,
Tom Bettle President, Pennsylvania Turfgrass Council
How Variability Within and Between Natural Turfgrass and Synthetic Athletic Fields Impacts Athlete Safety and Performance
By: Ava Veith; Dr. David McCall; Dr. Chase Straw; Dr. Daniel Sandor; Dr. Jay Williams; Elisabeth Kitchen; Kevin Hensler; Aaron Tucker; Dr. Caleb Henderson
Authors Note and Context
Ava Veith is a Ph.D. student in the Department of Plant Science at Penn State University under the advisement of Dr. Chase Straw, where her research focuses on studying within-field variability and athlete–surface interactions. However, the research presented in this article was conducted during her master’s program at Virginia Tech under Dr. David McCall.
This study served as a foundational investigation into how variability within and between natural turfgrass and synthetic turf athletic fields influences athletes. The findings from this work have shaped the direction of subsequent doctoral research. Building on this foundation, the planned Ph.D. project aims to examine athlete lower-limb joint biomechanics across natural turfgrass, synthetic turf, and hybrid (natural turfgrass reinforced with synthetic fibers) surfaces using multi-segment inertial measurement units.
At the conclusion of this article, the next phase of research will be briefly outlined to demonstrate how it has grown from the master’s study. In this way, the Virginia Tech study presented here represents both a completed project and the starting point for a broader, ongoing effort to better understand how the playing surface can affect athlete movement and injury-relevant mechanics.
Introduction
A safe playing surface is essential for athletic competition. Natural turfgrass and synthetic turf are common playing surfaces used for field sports, and extensive research has been conducted to compare these two surface types. However, limited attention has been given to within-field variability and its impact on athlete safety and performance. Studies often classify athletic fields broadly as synthetic or natural, overlooking critical surface metrics that fluctuate both within and between fields.
Key field characteristics such as surface hardness, rotational resistance, soil moisture, thatch depth, and infill depth (for synthetic fields) play a crucial role in assessing field quality. Variability in these factors can be influenced by environmental conditions, management practices, and field usage patterns. Despite the known importance of these factors, current research often fails to account for field-specific inconsistencies, limiting the effectiveness of broad comparisons between surfaces.
To improve field safety and optimize athlete performance, interdisciplinary collaboration among turfgrass scientists, sports scientists, and sports medicine professionals is necessary. Evidence-based field management strategies must be developed to ensure more consistent playing conditions, reducing the risk of injury. Wearable technologies such as STATSports GPS trackers (STATSports, 2025) and ankle inertial measurement units (IMUs) (IMeasureU, 2019) provide critical insights into athlete biomechanics, load monitoring, and more. These technologies allow researchers to quantify how different surface conditions influence athletes during performance, offering valuable data for injury prevention strategies.
Beyond data collected by wearable technologies, athlete perceptions of field conditions also play a role in performance and injury risk. Unpredictable surface variability can affect player confidence, movement efficiency, and risk-taking behaviors, making perception-based data collection essential. Understanding how athletes experience and perceive different playing surfaces can inform future improvements in field construction and maintenance.
The objective of this study is to quantify the impact of surface variability on athlete safety and performance, both within and between natural turfgrass and synthetic turf surfaces. This research will quantify how variations in key surface metrics, including surface hardness, rotational resistance, soil moisture, thatch depth, and infill depth, affect athletes utilizing data from wearable technologies, such as STATSports GPS trackers and ankle IMUs. Additionally, to further understand the influence of field surfaces, athletes will be surveyed before and after performing drills to gather insights into their perceptions of how surface variability impacts their performance.
Methodology
Athletic Fields Tested
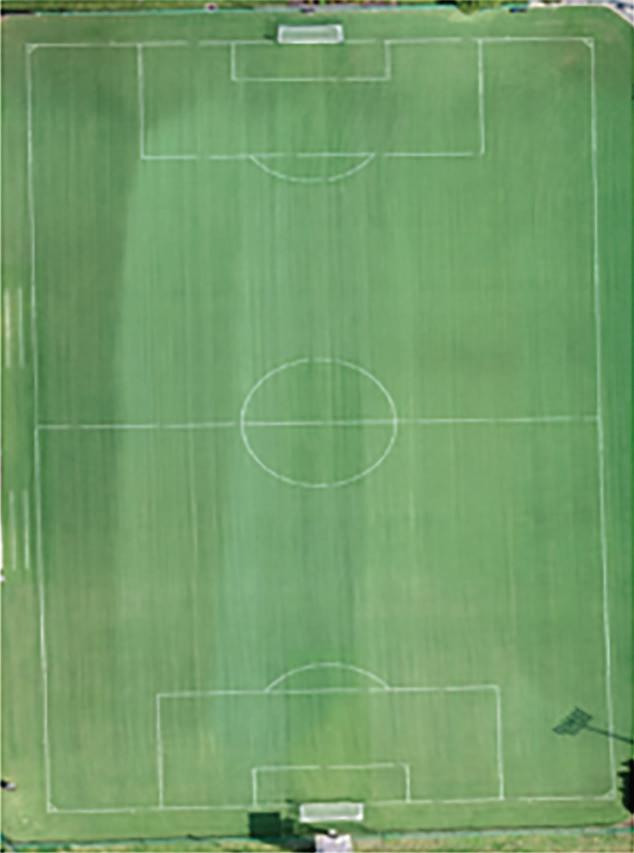
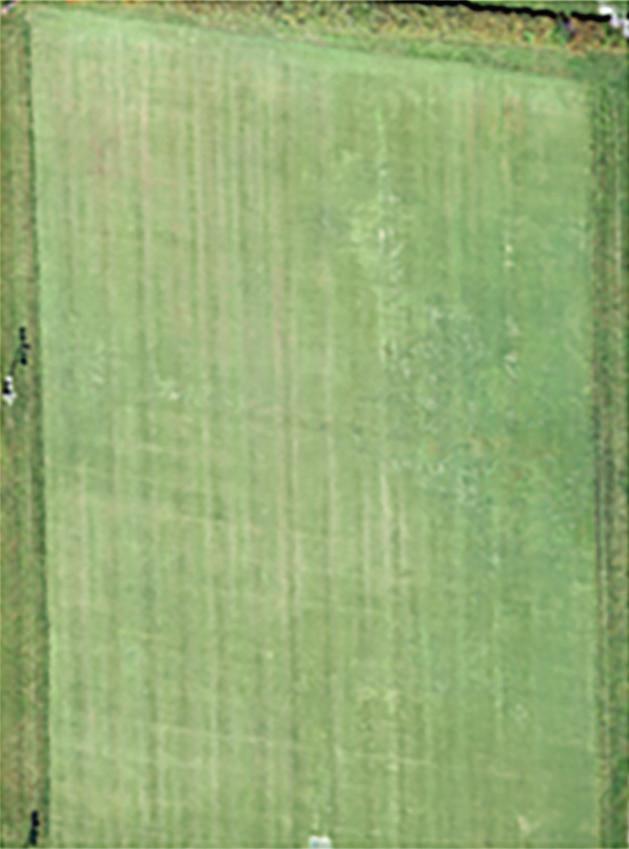
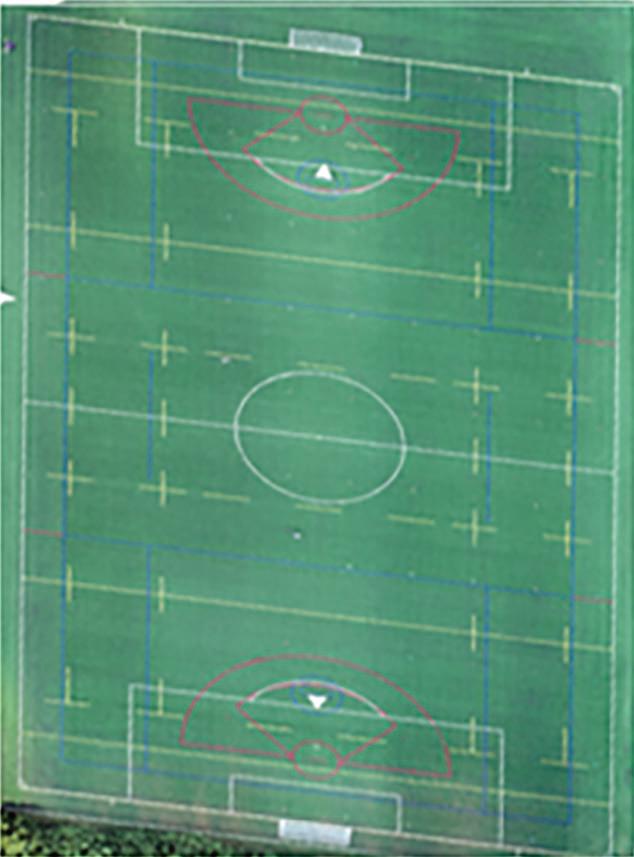
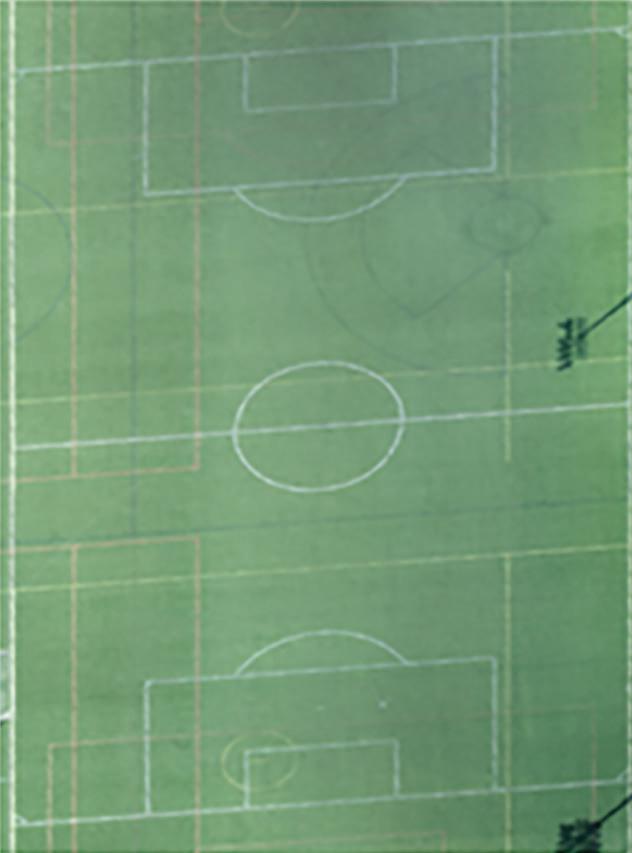
This research was conducted in August of 2024, where four athletic fields on the Virginia Tech campus in Blacksburg, Virginia were studied (Figure 1). Two of these fields were natural turfgrass (bermudagrass), while the other two fields were synthetic turf. For both field types, one field was classified as ‘low usage’, while the other was classified as ‘high usage’. This was determined based on traffic frequency, field age, and management practices.
Preliminary Data Collection
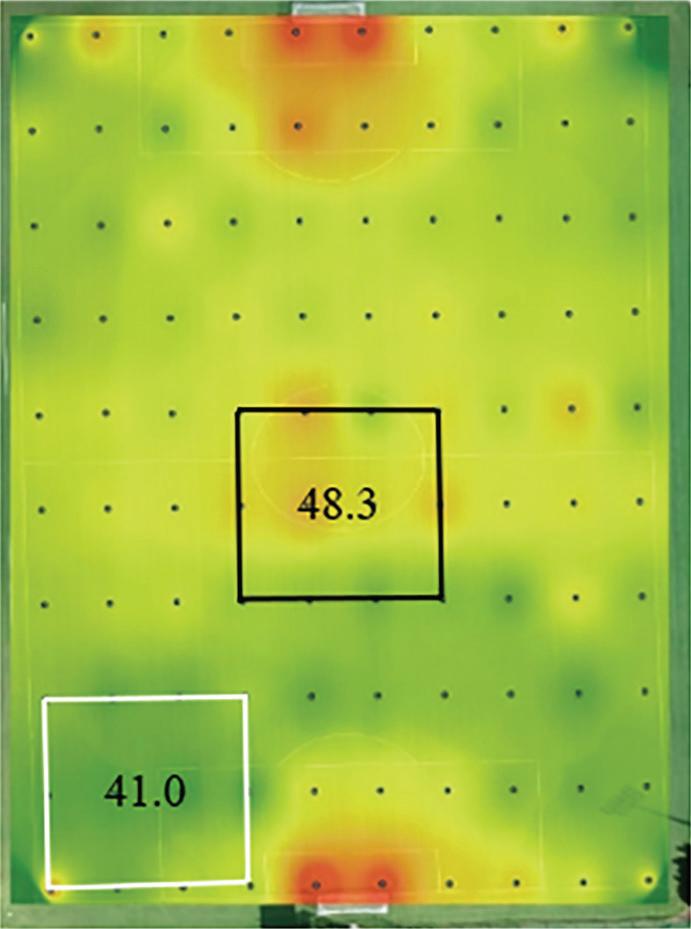
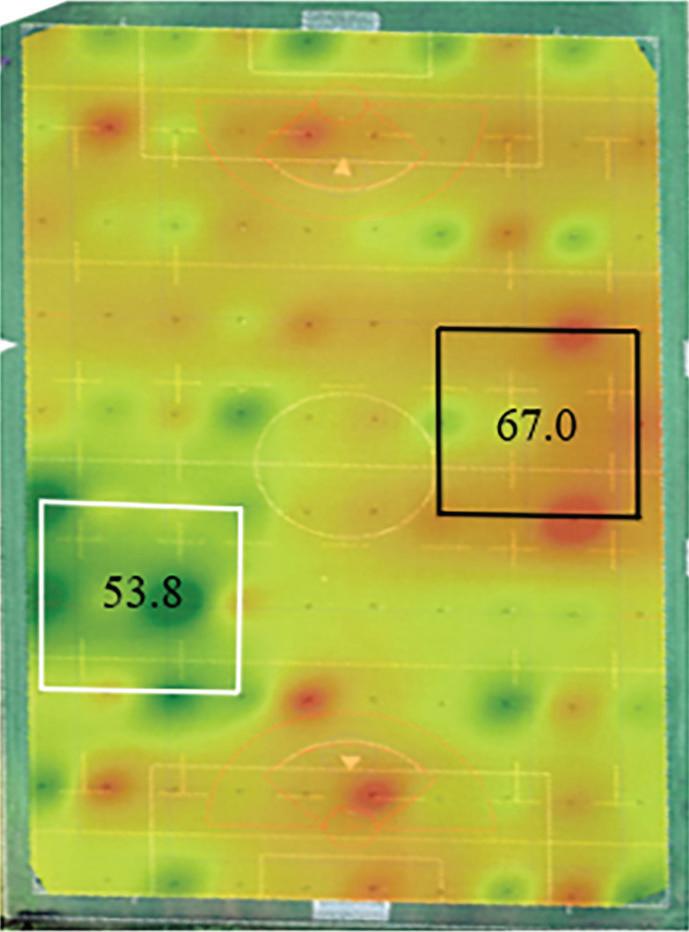
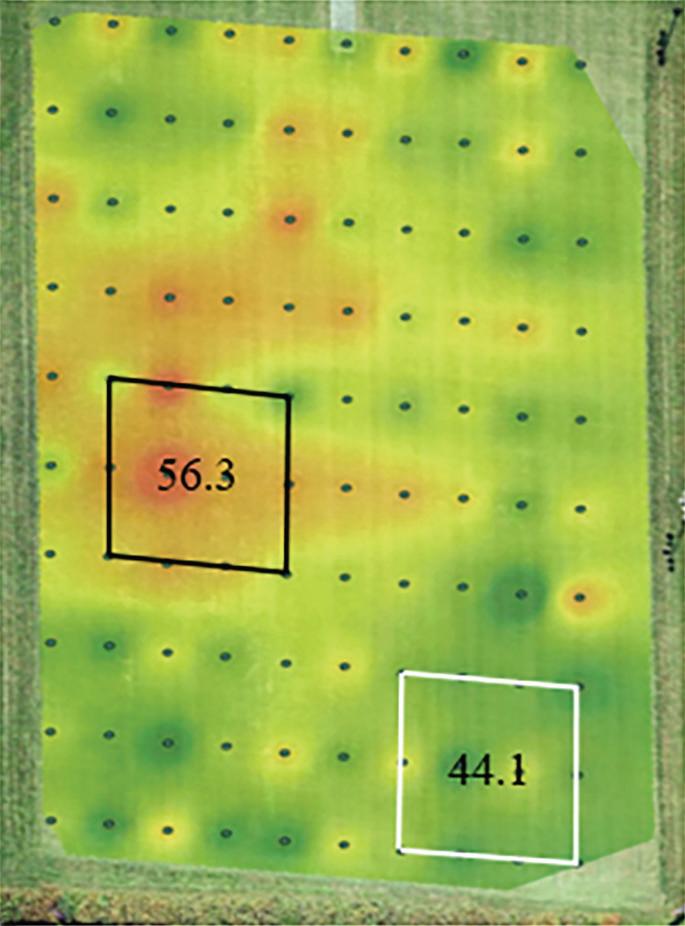
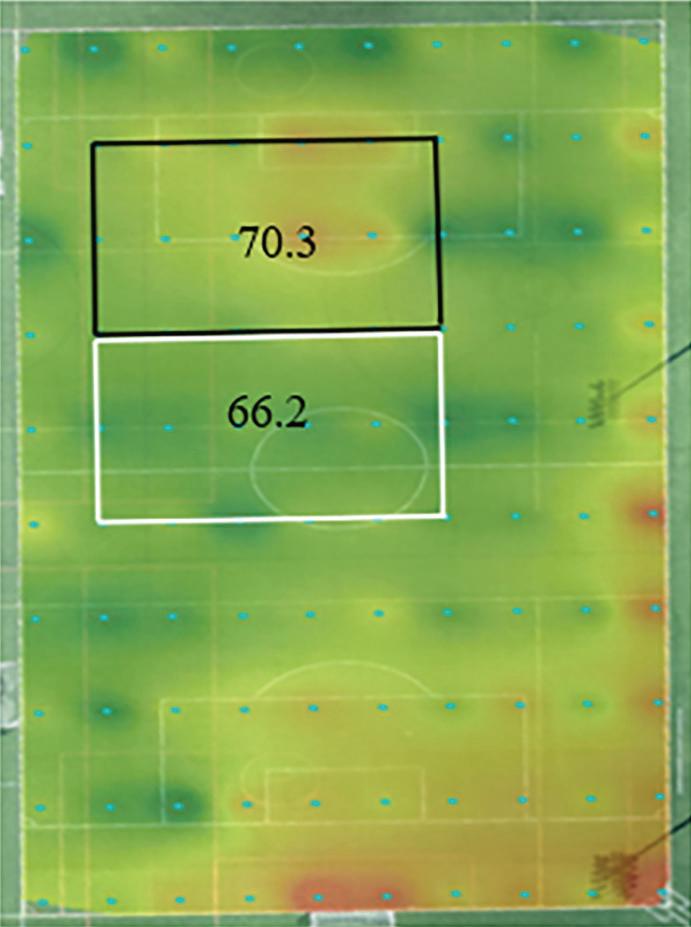
Before live athletes were introduced, surface hardness was assessed on all four fields using a Clegg hammer, with 100 measurements collected per field. The data were then analyzed using ArcGIS Pro to generate surface hardness heatmaps, highlighting variability between and within each field. These maps allowed us to identify specific locations for the athletes to perform drills,
where one selected area within each field was slightly harder than the rest of the field, and the other being slightly softer (Figure 2). Additionally, 20 measurements of rotational resistance (using Deltec’s rotational resistance tester), thatch depth (using a soil profile sampler), soil moisture (using a TDR 350 Soil Moisture Meter), and infill depth (using a Turf-Tec Professional Model Infill Depth Gauge) were taken in both the softer and harder areas to further characterize each field and understand the relationship between surface conditions and athlete performance.
2. Within-field surface hardness (measured in Gmax units) studied across four athletic fields. Drills were performed in each field’s representative black (harder area) and white (softer area) rectangles, with values within each rectangle representing the average surface hardness for that area. The ‘field average’ values reflect the surface hardness across the entire field, while the key in the bottom left of each field indicates the maximum and minimum surface hardness values.
Figure
Low-usage natural turfgrass field
Low-usage synthetic turf field
Figure 1. Drone imagery of all four fields studied.
Low-usage natural turfgrass field
Low-usage
Data Collection During Athlete Involvement
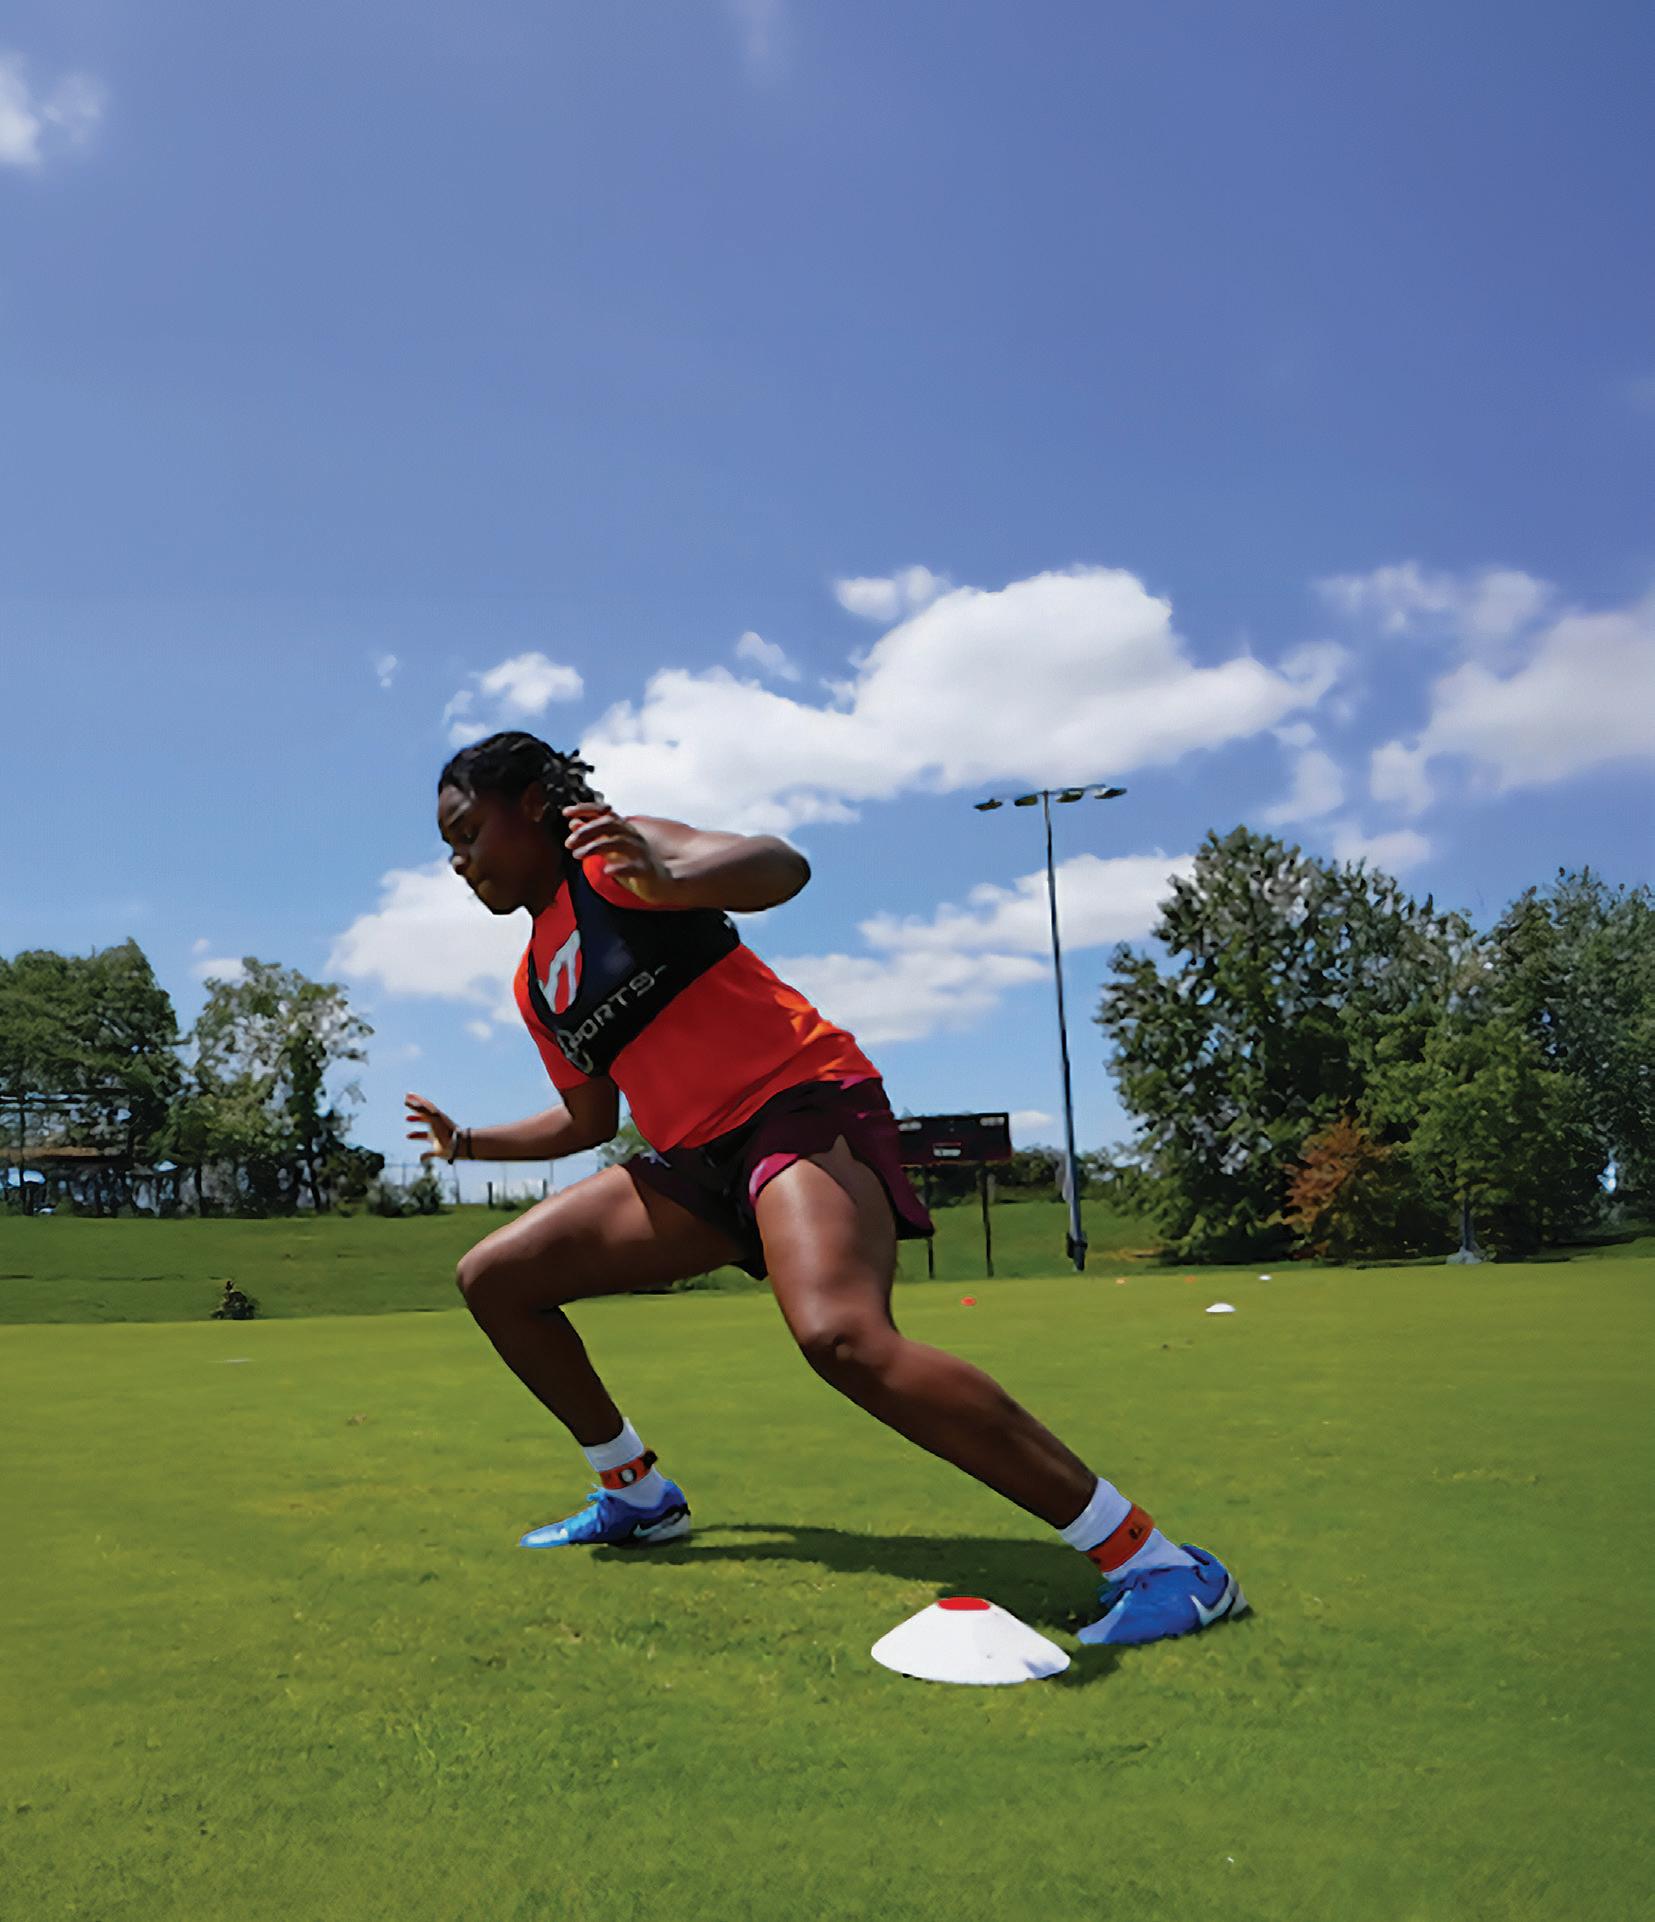
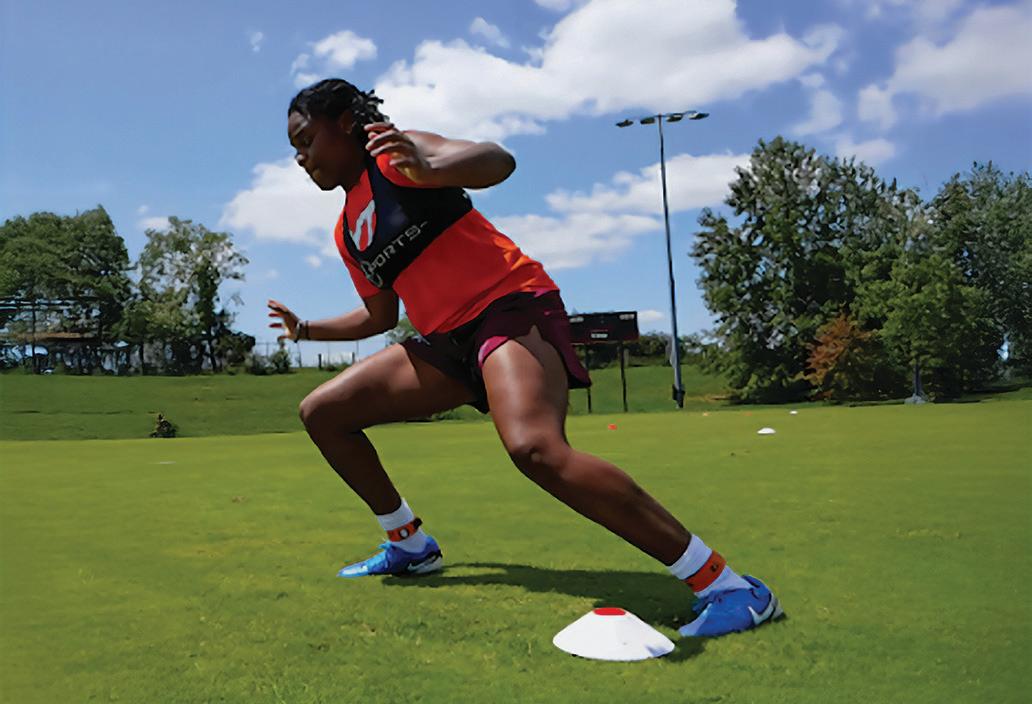
Fourteen female athletes participated in the study, equipped with STATSports GPS devices (to measure running speed) and ankle IMUs (to measure lower limb impact intensity) to quantify their movements during drills (Figure 3). The athletes were each given new Nike cleats prior to participation to eliminate variation based on cleat configuration. They completed three drills, including a drop landing or drop jump drill, a T-drill, and a modified acceleration-deceleration drill, which were designed to replicate common athletic movements. Each drill was performed three times in both the softer and harder areas identified within each field as shown in Figure 2. Additionally, each athlete completed pre- and postperformance surveys designed to capture their perceptions of field quality before and after completing the drills, providing insight into how different surfaces may have influenced their performance.
Results and Discussion
Surface Hardness Data
Heatmaps shown in Figure 2 highlight surface hardness variability within each studied field. Surface hardness data (n = 100 per field) were analyzed using analysis of variance, and means
were separated using Fisher’s protected least significant difference (LSD) test at α = 0.05 to evaluate statistical differences between locations.
Both synthetic turf fields had significantly harder surfaces than the natural turfgrass fields (p < 0.0001), and for both surface types, the high-usage field had a significantly harder surface than the low-usage field (p = 0.0029 for the natural turfgrass fields and p < 0.0001 for the synthetic turf fields). Both synthetic fields tested in this study were not constructed with a shock pad, which is typically placed beneath the layer of material that supports the synthetic fibers and utilized to help replicate the cushioning effect of natural turfgrass. The absence of a shock pad, along with the tendency of synthetic turf to harden over time due to infill material compaction from athlete foot traffic, may explain the harder surface values observed on the synthetic fields compared to the natural fields. Further, increased use or foot traffic on both natural turfgrass and synthetic turf leads to compaction, which causes the playing surface to harden over time. Therefore, it is anticipated that the high-usage fields exhibited higher surface hardness compared to the low-usage fields.
Data Within Each Hard and Soft Area
Resulting rotational resistance, thatch depth, soil moisture, and infill depth (synthetic fields only) measurements taken within each hard and soft area on all four fields are presented in Table 1. These measurements (n = 20 per both hard and soft areas within each field) were analyzed using analysis of variance, and means were separated using Fisher’s protected least significant difference (LSD) test at α = 0.05 to evaluate statistical differences between locations.
Although the fields tested in this research were not professionallevel fields, it is insightful to compare the results in Table 1 with the FIFA natural-pitch rating system (FIFA, 2022). All rotational resistance values fell within FIFA’s ‘excellent quality’ and ‘satisfactory quality’ thresholds, which is important because excessive rotational resistance has been linked to increased lower extremity injuries due to the foot becoming entrapped in the surface during pivoting movements, and too little resistance can increase the risk of slipping. However, soil moisture values exceed 35%, which FIFA classifies as ‘unacceptable quality’. This elevated moisture is likely the primary cause of the low surface hardness values
Table 1. Average rotational resistance, soil moisture, thatch depth, and infill depth data for both areas within each of the four fields studied. Means followed by different letters within the same column are significantly different according to Fisher’s protected least significant difference (LSD) test at α = 0.05.
Figure 3. Athlete performing the ‘T-drill’ with a STATSports GPS unit and ankle IMUs. Photo credits: Virginia Tech Communication and Marketing.
Ankle IMUs
STATSports GPS vest (unit is inside pouch in the back)
observed on the natural turfgrass fields, which were lower than FIFA’s 70-85 Gmax ‘excellent quality’ range.
Additionally, FIFA considers thatch depths over 25 mm as unacceptable, and 10–15 mm satisfactory. Excessive thatch can cause athlete’s cleats to become caught within the surface, increasing knee ligament stress. The low-usage natural turfgrass field had more thatch despite regular maintenance, while the high-usage natural turfgrass field had less, likely due to recent sprigging the summer before. Soft areas in both natural turfgrass fields exhibited higher thatch levels than the hard areas, consistent with previous findings that core cultivation reduces both thatch and surface hardness (McCarty et al., 2007; Atkinson et al., 2012). This supports the understanding that increased thatch can act as a cushioning layer, absorbing impact and thereby reducing surface hardness.
The high-usage synthetic turf field exhibited significantly less infill and greater surface hardness compared to the low-usage synthetic turf field, and the soft areas within both synthetic fields had more infill than the hard areas. This aligns with previous research indicating that infill depth decreases with use, which in turn leads to higher surface hardness (Dickson et al., 2022). Additionally, the low-usage synthetic field exhibited greater variability in infill depth between the selected hard and soft areas,
likely due to its relatively young age (only one year old at the time of the study). Compared to the older high-usage field, which was approximately ten years old, the infill in the low-usage synthetic field had less time to settle, making it more susceptible to displacement from foot traffic (Fleming et al., 2016).
STATSports GPS Unit Data
In our study, STATSports GPS units were securely attached to each athlete’s upper back, as shown in Figure 2. These devices were used to determine if athlete running speed varied based on field type (natural turfgrass or synthetic turf), field usage level (high or low), or hardness (hard or soft areas within each field). However, no statistically significant differences were found. This consistency in speed across conditions is important because running speed can directly affect impact forces and biomechanical measurements. Prior studies have shown that faster running increases the ground reaction force and ultimately lower limb impact load (Leatham, 2004; Jiang et al., 2024). If athletes had run at different speeds on one field type compared to another, it could have affected the reliability of our ankle IMU data. However, since no significant speed differences were found across field types, usage, or hardness, we can confidently attribute the observed differences in the resulting ankle IMU data to the playing surface.
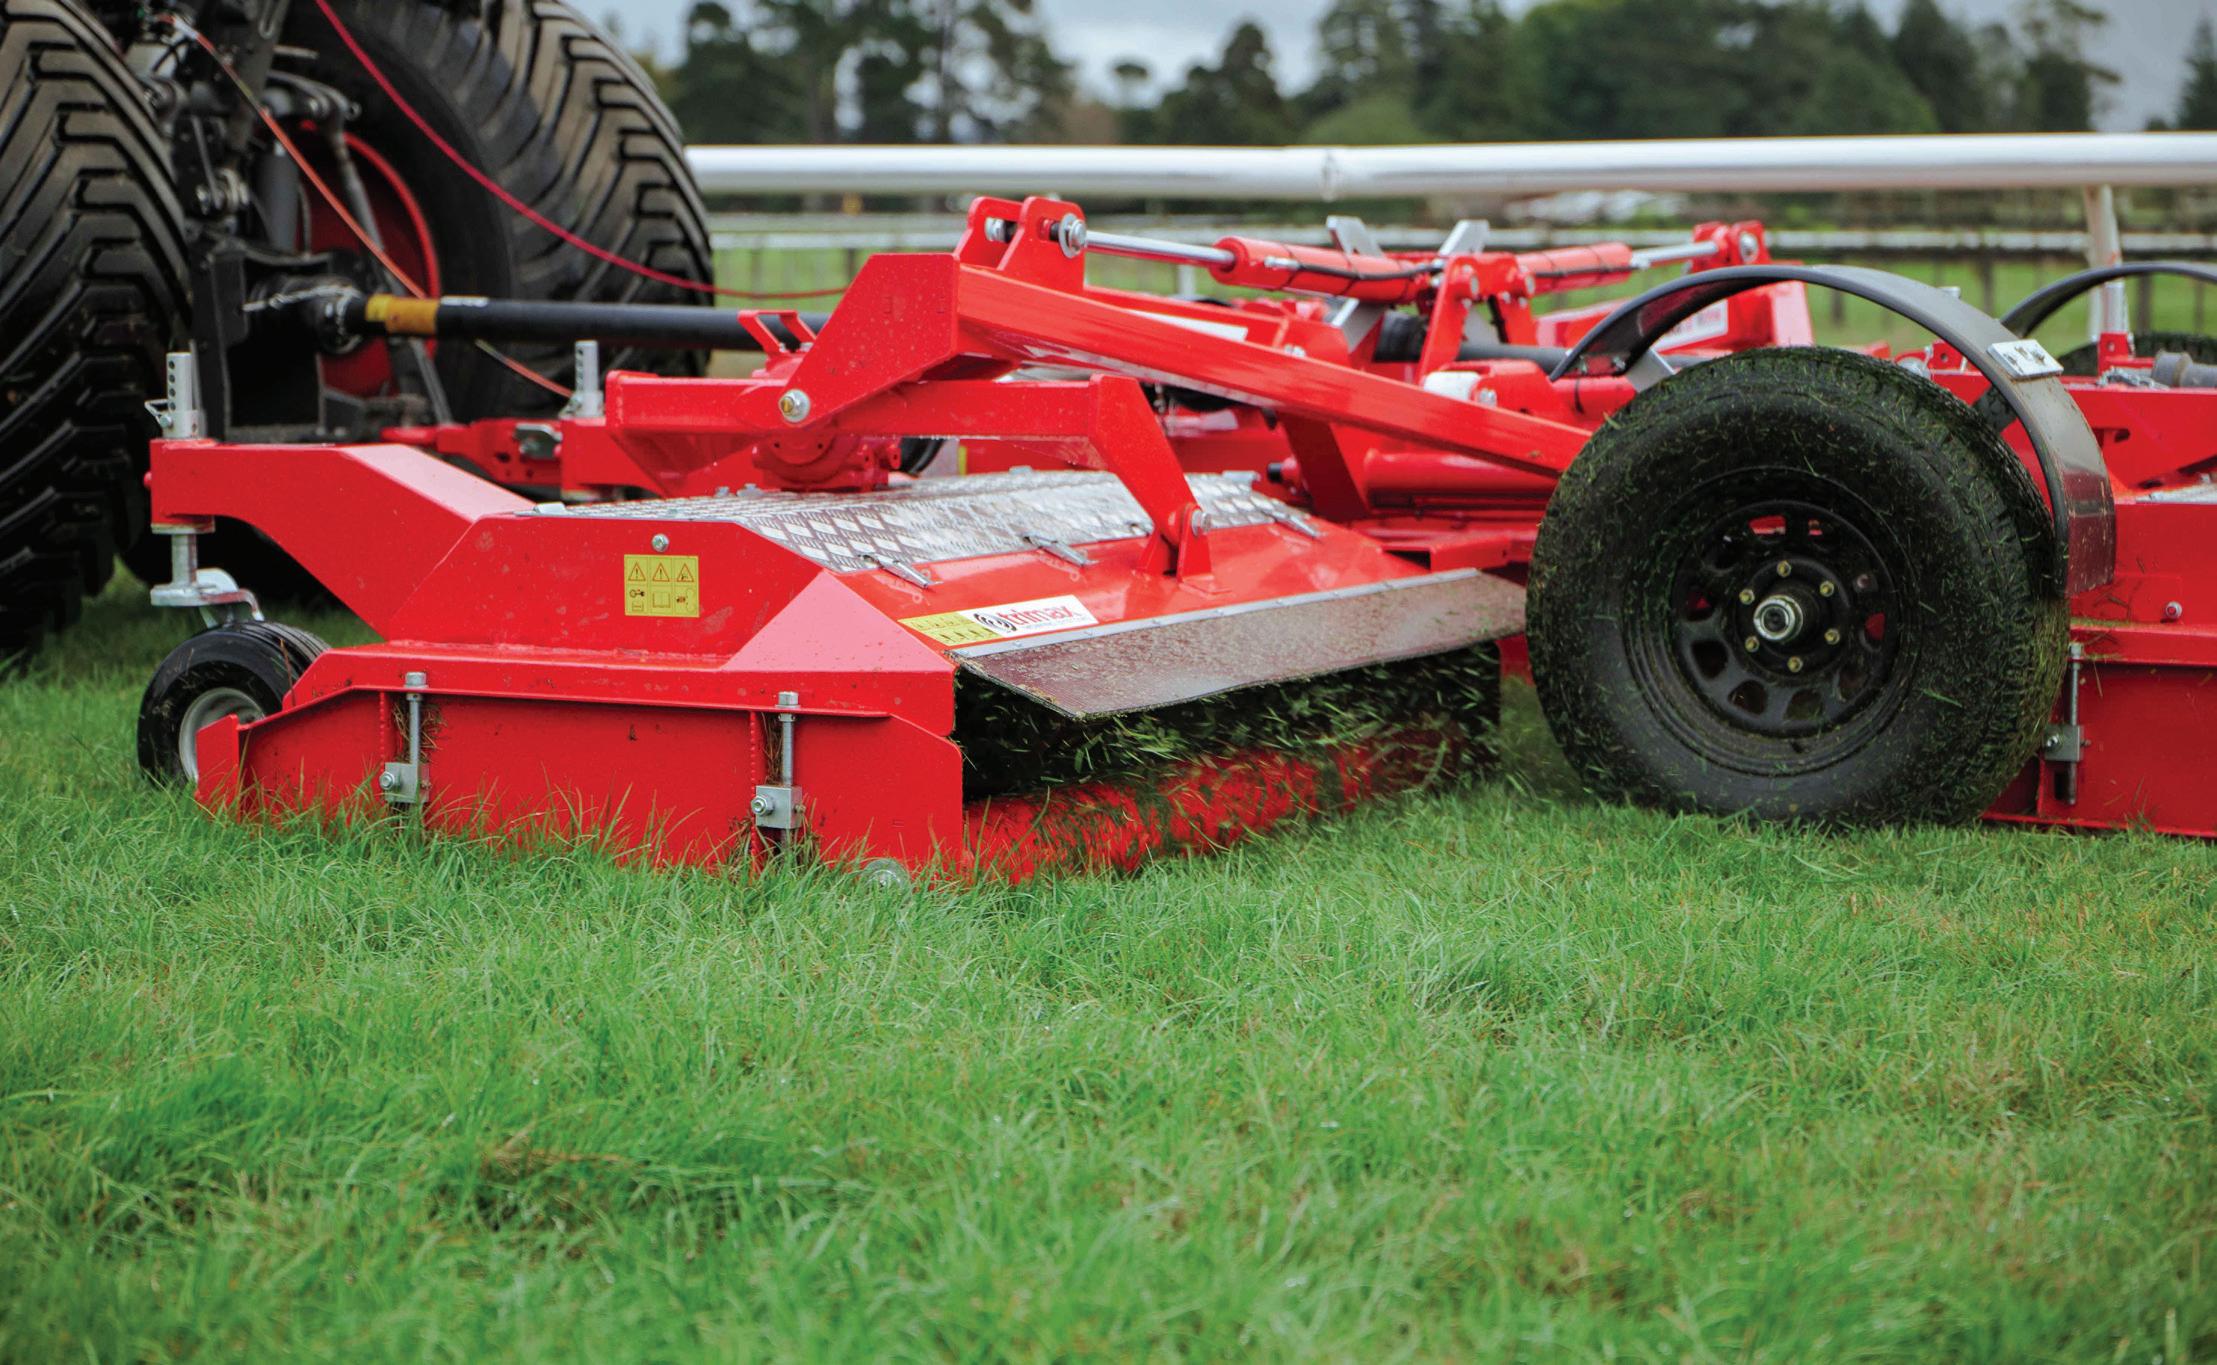
Engineered for superior long-grass performance without compromising finish, the Pegasus SR allows greater grass flow into the deck for a clean, even cut across demanding turf environments.
Single Roller
Robust Chassis
Zero Daily Maintenance
Impact Protection
Flexible Suspension
Ankle IMU Data
Ankle IMUs were utilized to record a metric called average intensity, which is defined as the mean impact intensity derived from every impact propagated into both limbs (IMeasureU, 2022). This metric is recorded in units of gravitational force (g). These devices were securely attached to each athlete’s ankle and recorded data as they performed drills on all four fields studied. After running statistical tests that accounted for individual differences between athletes, significant differences were found based on field, field usage, and hardness.
Across all three drills, field type had a noticeable impact (p < 0.0001) where athletes showed higher average intensity on synthetic turf fields compared to natural turfgrass. For the drop jump drill, the average intensity was 19.73 g [standard error (SE) ± 1.88] on natural turfgrass and 22.73 g (SE ± 1.82) on synthetic turf, placing the synthetic turf value within the IMU Step ‘high intensity’ foot strike range of 21.5–26.7 g (Wong and Finch, 2018).
A similar trend was seen in the t-drill, with average intensities of 15.84 g (SE ± 1.20) on natural turfgrass and 18.07 g (SE ± 1.16) on synthetic turf. For the modified acceleration-deceleration drill, average intensity was 17.72 g (SE ± 1.15) on natural turfgrass and 21.35 g (SE ± 1.10) on synthetic turf.
Field usage also made a difference in the t-drill (p < 0.0001), where the average intensity on high-usage fields was 18.14 g (SE ± 1.24), compared to 16.49 g (SE ± 1.24) on low-usage fields. Hardness played a role as well, especially in the t-drill (p = 0.0073) and the modified acceleration-deceleration drill (p < 0.0001). In the t-drill, hard areas resulted in an average intensity of 17.43 g (SE ± 1.22), slightly higher than the 17.05 g (SE ± 1.22) on soft areas. For the modified acceleration-deceleration drill, intensity averaged 20.38 g (SE ± 4.28) on hard areas and 18.85 g (SE ± 3.81) on soft areas.
Overall, the synthetic turf fields, high-usage fields, and hard areas within fields exhibited higher average intensity values than the natural turfgrass fields, low-usage fields, and softer areas within fields. This aligns with our surface hardness findings, as synthetic turf fields were significantly harder than natural turfgrass fields on average. Additionally, hard areas within synthetic turf were harder than those on natural turf, and high-usage fields were harder than low-usage fields for both surface types. Thus, our data suggest that harder surfaces may explain the higher average intensity values recorded on the athlete’s lower limbs compared to softer surfaces. This trend has been heavily supported, as running on harder surfaces increases impact stress, which can ultimately contribute to lower limb injuries. However, all surface hardness values in this study were below 100 Gmax, which is the
Covers trusted by those who know...
Member of
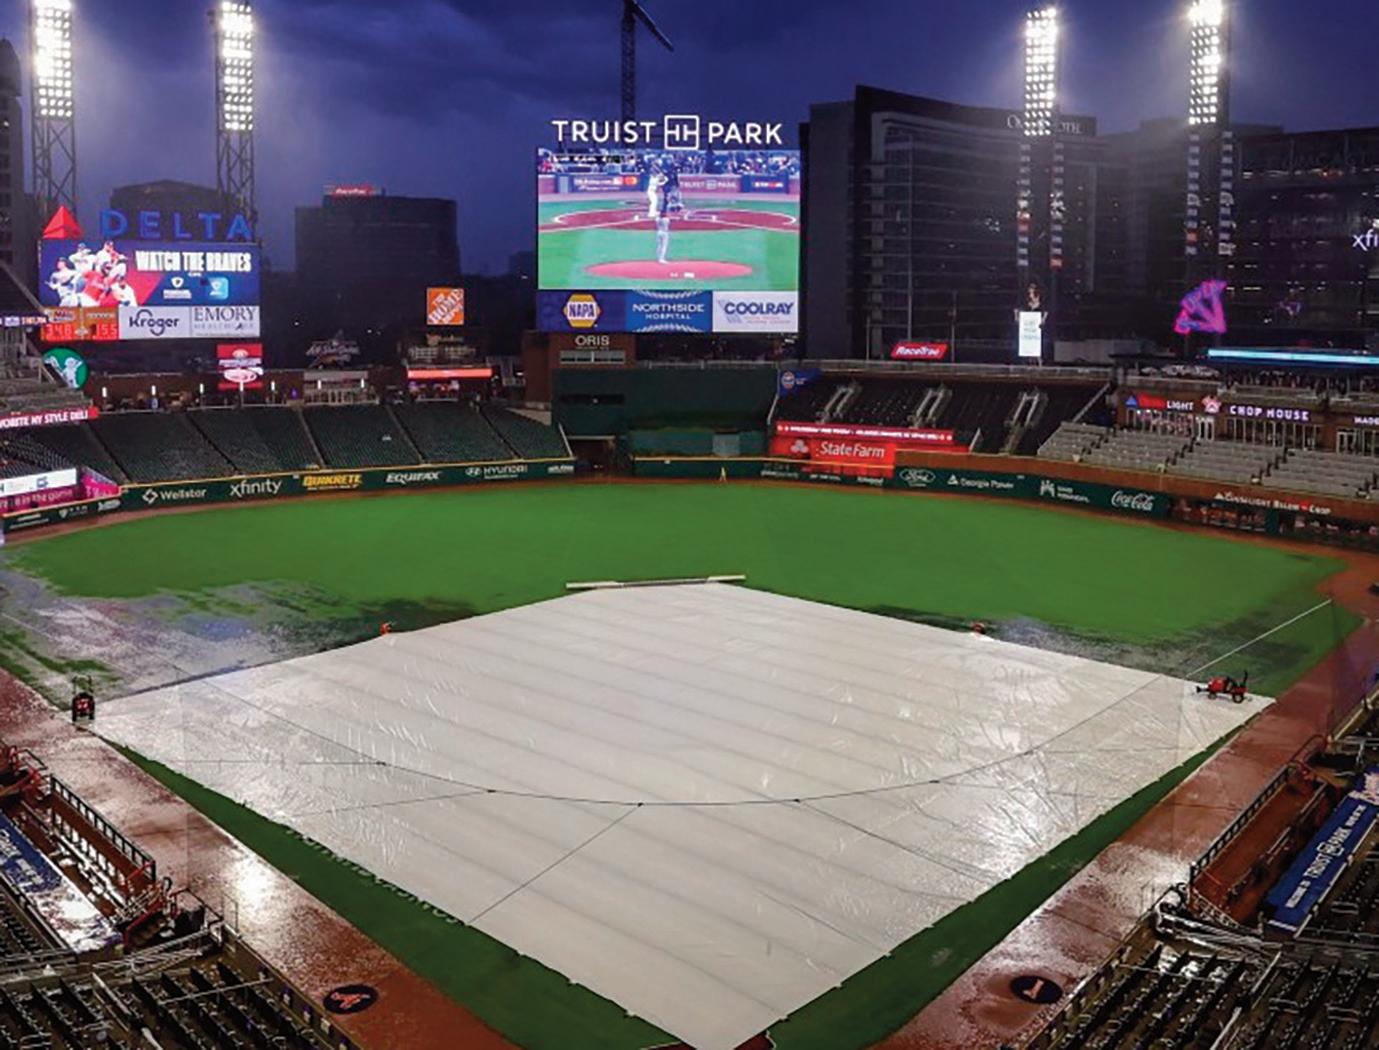
From our supreme lightweight raincovers right to the classic vinyl ones, there are cover models and accessories to meet your specific needs.
EVERGREEN™ turf covers outsmart mother nature. Exclusive color lace coatings provide proven results.
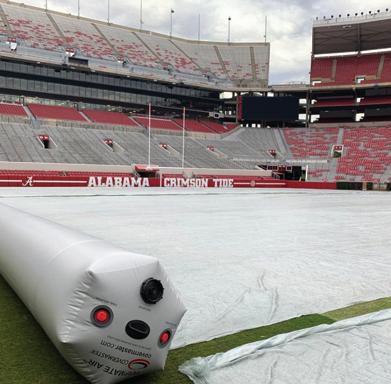
TARPMATE™ AIR roller is a revolutionary storage and handling system for field covers. 2-3 people can roll out or roll up a 100’ wide cover.
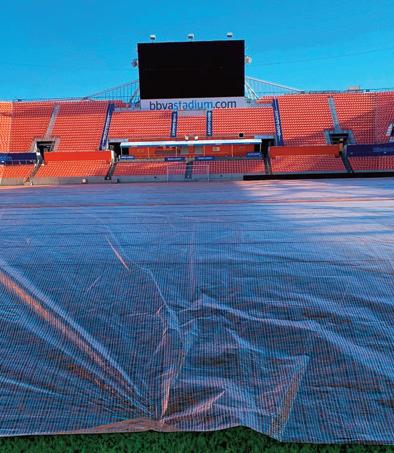
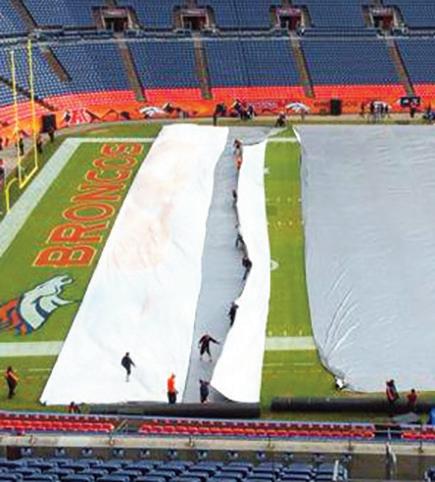
FOOTBALL FIELD COVERS are made of superior strength material, providing protection from rain or snow.
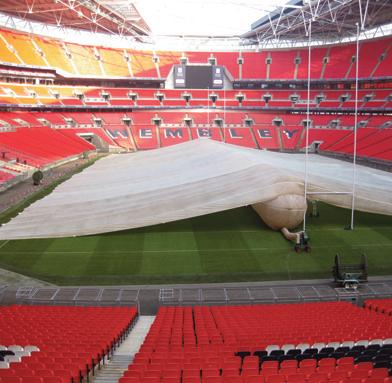
An INFLATABLE FIELD COVER solves the problem of ongoing field maintenance during inclement and extreme cold weather.
threshold deemed unsafe by the National Football League (NFL) guidelines (Sports Turf Managers Association, 2019) and unacceptable by FIFA. Yet, a potential positive correlation between surface hardness and impact was observed, as recorded by the ankle IMUs. While further research is needed, it is hypothesized that surface hardness exceeding 100 Gmax could significantly increase injury risk over time due to excessive impact on athletes’ lower limbs. Additionally, establishing threshold values for ankle IMU metrics is crucial to determine the point at which these values may lead to injury.
Survey/Athlete Perception Data
Athletes completed pre- and post-performance surveys to assess field quality and its impact on their performance. Individual responses were recorded and analyzed using one-way analysis of variance to assess statistical differences between fields. Post-hoc comparisons were conducted using Fisher’s protected least significant difference (LSD) test at α = 0.05.
The low-usage natural turfgrass field received the highest quality rating for both pre- and post surveys, while the high-usage natural turfgrass field, hindered by weeds and poor maintenance, scored the lowest. Synthetic turf fields ranked in between the two natural fields (with the high usage synthetic turf field being
ranked lower than the low-usage synthetic turf field), indicating a preference for synthetic surfaces over a poorly maintained natural field.
Table 2. Athlete perceptions of field quality before and after performance of drills. Athletes were asked to rate each field on a scale of 1-10, where 10 represents the best field they have ever seen and 1 the worst. Means followed by the same letter within the same row are not significantly different according to Fisher’s protected least significant difference (LSD) test at α = 0.05.
Conclusions
Considerable variation in surface hardness was observed both within and between fields, with synthetic turf fields generally being harder than natural turfgrass fields. High-usage fields, regardless of type, were significantly harder than low-usage fields. Other metrics, such as rotational resistance, soil moisture, thatch depth, and infill depth, also showed variability. For natural turfgrass fields, higher soil moisture led to lower surface hardness, while synthetic turf fields exhibited a negative relationship between field usage and infill depth, where frequent foot traffic reduced infill and increased surface hardness. Although achieving perfect field uniformity is not possible, these findings emphasize how field usage and maintenance impact surface variability.
Additionally, our data suggest a potential link between surface hardness and the mechanical load on athletes’ lower limbs. While this trend was observed, further research is needed to investigate its long-term effects on athlete health, particularly on surfaces that exceed acceptable hardness thresholds.
Survey data revealed athletes rated the quality of the low-usage natural turfgrass field the highest, likely due to its softer surface and better aesthetics. In contrast, the high-usage natural turfgrass field, which suffered from poor maintenance and weed pressure, received the lowest ratings, underlining the importance of field condition in shaping athlete perceptions. These results highlight the role of field management and athlete feedback in optimizing field quality.
Overall, this study offers valuable insights into how different sports surfaces impact athletes. Our findings suggest that harder surfaces, such as synthetic turf or high-traffic areas, can increase impact and loading on the lower limbs. These results highlight the critical importance of effective field management, maintenance, and consideration of field conditions prior to athletic competition.
Next Phase of Research: Ph.D. Project Overview
Building on the findings of the Virginia Tech study, this doctoral research at Penn State expands the investigation from impact loading to full lower-limb joint biomechanics during sport-specific movements. While the Virginia Tech study demonstrated that harder surfaces were associated with increased lower-limb impact intensity, the next question is whether different playing surfaces subtly alter how athletes move at the joint level during high-risk tasks such as cutting and decelerating.
The planned Ph.D. project uses a multi-segment inertial measurement unit (IMU) configuration placed on the athlete’s dominant limb, including sensors at the foot, shank, thigh, and pelvis. Positioning sensors closer to the ground improves sensitivity to surface-related differences, allowing evaluation of not only impact but also ankle, knee, and hip joint kinematics derived through inverse kinematics workflows. Female athletes will perform sportspecific movements, including a single-leg drop-landing followed by a 90° cut, as well as an acceleration to deceleration drill, on four playing surface types: natural turfgrass, synthetic turf, carpet-type hybrid reinforced turfgrass, and stitched fiber hybrid reinforced turfgrass. Each athlete will complete multiple trials on each surface in a within-subject, repeated-measures design,
allowing direct biomechanical comparisons across surface types. Female athletes are of particular interest given they experience substantially higher rates of non-contact ACL injury compared to their male counterparts, highlighting the importance of understanding how the playing surface may influence movement.
Joint angles of interest include knee flexion and frontal-plane knee motion (dynamic valgus), as well as hip and foot orientation variables commonly discussed in the context of non-contact ACL injury mechanisms. Because hybrid systems are increasingly used in elite stadium environments and are required for upcoming international competitions (e.g., the FIFA World Cup), understanding how live athletes respond biomechanically to these surfaces is of particular interest. To date, most hybrid research has relied primarily on mechanical testing devices rather than human movement data.
An additional component of the project involves comparing human biomechanical responses to mechanical surface testing metrics, including measurements from the fLEX testing device (Dickson and Sorochan, 2022; SGL System, n.d.). If consistent relationships are identified between device measurements and athlete joint mechanics, field managers may ultimately be able to more confidently use standardized mechanical testing tools as practical indicators of athlete–surface interactions.
Collectively, this progression advances a more comprehensive framework that integrates both the playing surface and athlete biomechanics. By focusing on human movement responses within real field environments, this work strengthens interdisciplinary collaboration across field management, kinesiology, and sports medicine. Ultimately, it aims to generate practical knowledge that supports both performance and safety in sport. •
References
Atkinson, J. L., McCarty, L. B., & Bridges Jr, W. C. (2012). Effect of core aerification frequency, area impacted, and topdressing rate on turf quality and soil physical properties. Agronomy Journal, 104(6), 1710-1715.
Dickson, K. H., & Sorochan, J. C. (2022, November). New Device to Test Uniformity and Consistency of Athletic Fields. In ASA, CSSA, SSSA International Annual Meeting. ASACSSA-SSSA.
Dickson, K. H., Straw, C. M., Thoms, A. W., Carson, T. D., & Sorochan, J. C. (2022). Impact of third generation synthetic turf athletic field age on surface hardness and infill depth spatial variability. Proceedings of the Institution of Mechanical Engineers, Part P: Journal of Sports Engineering and Technology, 236(3), 192-199.
Fédération Internationale de Football Association (FIFA). (2022). FIFA natural pitch rating system. Retrieved from https://digitalhub.fifa.com/m/58aa765dd3e85f26/original/FIFA-naturalpitch-rating-system_EN.pdf
Fleming, P., Ferrandino, M., & Forrester, S. (2016). Artificial turf field–A new build case study. Procedia engineering, 147, 836-841.
Jiang, X., Bíró, I., Sárosi, J., Fang, Y., & Gu, Y. (2024). Comparison of ground reaction forces as running speed increases between male and female runners. Frontiers in Bioengineering and Biotechnology, 12, 1378284.
Leatham, C. L. (2024). Tibial Acceleration and Shock Attenuation in Female and Male Distance Runners at Different Levels of Body Weight Unloading (Doctoral dissertation, Virginia Tech).
McCarty, L. B., Gregg, M. F., & Toler, J. E. (2007). Thatch and mat management in an established creeping bentgrass golf green. Agronomy Journal, 99(6), 1530-1537.
IMeasureU. (2019). IMU Step: Lower limb load monitoring. https://imeasureu.com/imu-step/ IMeasureU. (2022). Login. IMeasureU. https://login.imeasureu.com/ SGL System. (n.d.). fLEX – pitch performance testing. SGL System. Retrieved January 15, 2026, from https://sglsystem.com/products/pitch-performance-testing/flex/ Sports Turf Managers Association. (2019). Field hardness testing. STMA Institute. Retrieved from https://www.stma.org/wp-content/uploads/2019/09/Field-Hardness-TestingSTMAInstitute-logo.pdf
STATSports. (2025). STATSports: The world’s leading GPS performance tracker. https:// statsports.com/ Wong, A., & Finch, M. (2018). IMU Step Dashboard Summary (Version 1.1.0). Vicon IMeasureU Limited. Retrieved from https://imeasureu.com/wp-content/uploads/2018/02/ IMUStepDashboardSummary.pdf
Penn State Turf Team
Tom Bettle Turf Research Center Manager 724-321-0321 • trbettle@psu.edu
Monoj Chhertri Professor of Turfgrass Science 814-863-3606 • mkc6518@psu.edu
Michael A. Fidanza, Ph.D. Professor of Plant & Soil Science 610-396-6330 • maf100@psu.edu
David R. Huff, Ph.D. Professor of Turfgrass Breeding and Genetics 814-863-9805 • drh15@psu.edu
Bradley Jakubowski
Assistant Teaching Professor 814-865-7118 • brj8@psu.edu
John E. Kaminski, Ph.D. Professor of Turfgrass Science 814-865-3007 • kaminski@psu.edu
Timothy Lulis Teaching and Research Assistant 814-865-0697 • ttl101@psu.edu
Ben McGraw, Ph.D. Professor of Turfgrass Science 814-865-1138 • bam53@psu.edu
Dianne Petrunak
Academic Adviser, Turfgrass Science and World Campus 814-863-0139 • dmp6@psu.edu
Max Schlossberg, Ph.D. Associate Professor of Turfgrass Nutrition / Soil Fertility 814-863-1015 • mjs38@psu.edu
Chase Straw
Professor of Turfgrass Soils 502-229-9838 • cms9424@psu.edu
Building the Turfgrass Manager Pipeline:
A Call for IndustryAcademic Partnership
By Jay McCurdy
The
larger turfgrass and landscape industry has a labor issue—mainly that there’s not a reliable pipeline for accessing young and capable employees. I have this conversation almost weekly when discussing the state of the industry and how my role in a “turfgrass program” relates. I’m now in my 12th year at Mississippi State University, so I no doubt have some ownership of the problems. But I also wanted to relay to a wider audience just what some of the solutions might be to solve this problem. Yes, higher industry pay might help, but there’s more to the story than just that.
Our landscape management industry includes a broad range of job titles, but most of us reading this magazine are either boots-on-the-ground landscape managers (ex. superintendents, lawn care professionals, sports field managers, sod producers, equipment managers, etc.) or are somehow involved in the industry/supply side (sales, accounts, research and development, chemical, equipment, etc.). We know the technical mastery and skill required to do this job. We know the rewards and challenges. Nevertheless, I find the perspective from academia is often a little different from what it was when I was a practitioner.
We are all concerned about a shrinking pipeline of new professionals entering our field. Turfgrass academic programs are often criticized for producing too few graduates, and those graduates are said to be underprepared for the demanding, multifaceted roles that await them. The same is said for students fresh out of high school. There’s always a debate about whether it’s generational or whatnot. Maybe there’s something to that, but what, pragmatically, can we do to figure all this out?
The issue is more complex than a simple academic shortfall. The challenges facing turf programs reflect deeper structural and cultural dynamics within the larger society, as well as within the green industry and our academic institutions. I think we need to embrace a new model of mutual investment between academia and industry in order to restore vitality and sustainability to the profession. Whatever the model, it must redefine recruitment, enhance the talent pool, and demonstrate that green-industry roles are both professionally rewarding and personally sustainable.
This essay outlines a vision for such a partnership, built on five key principles: shared recruitment, broader inclusion, job-quality reform, experiential learning, and a mutual commitment to long-term workforce development.
The Myth of the One-Way Pipeline
Turfgrass academic programs are too often viewed as workforce development pipelines. In this paradigm, universities are expected to “turn out” graduates who are job-ready, immediately employable, and long-term loyal to the industry. These are ambitious goals that can only be achieved through industry partnerships. Universities cannot solve structural labor shortages in isolation. For starters, the looming demographic cliff, where student enrollment drops due to fewer babies having been born ~18 years ago, is self-evident. We have to reframe the relationship as a two-way street: industry leaders and employers must engage as co-investors in the success of the next generation.
The declining number of turfgrass students is not solely a turf problem—it mirrors trends across many science, technology, engineering, agriculture, and mathematics (STEAM) disciplines. Yet in turf, the impact is more acute. Fewer students are entering, and those who do are frequently drawn away by careers with higher salaries, greater mobility, and more stable work-life balance—fields like wildlife biology, ecology, food science, and agricultural engineering. If return on investment (ROI) for college interests you, I highly recommend Preston Cooper’s Is College Worth It? A Comprehensive Return on Investment Analysis article.
If the green industry wants to retain talented, committed professionals, it must work with academic programs to create clearer, more appealing, and more stable career pathways for students entering the field.
Recruitment: A Shared Responsibility
One of the most common critiques from green industry professionals and hiring managers is that turf programs are not doing enough to recruit students into the field. In truth, recruitment cannot be the sole responsibility of faculty or universities. Few high school students grow up dreaming of becoming a golf course superintendent, especially if they’ve never been exposed to the role or the science behind it. Lots of kids grow up mowing lawns, but do they view that as a stable profession? How many golf course superintendents leave the industry for better working hours or more stable family lives? The stories of our profession are not always positive. How do we improve that?
Meaningful recruitment requires visibility, storytelling, and early engagement. That means:
• Hosting and organizing Golf Course Superintendents Association of America’s (GCSAA’s) STEAM program, First Green.
• Industry professionals visiting high schools, FFA programs, and 4-H events to talk about careers in turf and to give hands-on help managing facilities.
If we want to build a workforce that reflects the broader demographics of our society, the turfgrass industry must actively recruit from historically underrepresented communities, including women, students of color, and first-generation college students. Many turf programs sit within land-grant institutions with a mission to serve all citizens of their state. Partnerships with historically Black colleges and universities (HBCUs), tribal colleges, and community colleges offer promising avenues for talent development.
Additionally, the industry must take steps to ensure that students from diverse backgrounds are not only recruited but also retained. That means:
• Paid internships with real mentorship, not just summer labor. This is something our industry does well. Though pay and working conditions could always be improved, I understand the financial realities for most businesses— margins matter, and you can’t pay a 20-year-old more than your loyal long-time employees.
• Scholarships and travel support to attend GCSAA and regional turfgrass conferences. GCSAA and our regional events have done a great job supporting our students. Our state and regional associations have covered almost all the costs for our students attending events like Deep South. GCSAA allows students and academic advisors to attend the Golf Show for free. They allow students to be members for free. We just have to cover flight and meal costs—sell more hats and pullovers!
• Hosting youth days, career shadowing, or field trips in coordination with FFA, agricultural teachers, 4-H, and Extension educators.
• Alumni sharing their stories, not just of agronomic challenges overcome, but of career development, family stability, and lifelong learning.
Academic programs can support these efforts with marketing materials, introductory coursework, event production, and advising. Industry partners can develop their own materials, and my academic colleagues and I would be happy to collaborate. But unless the industry is willing to support or do the work, recruitment will remain a leaky pipeline. The Golf Course Superintendents Association of America has promoted its First Green program and has invested heavily in promoting the profession to kids in FFA. This is a good example of how we might target youth to entice them into our profession.
Reaching the Future of the Profession
A second issue compounding recruitment challenges is the profession’s lack of demographic diversity (this isn’t a DEI discussion!). This is not simply a turfgrass issue; it reflects broader underrepresentation across many STEAM fields. However, the profession’s visual and cultural homogeneity isn’t always inviting to those from different socioeconomic or cultural backgrounds. That’s to say very little of the lack of female representation—it’s improving. Still, it lags considerably behind many other attractive career fields for the same candidate pool we are competing for.
• Storytelling campaigns that highlight successful professionals in our industry. Barry Stewart hosts MSU Turf Seminar speakers, and I’m sure he’d love to hear from those of you who can share your secrets to success and happiness.
If the profession remains perceived as culturally insular or exclusionary, we will continue to miss out on a generation of bright, capable professionals who simply chose other welcoming fields.
Students attending local and national conferences benefit from the wisdom and experience of generations of turfgrass managers.
Career Quality: The Hidden Cost of Turnover
Recruitment efforts alone are not enough if the jobs themselves are perceived as undesirable. One of the most pressing challenges facing the green industry is career sustainability and burnout. Even for students who graduate from turf programs and enter the profession, the early-career reality can be discouraging.
Starting roles are often physically demanding, geographically isolating from home, and poorly compensated relative to the skill and responsibility required. I won’t disagree: early careers are hard in many professions, and ours has a history of heartiness and resilience that we pride ourselves on. And that’s great, but let’s face it, positions frequently involve long hours, especially in golf and sports fields, weekend shifts, and high turnover. Relocation is common, placing strain on young professionals with families or community ties. Burnout is not only likely, but it’s also all too often expected.
In many cases, internships play a decisive role. While some students have transformative experiences, others emerge disillusioned. Internships are often where students determine whether they see a long-term future in the profession. Unfortunately, too many internships treat students as temporary labor rather than future colleagues.
Our profession must take a hard look at its entry-level roles and ask:
• Are we investing in mentorship or extracting labor?
• Are we helping build careers or merely filling seasonal gaps?
• Are we creating a profession that values work-life balance and career advancement?
Until the industry addresses these questions honestly, retention will remain low, and turf programs will struggle to retain students who see more stable options elsewhere.
Experiential Learning and Academic Alignment
To ensure that students are prepared for professional success, universities must evolve as well. Turfgrass programs must incorporate not only plant science and weed control, but also:
• Business management and budgeting
• Communication and conflict resolution
• Human resources and leadership
• Sustainability, data analytics, and emerging technologies
Faculty must engage in continuous dialogue with industry professionals to align curricula with real-world expectations. This can happen through advisory boards, curriculum reviews, and co-developed experiential learning opportunities.
Meanwhile, the industry must treat internships and co-ops as educational experiences, not just temporary employment. Golf courses that offer structured mentorship, performance feedback, and leadership development will not only see better short-term productivity, but they’ll also help shape the long-term workforce of the profession.
The Role of Associations
The Sports Field Management Association (SFMA), GCSAA, and other professional landscape associations have a unique opportunity to lead systemic change. Many in the industry look to them for guidance, advocacy, and professional standards. But as organizations, they can:
• Develop and promote best practices for internship mentorship
• Recognize organizations that invest in student development
• Partner with academic programs on workforce development grants
• Support early-career professionals through networking and continuing education
Just as importantly, associations must continue to help shift cultural expectations within the profession. That means promoting superintendent and field manager roles as executive leadership positions, not just agronomic technicians. It means celebrating the intellectual and managerial skills required to succeed in this career, and advocating for compensation, stability, and respect commensurate with those demands.
Learning from Other Industries
Much can be learned from adjacent fields. Engineering, for example, has long faced similar challenges: rigorous academic programs, intense internships, and high attrition. Yet leading companies and associations in that field have invested heavily in university partnerships, student engagement, and earlycareer support.
Top manufacturing and technology firms fund campus recruiting, sponsor capstone projects, offer paid site visits to facilities, and offer career ladders with clear promotion timelines. These students, like our own, are not afraid of hard work. They are attracted by clear career outcomes and structured support along the way.
There is no reason the green industry cannot offer the same. But doing so requires a shift in mindset: from “you have to earn your place” to “we will invest in you as the future of our profession.”
A Vision for the Future
In many places, these goals are already occurring, but here are just a few to imagine as being widespread:
• High school students attend “turf career days” hosted by their local superintendent and Extension agent.
• Universities and employers co-design internships that develop not just technical skills, but leadership and confidence.
• Interns feel welcomed and valued from their first day on a golf course.
• Assistant superintendents are mentored, paid fairly, and see clear paths to advancement.
• Associations and turf programs work side by side to tell the story of a modern, rewarding profession.
This future is not only possible but also essential. The alternative is the status quo, or worse, decline: fewer students, fewer assistants, more burnout, and an aging workforce with no one ready to take the reins.
Conclusion: A Call to Shared Action
The challenges facing the profession are real, but they are not insurmountable. What is required is not blame, but shared responsibility. Universities must modernize curricula and deepen student support. Turfgrass managers must invest in mentorship and help reshape earlycareer roles. Our industry associations must lead with vision, coordination, and advocacy.
Ultimately, this is about stewardship of the profession itself. The same care, foresight, and commitment that turfgrass managers bring to managing turf must now be brought to cultivating the future of the workforce.