The Cunningham Group - September 2023 Market Report | Palo Alto Area
September 2023
Palo Alto area
Palo Alto Los Altos
Jump to Palo Alto Report
Redwood City
Jump to Redwood City Report
Portola Valley
Jump to Portola Valley Report
Menlo Park
Jump to Menlo Report
Atherton
Jump to Atherton Report
Jump to Los Altos Report
San Jose
Jump to San Jose Report
Mountain View
Jump to Mountain View
San Mateo County
Jump to San Mateo County
Santa Clara County
Jump to Santa Clara County
Monterey County
Jump to Monterey County Report
Santa Cruz County
Jump to Santa Cruz County Report
East Palo Alto
Jump to East Palo Alto Report
Sunnyvale
Jump to Sunnyvale Report
Santa Clara City
Jump to Santa Clara City Report
Jump to Saratoga Report
Saratoga
What’syourhome reallyworthin today’smarket?
That's the question you should be asking yourself.
Our market is incredibly diverse and rapidly changing. Values vary not just by neighborhood but by street. Your home isn't necessarily worth what your neighbors' home is. It's the current market that sets the value of your home.
So, do you know what your home is worth in today's market?
Icanhelp...
Contact me for a confidential, no obligation assessment of your home's value.
MortgageRates:Past,Present, andPossibleFuture
If you’re hoping to buy a home this year, you’re probably paying close attention to mortgage rates. Since mortgage rates impact what you can afford when you take out a home loan – and affordability is a challenge today – it’s a good time to look at the big picture of where mortgage rates have been historically compared to where they are now. Beyond that, it’s important to understand their relationship with inflation for insights into where mortgage rates might go in the near future.
Giving Context to the Sticker Shock
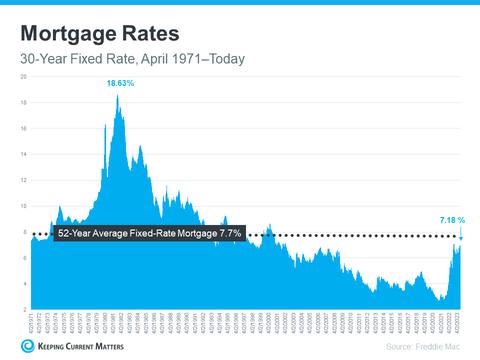
Freddie Mac has been tracking the 30-year fixed mortgage rate since April of 1971. Every week, they release the results of their Primary Mortgage Market Survey, which averages mortgage application data from lenders across the country (see graph below):
Looking at the right side of the graph, mortgage rates have increased significantly since the start of last year. But even with that rise, today’s rates are still below the 52-year average. While that historical perspective is good context, buyers have gotten used to mortgage rates between 3% and 5%, which is where they’ve been over the past 15 years.
That’s important because it explains why the recent jump in rates might have you feeling sticker shock even though they’re close to their long-term average. While many buyers have adjusted to the elevated rates over the past year, a slightly lower rate would be a welcome sight. To determine if that’s a realistic possibility, it’s important to look at inflation
Where Could Mortgage Rates Go in the Future?
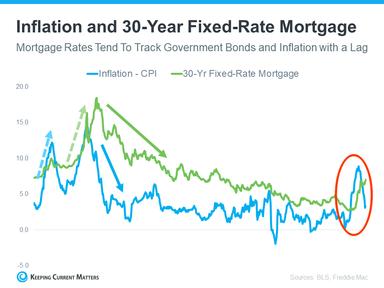
The Federal Reserve has been working hard to lower inflation since early 2022. That’s significant because, historically, there’s been a connection between inflation and mortgage rates (see graph below):
This graph shows a pretty reliable relationship between inflation and mortgage rates. Looking at the left side of the graph, each time inflation moves significantly (shown in blue), mortgage rates follow suit shortly after (shown in green).
The circled portion of the graph points out the most recent spike in inflation, with mortgage rates following closely behind. As inflation has moderated a bit this year, mortgage rates haven’t yet made a similar move. That means, if history is any guide, the market is waiting for mortgage rates to follow inflation and head back down. It’s impossible to accurately predict where mortgage rates will go for sure, but moderating inflation means mortgage rates going down in the near future would fit a well-established trend.
Source: Keeping Current Matters
1
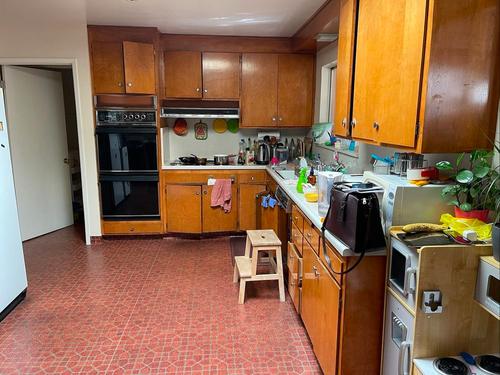
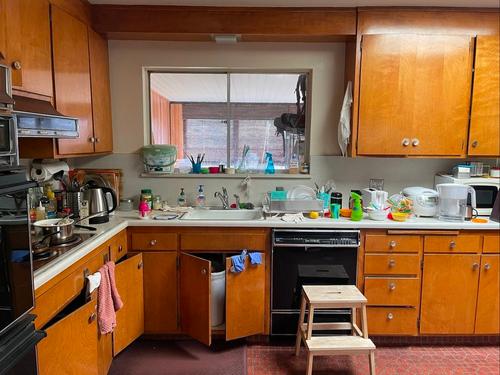
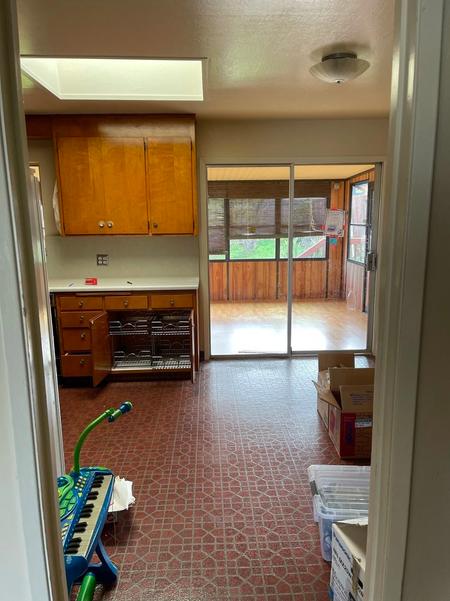
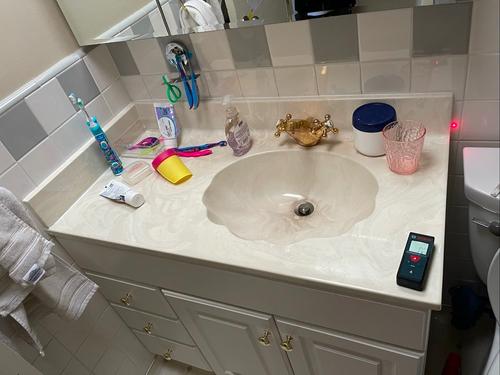
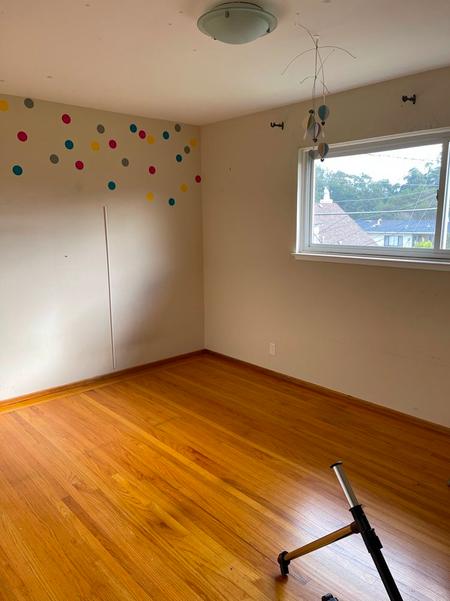
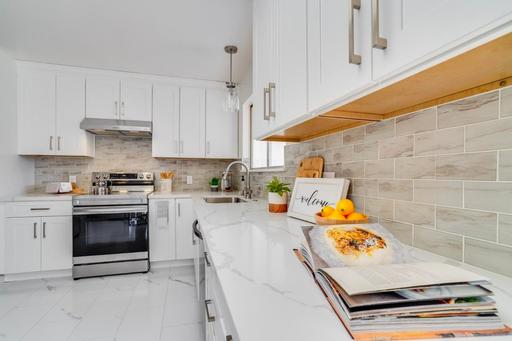
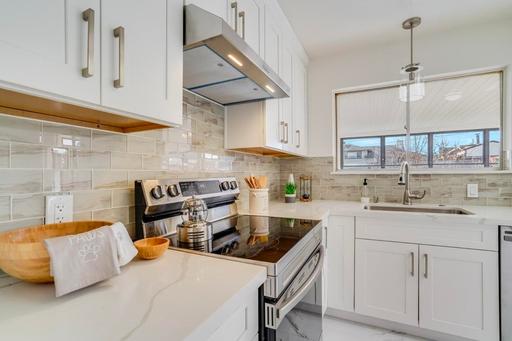
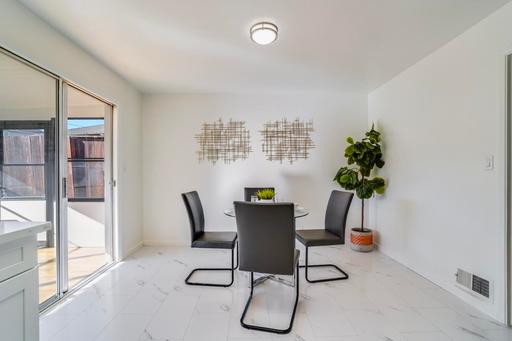
Home Concierge's secret weapon is our local project directors, who visit and personally manage each of our projects. When the agent reached out with a tight deadline, project director Azary Khalfan took it in stride and immediately called on her local vendors and subcontractors. Our in-house designer, Samantha Black, worked quickly over the holidays to design a new kitchen while Azary ordered finishes for other parts of the home. Ingenuity, strong vendor connections, and hard work transformed the kitchen in 17 days! The home sold for over $400,000 over asking in just one week.
BEFORE AFTER
Tips to Harden Your Home During Wildfires
Source: Cal Fire
ROOF
Build your roof or re-roof with materials such as composition, metal, clay, or tile Remove any vegetative debris from the roof.
VENTS
Remove all openings with 1/16-inch to 1/4-inch metal mesh Do not use fiberglass or plastic mesh because they can melt and burn
EAVES + SOFFITS
Eaves should be boxed in and protected with ignition-resistant or non-combustible materials.
WINDOWS
Install dual-paned windows with one pane of tempered glass to reduce the chance of breakage in a fire.
WALLS
Use ignition-resistant materials, such as stucco, fiber cement, wall siding, fire retardant, treated wood, etc.
DECKS
Create an ember-resistant zone around and under all decks and clear debris from under your deck.
FENCES
Separate your fences from your house or upgrade the last 5 feet of the fence to a non-combustible material.
GUTTERS
Keep rain gutters clear or enclose rain gutters to prevent accumulation of plant debris
DRIVEWAY
Driveways should be built and maintained in accordance with state and local codes to allow fire and emergency vehicles to reach
CHIMNEY
Close the fireplace during fire season when the chimney is not being used.
PATIO COVER
Use the same ignitionresistant materials for patio coverings as a roof
DECKS
Have a fire extinguisher and tools such as a shovel, rake, bucket, and hose available for fire
BroughtToYouBy:
PaloAlto
What's in the Palo Alto data
There were 81 single-family homes for sale, providing 1.7 months of inventory. There we new listings and 29 homes sold at a median of $3.9m. The median overbid percentage w 98.5%, with an average of 19 days on the ma
There were 22 condo and townhome units fo sale, providing 1.1 months of inventory. Ther were 6 new listings and 5 units sold at a med sale price of $1.6m. The median overbid percentage was 97.6%, with an average of 19 on the market.
e-Family Homes
ngs
29 Sold Listings
7 f Inventory
$3.9M Median Sale Price .5% ale vs List
19 Avg Days on Market
sourced from InfoSparks and Broker Metrics, includes all single-family homes, townhomes in the California Area above from August 2022 to August 2023. include preliminary data, and may vary from the time the data was gathered. deemed reliable but not guaranteed. DRE# 01511642. Copyright KW Advisors Palo Alto 2023. Each office is independently owned and operated.
6 New Listings
5 Sold Listings
1.1 Months of Inventory
$1.6M Median Sale Price 97.6% Median Sale vs List 19 Avg Days on Market
Median SalesPrice
Single-Family Homes
The median sales price has increased from $3 4m last August 2022, to $3 9m as of August 2023
Condos & Townhomes
The median sales price has remained at $1.6m since last August 2022.
AVGDays OntheMarket
Single-Family Homes
The average time spent on the market went down from 31 days last August 2022, to 19 days as of August 2023
Condos & Townhomes
The average time spent on the market went down from 34 days in August 2022, to 19 days as of August 2023
Overbids
Single-Family Homes
The overbid percentage has decreased from 100 8% last August 2022, to 98 5% a year later
Condos & Townhomes
The overbid percentage has decreased from 100.4% last August 2022, to 97.6% a year later.
Redwood City
What's in the Redwood City data?
There were 81 single-family homes for sale, providing 1.3 months of inventory. There were 41 new listings and 34 homes sold at a median price of $2.1m. The median overbid percentage was 102 4%, averaging 38 days on the market
There were 36 condo and townhome units for sale, providing 4.3 months of inventory. There were 6 new listings and 8 units sold at a median sale price of $1.2m. The median overbid percentage was 102.4%, with an average of 15 days on the market.
6 New Listings
8 Sold Listings
4.3 Months of Inventory
102.4%
Median Sale vs List 15 Avg Days on Market
RedwoodCity
AUGUST 2022 - AUGUST 2023
Single-Family Homes
Last 12 months, year-over-year.
Condos & Townhomes
Last 12 months, year-over-year
Median SalesPrice
Single-Family Homes
The median sales price has decreased from $2 2m last August 2022, to $2 1m as of August 2023
Condos & Townhomes
The median sales price has decreased from $1.4m last August 2022, to $1.2m as of August 2023.
AVGDays OntheMarket
Single-Family Homes
The average time spent on the market went up from 25 days last August 2022, to 38 days as of August 2023
Condos & Townhomes
The average time spent on the market went up from 11 days in August 2022, to 15 days as of August 2023
Overbids
Single-Family Homes
The overbid percentage has increased from 97 9% last August 2022, to 102 4% a year later
Condos & Townhomes
The overbid percentage has increased from 99.6% last August 2022, to 102.4% a year later.
Portola Valley
What's in the Portola Valley data?
There were 13 single-family homes for sale, providing 0 months of inventory. There were 2 new listings, and 3 homes sold at a median price of $7.4m. The median overbid percentage was 87 9%, with an average of 0 days on the market
There is no data for condos and townhomes this month.
Single-Family Homes
2 New Listings
3 Sold Listings
0 Months of Inventory
$7.4M Median Sale Price
87.9%
Median Sale vs List
0 Avg Days on Market
The data, sourced from InfoSparks and Broker Metrics, includes all single-family homes, condos and townhomes in the California Area above from August 2022 to August 2023. This may include preliminary data, and may vary from the time the data was gathered. All data is deemed reliable but not guaranteed. DRE# 01511642. Copyright KW Advisors Palo Alto 2023. Each office is independently owned and operated.
CONDO
Condo & Townhomes
No Data For This Month.
Median SalesPrice
Single-Family Homes
The median sales price has increased from $3 4m last August 2022, to $7 4m as of August 2023
Condos & Townhomes No Data For This Month.
AVGDays OntheMarket
Single-Family Homes
The average time spent on the market went down from 36 days last August 2022, to 0 days as of August 2023
Condos & Townhomes No Data For This Month
Overbids
Single-Family Homes
The overbid percentage has decreased from 95 3% last August 2022, to 87 9% a year later
Condos & Townhomes No Data For This Month.
Wha There w providi new lis of $2.8 97.3%, There w sale, pr 10 new price o was at market
Single-Family Homes
36 New Listings
24 Sold Listings
2.1 Months of Inventory
$2.8M Median Sale Price
97.3% Median Sale vs List
26 Avg Days on Market
The data, sourced from InfoSparks and Broker Metrics, includes all single-family homes, condos and townhomes in the California Area above from August 2022 to August 2023. This may include preliminary data, and may vary from the time the data was gathered. All data is deemed reliable but not guaranteed. DRE# 01511642. Copyright KW Advisors Palo Alto 2023. Each office is independently owned and operated.
Median SalesPrice
Single-Family Homes
The median sales price has increased from $2 7m last August 2022, to $2 8m as of August 2023
Condos & Townhomes
The median sales price has increased from $920k last August 2022, to $950k as of August 2023.
AVGDays OntheMarket
Single-Family Homes
The average time spent on the market went down from 28 days last August 2022, to 26 days as of August 2023
Condos & Townhomes
The average time spent on the market went down from 22 days in August 2022, to 12 days as of August 2023
Overbids
Single-Family Homes
The overbid percentage has increased from 95 8% last August 2022, to 97 3% a year later
Condos & Townhomes
The overbid percentage has decreased from 96.2% last August 2022, to 91% a year later.
Atherton
What's in the Atherton data?
There were 31 single-family homes for sale, providing 1.5 months of inventory. There were 6 new listings and 12 homes sold at a median price of $8.2m. The median overbid percentage was 89.1%, with an average of 88 days on the market.
There were 0 condo and townhome units for sale, providing 0 months of inventory. There were 0 new listings, and 1 unit sold at a median sale price of $1.5m. The median overbid percentage was 0%, with an average of 0 days on the market.
Single-Family Homes
6 New Listings
6 Sold Listings
1.5 Months of Inventory
$8.2M Median Sale Price
89.1% Median Sale vs List
88 Avg Days on Market
The data, sourced from InfoSparks and Broker Metrics, includes all single-family homes, condos and townhomes in the California Area above from August 2022 to August 2023. This may include preliminary data, and may vary from the time the data was gathered. All data is deemed reliable but not guaranteed. DRE# 01511642. Copyright KW Advisors Palo Alto 2023. Each office is independently owned and operated.
New Listings
1 Sold Listings
0
Months of Inventory
$1.5M
Median Sale Price 0%
Median Sale vs List 0 Avg Days on Market
AUGUST 2022 - AUGUST 2023
mily Homes onths, year-over-year.
Townhomes onths, year-over-year
Median SalesPrice
Single-Family Homes
The median sales price has increased from $7m last August 2022, to $8 2m as of August 2023
Condos & Townhomes
The median sales price has increased from $0 last August 2022, to $1.5m as of August 2023.
AVGDays OntheMarket
Single-Family Homes
The average time spent on the market went up from 59 days last August 2022, to 88 days as of August 2023
Condos & Townhomes
The average time spent on the market has remained at 0 days since August 2022
Overbids
Single-Family Homes
The overbid percentage has decreased from 91 3% last August 2022, to 89 1% a year later
Condos & Townhomes
The overbid percentage has increased from 0% last August 2022, to 100.1% a year later.
Los
What's in th
There were 43 sin providing 0.7 mon new listings and 2 of $4.3m. The me 98.4%, with an av
There were 14 co sale, providing 0. were 8 new listing sale price of $1.5 percentage was 1 days on the mark
gle-Family Homes
0 Listings
20 Sold Listings
.7 hs of Inventory
$4.3M Median Sale Price
8.4% an Sale vs List
30 Avg Days on Market
ta, sourced from InfoSparks and Broker Metrics, includes all single-family homes, and townhomes in the California Area above from August 2022 to August 2023. may include preliminary data, and may vary from the time the data was gathered. is deemed reliable but not guaranteed. DRE# 01511642. Copyright KW Advisors Palo Alto 2023. Each office is independently owned and operated.
Condo &
New Listings
0.8
Months of Inventory
109.2%
Median Sale vs List
AUGUST 2022 - AUGUST 2023
mes year-over-year.
omes year-over-year
Median SalesPrice
Single-Family Homes
The median sales price has increased from $3 8m last August 2022, to $4 3m as of August 2023
Condos & Townhomes
The median sales price has increased from $1.2m last August 2022, to $1.5m as of August 2023.
AVGDays OntheMarket
Single-Family Homes
The average time spent on the market went up from 23 days last August 2022, to 30 days as of August 2023
Condos & Townhomes
The average time spent on the market went down from 25 days in August 2022, to 21 days as of August 2023
Overbids
Single-Family Homes
The overbid percentage has increased from 97 8% last August 2022, to 98 4% a year later
Condos & Townhomes
The overbid percentage has increased from 97.3% last August 2022, to 109.2% a year later.
%
Homes
320 Sold Listings
$1.6M
Median Sale Price
20
Avg Days on Market
and Broker Metrics, includes all single-family homes, California Area above from August 2022 to August 2023. and may vary from the time the data was gathered. guaranteed. DRE# 01511642. Copyright KW Advisors Palo Alto 2023. Each office is independently owned and operated.
170
SanJose
AUGUST 2022 - AUGUST 2023
Single-Family Homes
Last 12 months, year-over-year.
Condos & Townhomes
Last 12 months, year-over-year
Median SalesPrice
Single-Family Homes
The median sales price has increased from $1 4m last August 2022, to $1 6m as of August 2023
Condos & Townhomes
The median sales price has increased from $751k last August 2022, to $855k as of August 2023.
AVGDays OntheMarket
Single-Family Homes
The average time spent on the market went up from 29 days last August 2022, to 20 days as of August 2023
Condos & Townhomes
The average time spent on the market went up from 28 days in August 2022, to 20 days as of August 2023
Overbids
Single-Family Homes
The overbid percentage has increased from 96 3% last August 2022, to 104 4% a year later
Condos & Townhomes
The overbid percentage has increased from 97.5% last August 2022, to 103.2% a year later.
Moun View
What's in the data?
There were 42 single providing 0.5 months new listings, and 26 h of $2.6m. The media 106 3%, with an avera
There were 48 condo sale, providing 0.9 m were 28 new listings sale price of $1.3m. T percentage was 101. days on the market.
2.6M n Sale Price
6 Listings s includes all single-family homes, from August 2022 to August 2023. the time the data was gathered. 01511642. Copyright KW Advisors Palo Alto 2023. Each office is independently owned and operated.
1 ays on Market
28 New Listings
30 Sold Listings
0.9 Months of Inventory
101.6% Median Sale vs List 25 Avg Days on Market
Median SalesPrice
Single-Family Homes
The median sales price has decreased from $2 8m last August 2022, to $2 6m as of August 2023
Condos & Townhomes
The median sales price has remained at $1.3m since August 2022.
AVGDays OntheMarket
Single-Family Homes
The average time spent on the market went down from 18 days last August 2022, to 11 days as of August 2023
Condos & Townhomes
The average time spent on the market went down from 28 days in August 2022, to 25 days as of August 2023
Overbids
Single-Family Homes
The overbid percentage has increased from 99 2% last August 2022, to 106 3% a year later
Condos & Townhomes
The overbid percentage has increased from 97.5% last August 2022, to 101.6% a year later.
SanMateo County
What's in the San Mateo Cou data?
There were 513 single-family homes for sale, providing 2 months of inventory. There were 3 new listings, and 143 homes sold at a median price of $1.6m. The median overbid percentag was 101 2%, with an average of 27 days on th market.
There were 206 condo and townhome units fo sale, providing 2.4 months of inventory. There were 121 new listings and 44 units sold at a median sale price of $995k. The median overb percentage was 100%, with an average of 35 d on the market
e-Family
Homes
6 tings of Inventory
143 Sold Listings
$1.6M Median Sale Price
1.2% Sale vs List
27 Avg Days on Market
sourced from InfoSparks and Broker Metrics, includes all single-family homes, townhomes in the California Area above from August 2022 to August 2023. include preliminary data, and may vary from the time the data was gathered. deemed reliable but not guaranteed. DRE# 01511642. Copyright KW Advisors Palo Alto 2023. Each office is independently owned and operated.
SanMateo
AUGUST 2022 - AUGUST 2023
Single-Family Homes
Last 12 months, year-over-year.
Condos & Townhomes
Last 12 months, year-over-year
Median SalesPrice
Single-Family Homes
The median sales price has decreased from $1 8m last August 2022, to $1 6m as of August 2023
Condos & Townhomes
The median sales price has increased from $900k last August 2022, to $995k as of August 2023.
AVGDays OntheMarket
Single-Family Homes
The average time spent on the market went up from 25 days last August 2022, to 27 days as of August 2023
Condos & Townhomes
The average time spent on the market has remained at 35 days since August 2022
Overbids
Single-Family Homes
The overbid percentage has increased from 100% last August 2022, to 101 2% a year later
Condos & Townhomes
The overbid percentage has remained at 100% since last August 2022.
SantaC County
What's in the Santa County data?
There were 846 single-family h providing 1.5 months of inven new listings, and 278 homes s price of $1.7m. The median ov was 103 7%, with an average o market.
398 condo and townhome uni providing 1.6 months of inven new listings and 95 units sold price of $950k. The median ov was 102.3%, with an average o market
rice s single-family homes, 2022 to August 2023. data was gathered. Copyright KW Advisors
362 New Listings
1.6
SantaClaraCounty
AUGUST 2022 - AUGUST 2023
Single-Family Homes
Last 12 months, year-over-year.
Condos & Townhomes
Last 12 months, year-over-year
Median SalesPrice
Single-Family Homes
The median sales price has increased from $1 6m last August 2022, to $1 7m as of August 2023
Condos & Townhomes
The median sales price has increased from $900k last August 2022, to $950k as of August 2023.
AVGDays OntheMarket
Single-Family Homes
The average time spent on the market went down from 25 days last August 2022, to 20 days as of August 2023
Condos & Townhomes
The average time spent on the market went down from 25 days last August 2022, to 18 days as of August 2023
Overbids
Single-Family Homes
The overbid percentage has increased from 99 4% last August 2022, to 103 7% a year later
Condos & Townhomes
The overbid percentage has increased from 100% last August 2022, to 102.3% a year later.
Monterey County
What's in the Monterey County data?
There were 520 single-family homes for sale, providing 1.6 months of inventory. There were 209 new listings and 167 homes sold at a median price of $899k. The median overbid percentage was 96 6%, with an average of 39 days on the market.
There were 54 condo and townhome units for sale, providing 2.3 months of inventory. There were 28 new listings and 20 units sold at a median sale price of $812k. The median overbid percentage was 100.4%, with an average of 23 days on the market
Single-Family Homes
209 New Listings
167 Sold Listings
1.6 Months of Inventory
$899K Median Sale Price
96.6%
Median Sale vs List
39 Avg Days on Market
The data, sourced from InfoSparks and Broker Metrics, includes all single-family homes, condos and townhomes in the California Area above from August 2022 to August 2023. This may include preliminary data, and may vary from the time the data was gathered. All data is deemed reliable but not guaranteed. DRE# 01511642. Copyright KW Advisors Palo Alto 2023. Each office is independently owned and operated.
28 New Listings
Listings
MontereyCounty
AUGUST 2022 - AUGUST 2023
Single-Family Homes
Last 12 months, year-over-year.
Condos & Townhomes
Last 12 months, year-over-year
Median SalesPrice
Single-Family Homes
The median sales price has increased from $840k last August 2022, to $890k as of August 2023
Condos & Townhomes
The median sales price has increased from $532k last August 2022, to $812k as of August 2023.
AVGDays OntheMarket
Single-Family Homes
The average time spent on the market went up from 34 days last August 2022, to 39 days as of August 2023
Condos & Townhomes
The average time spent on the market went down from 31 days in August 2022, to 23 days as of August 2023
Overbids
Single-Family Homes
The overbid percentage has increased from 93 8% last August 2022, to 96 6% a year later
Condos & Townhomes
The overbid percentage has increased from 96.6% last August 2022, to 100.4% a year later.
SantaC County
What's in the Santa County data?
There were 400 single-family h providing 1.9 months of inven new listings, and 122 homes s price of $1.2m. The median ov was 98 3%, with an average of market.
There were 106 condo and tow sale, providing 1.7 months of i were 51 new listings and 29 un sale price of $805k. The media percentage was 99.8%, with an on the market
omes
122
Sold Listings
$1.2M
Median Sale Price
37
Avg Days on Market
Broker Metrics, includes all single-family homes, Area above from August 2022 to August 2023. may vary from the time the data was gathered. guaranteed. DRE# 01511642. Copyright KW Advisors Palo Alto 2023. Each office is independently owned and operated.
New Listings
1.7
Months of Inventory
99.8%
Median Sale vs List
ruzCounty
AUGUST 2022 - AUGUST 2023
Median SalesPrice
Single-Family Homes
The median sales price has decreased from $1 3m last August 2022, to $1 2m as of August 2023
Condos & Townhomes
The median sales price has remained at $805k since last August 2022.
AVGDays OntheMarket
Single-Family Homes
The average time spent on the market went up from 30 days last August 2022, to 37 days as of August 2023
Condos & Townhomes
The average time spent on the market went up from 18 days in August 2022, to 21 days as of August 2023
Overbids
Single-Family Homes
The overbid percentage has increased from 95 5% last August 2022, to 98 3% a year later
Condos & Townhomes
The overbid percentage has increased from 97.3% last August 2022, to 99.8% a year later.
East PaloAlto
What's in the East Palo Alto data?
There were 15 single-family homes for sale, providing 0.9 months of inventory. There were 8 new listings, and 6 homes sold at a median price of $1m. The median overbid percentage was 104 7%, with an average of 19 days on the market
There were 2 condo and townhome units for sale, providing 1 month of inventory. There was 1 new listing and 2 units sold at a median sale price of $820k. The median overbid percentage was 97.2%, with an average of 1 day on the market.
Single-Family Homes
8 New Listings
6 Sold Listings
0.9 Months of Inventory
$1M Median Sale Price
104.7% Median Sale vs List
19 Avg Days on Market
The data, sourced from InfoSparks and Broker Metrics, includes all single-family homes, condos and townhomes in the California Area above from August 2022 to August 2023. This may include preliminary data, and may vary from the time the data was gathered. All data is deemed reliable but not guaranteed. DRE# 01511642. Copyright KW Advisors Palo Alto 2023. Each office is independently owned and operated.
1 New Listings
1
2 Sold Listings
Median SalesPrice
Single-Family Homes
The median sales price has increased from $972k last August 2022, to $1m as of August 2023
Condos & Townhomes
The median sales price has decreased from $890k last August 2022, to $820k as of August 2023.
AVGDays OntheMarket
Single-Family Homes
The average time spent on the market went down from 33 days last August 2022, to 19 days as of August 2023
Condos & Townhomes
The average time spent on the market went up from 0 days in August 2022, to 1 day as of August 2023
Overbids
Single-Family Homes
The overbid percentage has increased from 104 2% last August 2022, to 104 7% a year later
Condos & Townhomes
The overbid percentage has decreased from 100.1% last August 2022, to 97.2% a year later.
Sunnyvale
What's in the Sunnyvale data?
There were 61 single-family homes for sale, providing 0.3 months of inventory. There were 43 new listings, and 43 homes sold at a median price of $2.1m. The median overbid percentage was 107.4%, with an average of 15 days on the market.
There were 38 condo and townhome units for sale, providing 0.7 months of inventory. There were 25 new listings and 22 units sold at a median sale price of $1.2m. The median overbid percentage was 100.8%, with an average of 20 days on the market.
Single-Family Homes
43 New Listings
43 Sold Listings
0.3 Months of Inventory
$2.1M Median Sale Price
107.4% Median Sale vs List
15 Avg Days on Market
The data, sourced from InfoSparks and Broker Metrics, includes all single-family homes, condos and townhomes in the California Area above from August 2022 to August 2023. This may include preliminary data, and may vary from the time the data was gathered. All data is deemed reliable but not guaranteed. DRE# 01511642. Copyright KW Advisors Palo Alto 2023. Each office is independently owned and operated.
25 New Listings
22 Sold Listings
0.7 Months of Inventory
100.8% Median Sale vs List 20 Avg Days on Market
Sunnyvale
AUGUST 2022 - AUGUST 2023
Single-Family Homes
Last 12 months, year-over-year.
Condos & Townhomes
Last 12 months, year-over-year
Median SalesPrice
Single-Family Homes
The median sales price has increased from $2m last August 2022, to $2 1m as of August 2023
Condos & Townhomes
The median sales price has increased from $1.4m last August 2022, to $1.2m as of August 2023.
AVGDays OntheMarket
Single-Family Homes
The average time spent on the market went down from 16 days last August 2022, to 15 days as of August 2023
Condos & Townhomes
The average time spent on the market went down from 27 days in August 2022, to 20 days as of August 2023
Overbids
Single-Family Homes
The overbid percentage has increased from 97 2% last August 2022, to 107 4% a year later
Condos & Townhomes
The overbid percentage has increased from 99.1% last August 2022, to 100.8% a year later.
SantaClara City
What's in the Santa Clara City data?
There were 63 single-family homes for sale, providing 0.7 months of inventory. There were 45 new listings and 34 homes sold at a median price of $1.9M. The median overbid percentage was 110 5%, with an average of 10 days on the market
39 condo and townhome units were for sale, providing 1.6 months of inventory. There were 28 new listings and 17 units sold at a median sale price of $915k. The median overbid percentage was 104%, with an average of 12 days on the market.
Single-Family Homes
45 New Listings
34 Sold Listings
0.7 Months of Inventory
$1.9M Median Sale Price
110.5% Median Sale vs List
10 Avg Days on Market
The data, sourced from InfoSparks and Broker Metrics, includes all single-family homes, condos and townhomes in the California Area above from August 2022 to August 2023. This may include preliminary data, and may vary from the time the data was gathered. All data is deemed reliable but not guaranteed. DRE# 01511642. Copyright KW Advisors Palo Alto 2023. Each office is independently owned and operated.
28
SantaClaraCity
AUGUST 2022 - AUGUST 2023
Single-Family Homes
Last 12 months, year-over-year.
Condos & Townhomes
Last 12 months, year-over-year
Median SalesPrice
Single-Family Homes
The median sales price has increased from $1 6m last August 2022, to $1 9m as of August 2023
Condos & Townhomes
The median sales price has increased from $895k last August 2022, to $915k as of August 2023.
AVGDays OntheMarket
Single-Family Homes
The average time spent on the market went down from 22 days last August 2022, to 10 days as of August 2023
Condos & Townhomes
The average time spent on the market went down from 27 days in August 2022, to 12 days as of August 2023
Overbids
Single-Family Homes
The overbid percentage has increased from 98 9% last August 2022, to 110 5% a year later
Condos & Townhomes
The overbid percentage has increased from 100% last August 2022, to 104.0% a year later.
Sa
What'
There we providing new listin of $4.2m 98.1%, wi
There we providing new listin of $1.2m 96.8%, wi
Msingle-family homes, August 2023. was gathered. KW Advisors et
1
New Listings
2 Sold Listings
0.3
Months of Inventory
$1.2M
Median Sale Price 96.8%
Median Sale vs List
12 Avg Days on Market
Saratoga
AUGUST 2022 - AUGUST 2023
Single-Family Homes
Last 12 months, year-over-year.
Condos & Townhomes
Last 12 months, year-over-year
Median SalesPrice
Single-Family Homes
The median sales price has increased from $3 7m last August 2022, to $4 2m as of August 2023
Condos & Townhomes
The median sales price has decreased from $1.8m last August 2022, to $1.2m as of August 2023.
AVGDays OntheMarket
Single-Family Homes
The average time spent on the market went down from 28 days last August 2022, to 22 days as of August 2023
Condos & Townhomes
The average time spent on the market went down from 14 days in August 2022, to 12 days as of August 2023
Overbids
Single-Family Homes
The overbid percentage has increased from 94 4% last August 2022, to 98 1% a year later
Condos & Townhomes
The overbid percentage has increased from 89.6% last August 2022, to 96.8% a year later.