The Cunningham Group - September 2023 Market Report | Fremont
Fremont area
Milpitas
Jump to Milpitas Report
Fremont
Jump to Fremont City Report
Newark
Jump to Newark Report
Union City
Jump to Union City Report
Hayward
Jump to Hayward Report
Castro Valley
Jump to Castro Valley Report
San Leandro
Jump to San Leandro Report
Tri-Cities
(Fremont, Newark & Union City)
Jump to Tri-Cities Report
Pleasanton
Jump to Pleasanton Report
San Ramon
Jump to San Ramon Report
Livermore
Jump to Livermore Report
What’syourhome reallyworthin today’smarket?
That's the question you should be asking yourself.
Our market is incredibly diverse and rapidly changing. Values vary not just by neighborhood but by street. Your home isn't necessarily worth what your neighbors' home is. It's the current market that sets the value of your home.
So, do you know what your home is worth in today's market?
Icanhelp...
Contact me for a confidential, no obligation assessment of your home's value.
MortgageRates:Past,Present, andPossibleFuture
If you’re hoping to buy a home this year, you’re probably paying close attention to mortgage rates. Since mortgage rates impact what you can afford when you take out a home loan – and affordability is a challenge today – it’s a good time to look at the big picture of where mortgage rates have been historically compared to where they are now. Beyond that, it’s important to understand their relationship with inflation for insights into where mortgage rates might go in the near future.
Giving Context to the Sticker Shock
Freddie Mac has been tracking the 30-year fixed mortgage rate since April of 1971. Every week, they release the results of their Primary Mortgage Market Survey, which averages mortgage application data from lenders across the country.
1
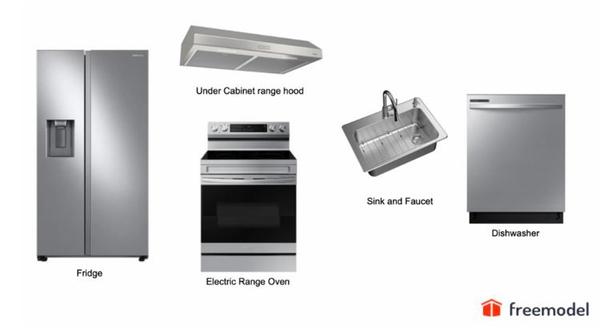
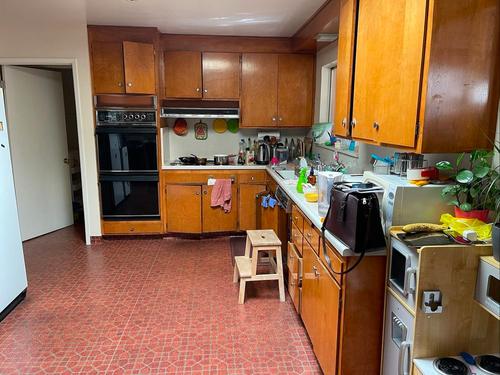
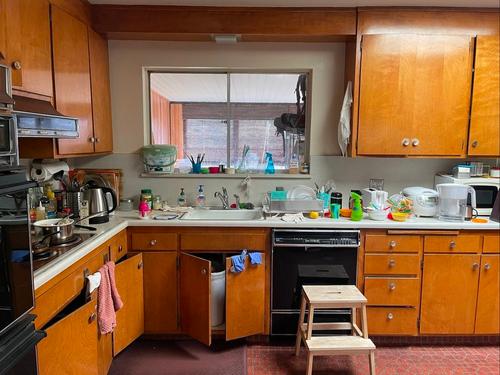
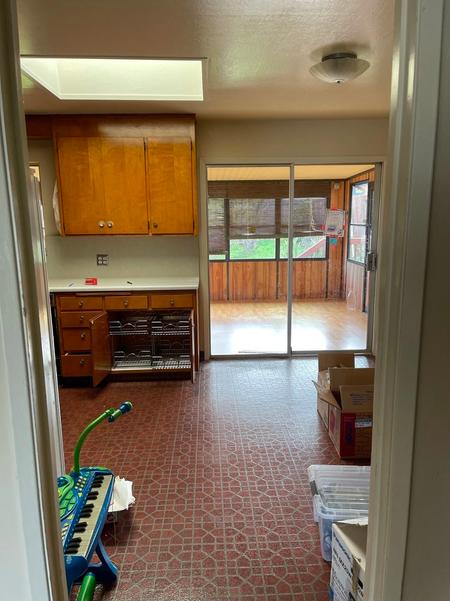
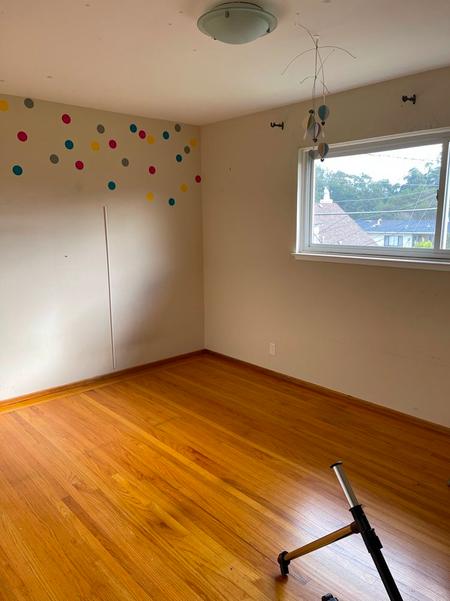
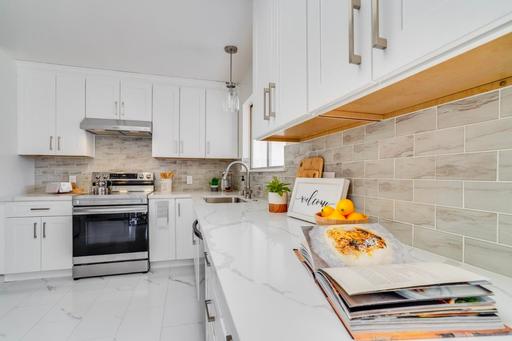
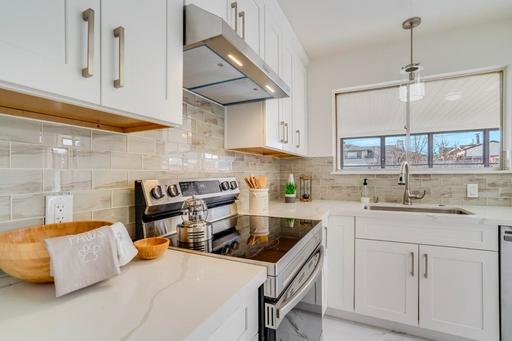
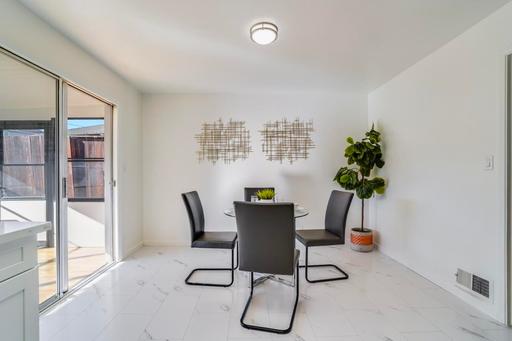
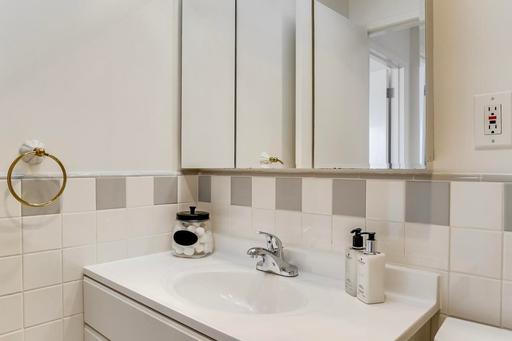
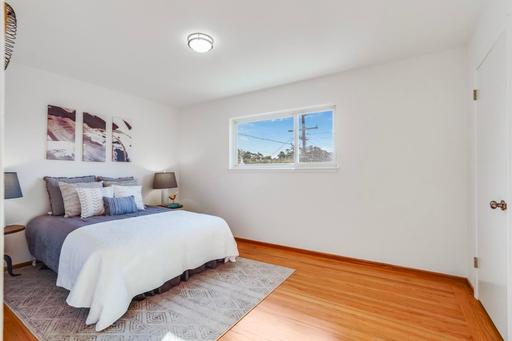
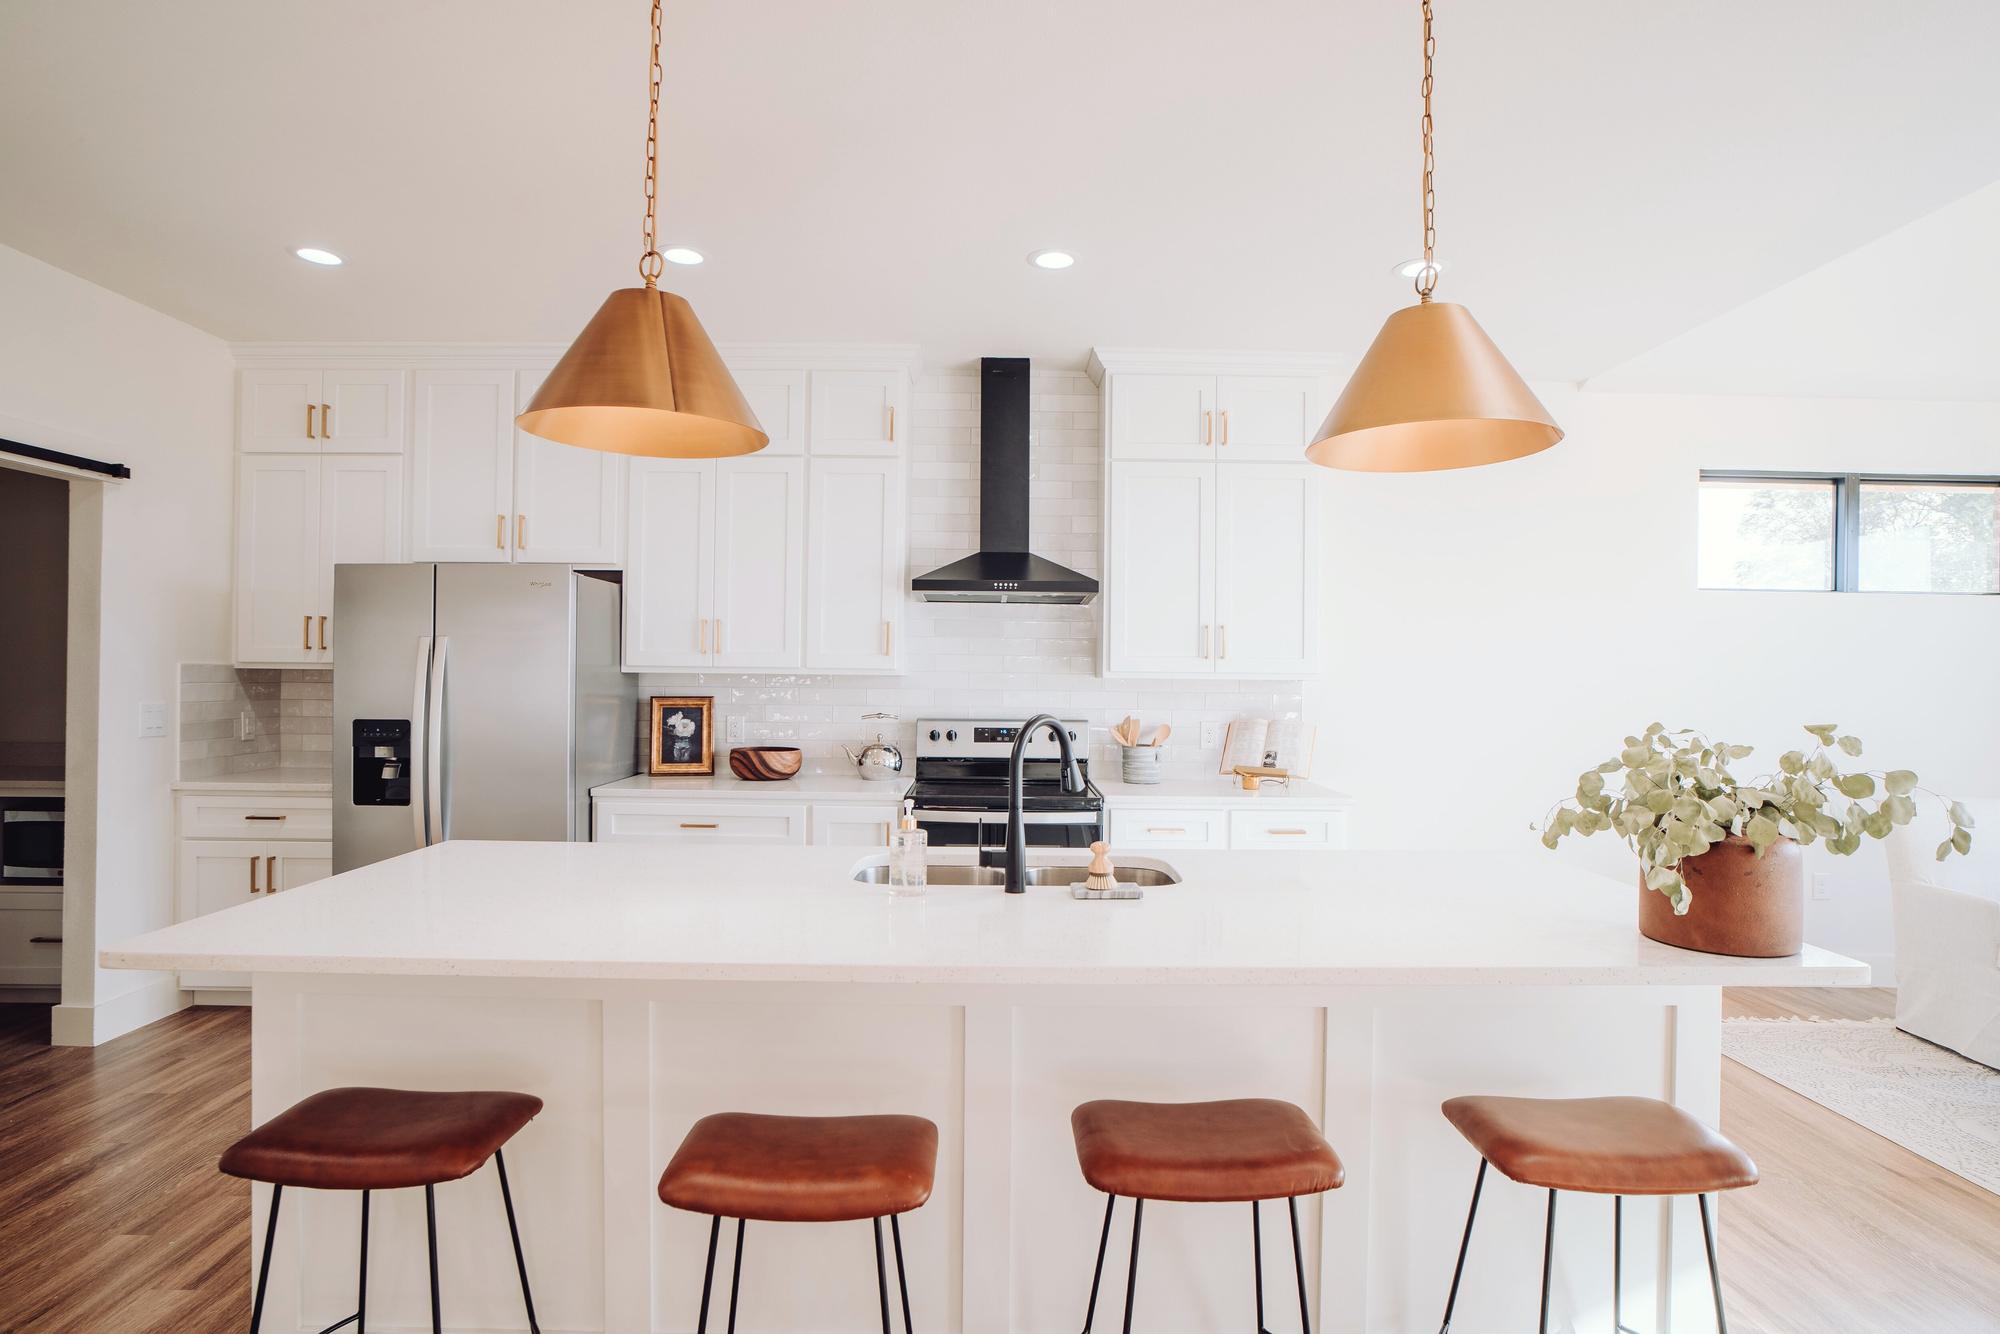
Home Concierge's secret weapon is our local project directors, who visit and personally manage each of our projects. When the agent reached out with a tight deadline, project director Azary Khalfan took it in stride and immediately called on her local vendors and subcontractors. Our in-house designer, Samantha Black, worked quickly over the holidays to design a new kitchen while Azary ordered finishes for other parts of the home. Ingenuity, strong vendor connections, and hard work transformed the kitchen in 17 days! The home sold for over $400,000 over asking in just one week.
BEFORE AFTER
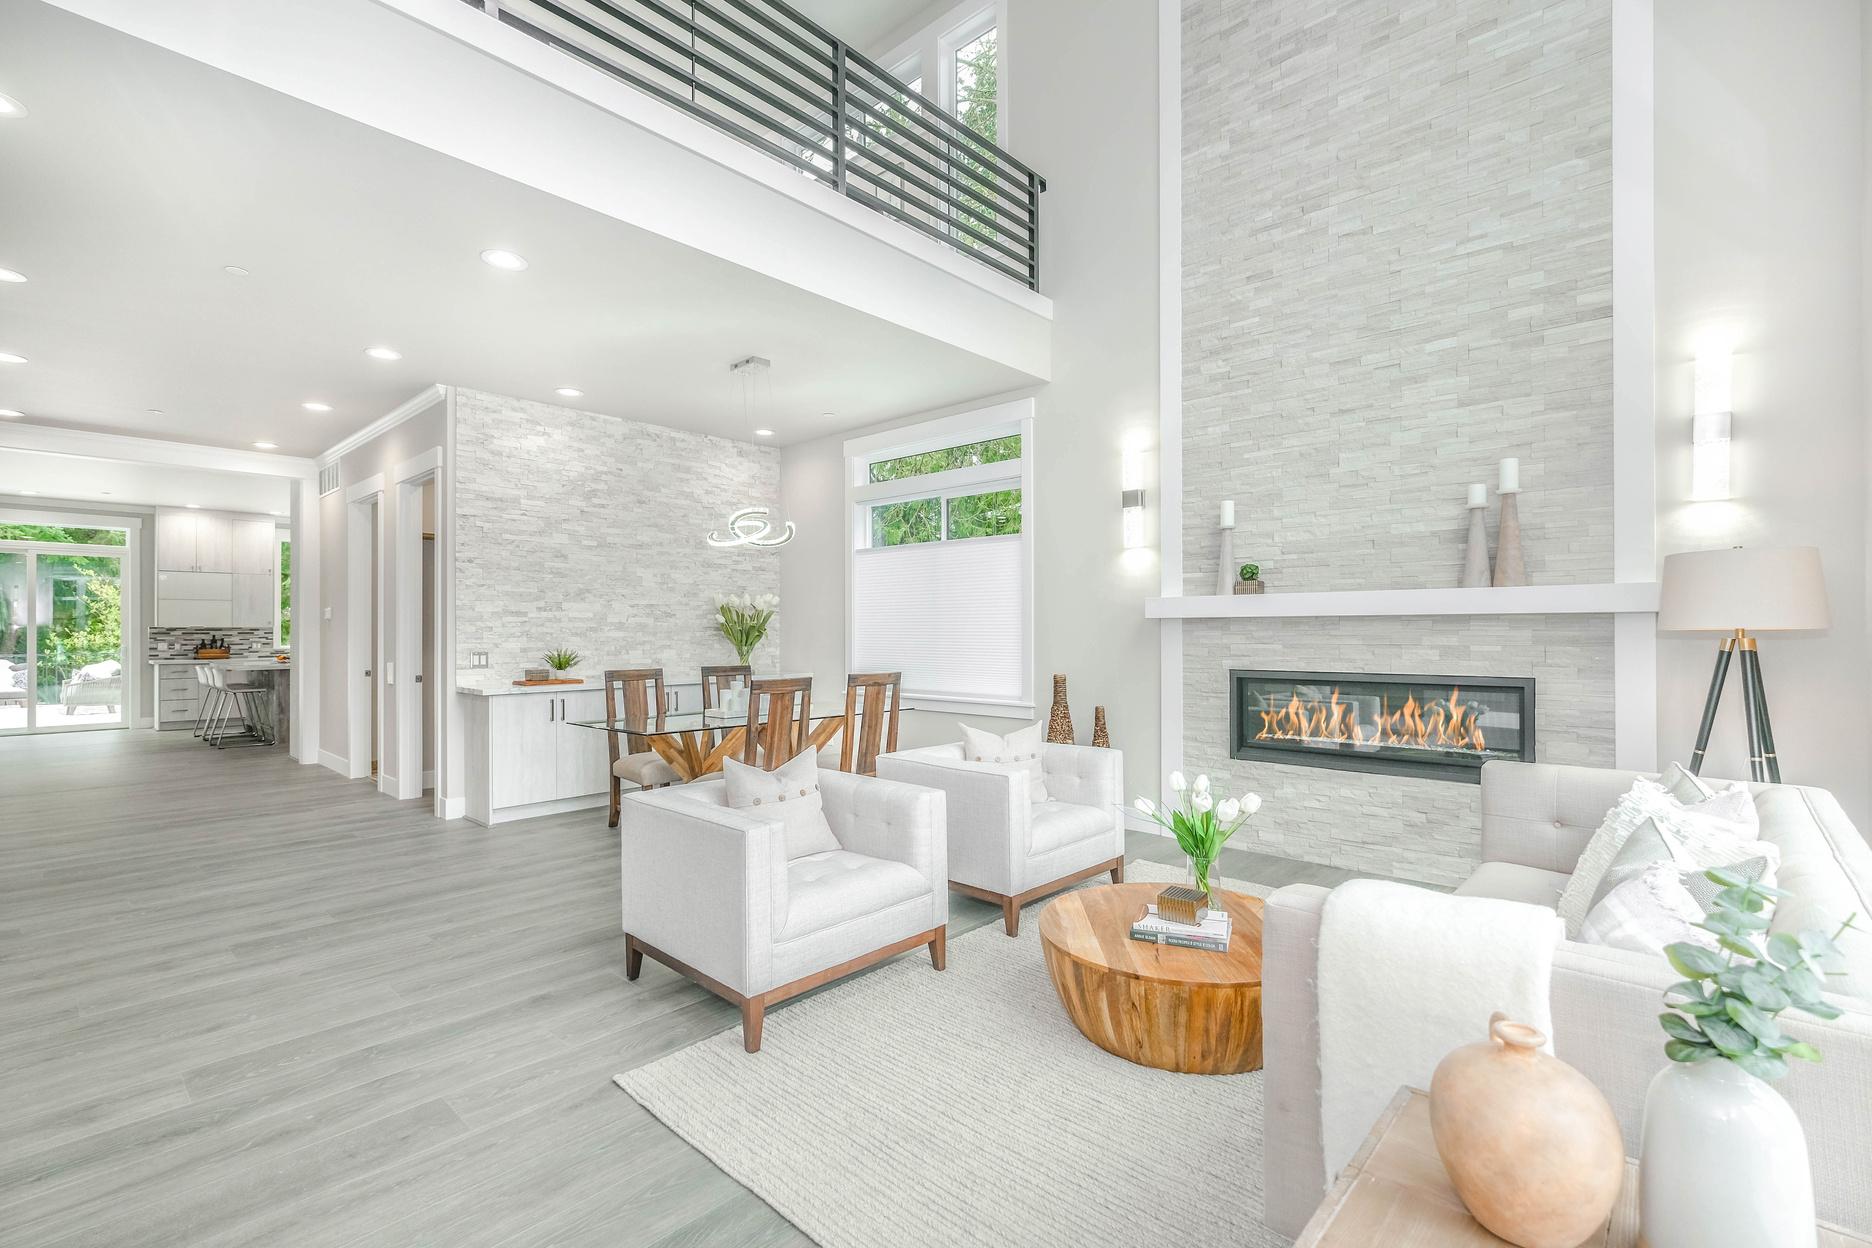
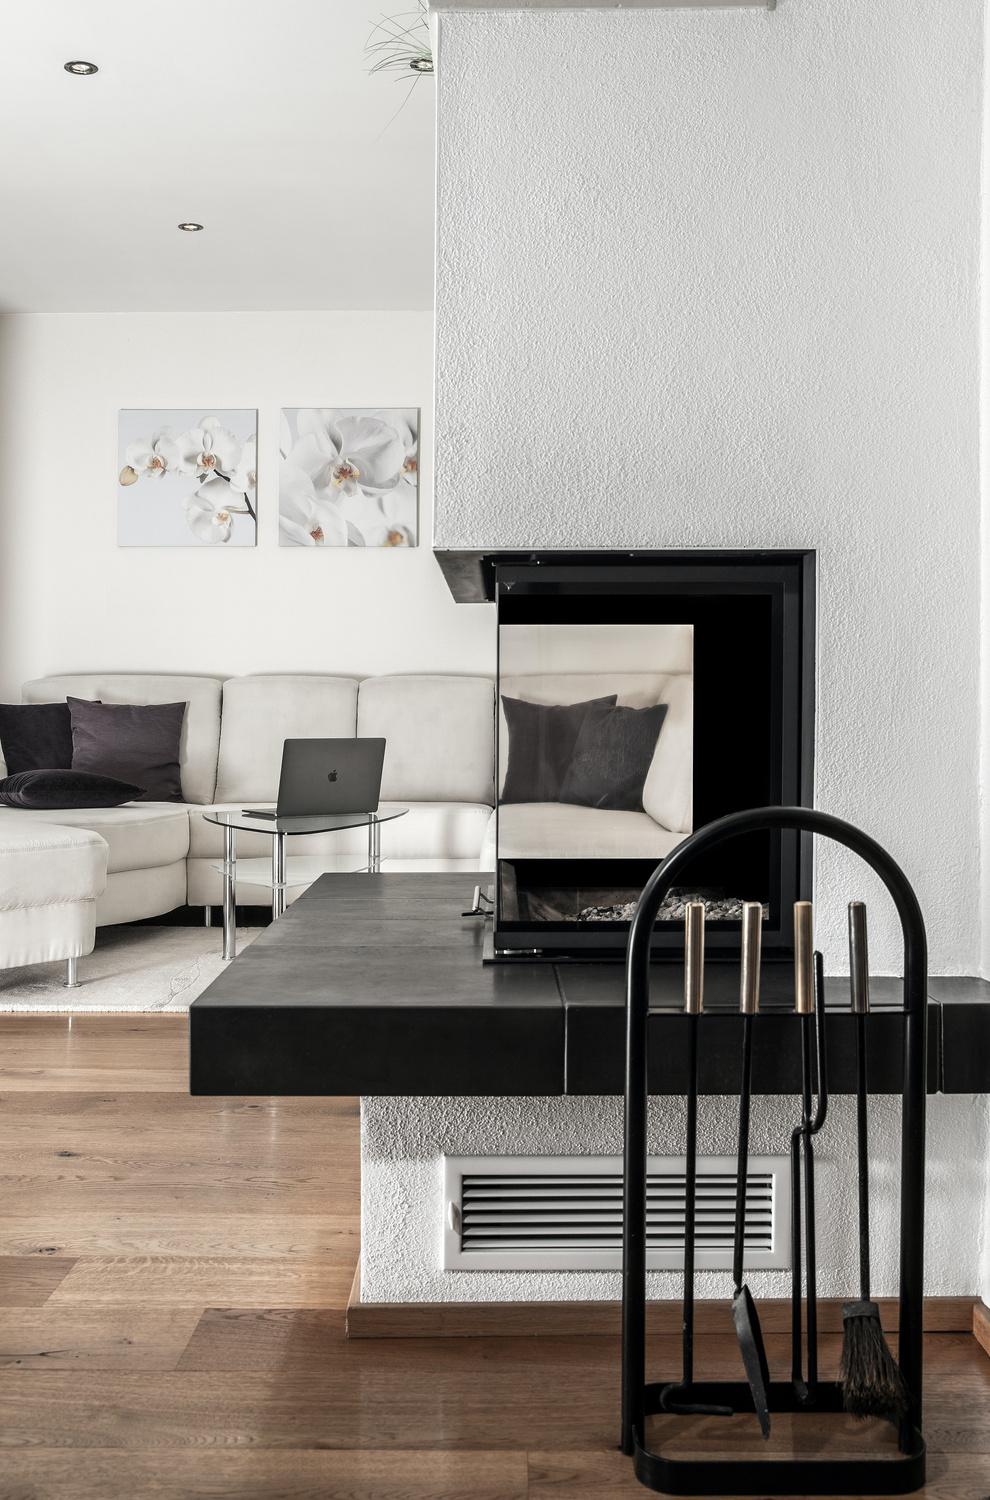
Tips to Harden Your Home During Wildfires
Source: Cal Fire
ROOF
Build your roof or re-roof with materials such as composition, metal, clay, or tile Remove any vegetative debris from the roof.
VENTS
Remove all openings with 1/16-inch to 1/4-inch metal mesh Do not use fiberglass or plastic mesh because they can melt and burn
EAVES + SOFFITS
Eaves should be boxed in and protected with ignition-resistant or non-combustible materials.
WINDOWS
Install dual-paned windows with one pane of tempered glass to reduce the chance of breakage in a fire.
WALLS
Use ignition-resistant materials, such as stucco, fiber cement, wall siding, fire retardant, treated wood, etc.
DECKS
Create an ember-resistant zone around and under all decks and clear debris from under your deck.
FENCES
Separate your fences from your house or upgrade the last 5 feet of the fence to a non-combustible material.
GUTTERS
Keep rain gutters clear or enclose rain gutters to prevent accumulation of plant debris
DRIVEWAY
Driveways should be built and maintained in accordance with state and local codes to allow fire and emergency vehicles to reach
CHIMNEY
Close the fireplace during fire season when the chimney is not being used.
PATIO COVER
Use the same ignitionresistant materials for patio coverings as a roof
DECKS
Have a fire extinguisher and tools such as a shovel, rake, bucket, and hose available for fire
BroughtToYouBy:
MWhat'
There we providing new listin of $1.6m 104.8%, w
There we sale, prov were 27 n price of $ 102.7%, w
Mcondos and may include data is deemed Fremont 2023. et
2 New List
1. Months of Inven
102.7%
Median Sale vs
Median SalesPrice
Single-Family Homes
The median sales price has increased from $1 5m last August 2022, to $1 6m as of August 2023
Condos & Townhomes
The median sales price has decreased from $1.1m last August 2022, to $1m as of August 2023.
AVGDays OntheMarket
Single-Family Homes
The average time spent on the market went down from 20 days last August 2022, to 14 days as of August 2023
Condos & Townhomes
The average time spent on the market went down from 31 days in August 2022, to 12 days as of August 2023
Overbids
Single-Family Homes
The overbid percentage has increased from 96 6% last August 2022, to 104 8% a year later
Condos & Townhomes
The overbid percentage has increased from 100.5% last August 2022, to 102.7% a year later.
Fremont
What's in the Fremont data?
There were 156 single-family homes for sale, providing 0.5 months of inventory. There were 100 new listings, and 69 homes sold at a median price of $1.6m. The median overbid percentage was 105.9%, with an average of 13 days on the market.
There were 129 condo and townhome units for sale, providing 1.4 months of inventory. There were 68 new listings and 39 units sold at a median price of $835k. The median overbid percentage was 102.4%, with an average of 18 days on the market.
Single-Family Homes
100 New Listings
69 Sold Listings
0.5 Months of Inventory
$1.6M Median Sale Price
105.9% Median Sale vs List
13 Avg Days on Market
The data, sourced from Broker Metrics, includes all single-family homes, condos and townhomes in the California Area from August 2022 to August 2023. This may include preliminary data, and may vary from the time the data was gathered. All data is deemed reliable but not guaranteed. DRE# 01345026. Copyright KW Advisors Fremont 2023. Each office is independently owned and operated.
68 New Listings
39 Sold Listings
1.4 Months of Inventory
$835K Median Sale Price 102.4% Median Sale vs List 18 Avg Days on Market
Median SalesPrice
Single-Family Homes
The median sales price has increased from $1 4m last August 2022, to $1 6m as of August 2023
Condos & Townhomes
The median sales price has increased from $823k last August 2022, to $835k as of August 2023.
AVGDays OntheMarket
Single-Family Homes
The average time spent on the market went down from 25 days last August 2022, to 13 days as of August 2023
Condos & Townhomes
The average time spent on the market went down from 28 days in August 2022, to 18 days as of August 2023
Overbids
Single-Family Homes
The overbid percentage has increased from 94 2% last August 2022, to 105 9% a year later
Condos & Townhomes
The overbid percentage has increased from 99.3% last August 2022, to 102.4% a year later.
Newark
What's in the Newark data?
There were 50 single-family homes for sale, providing 0.7 months of inventory. There we new listings, and 26 homes sold at a median of $1.3m. The median overbid percentage w 107.9%, with an average of 15 days on the m
There were 12 condo and townhome units fo sale, providing 0.7 months of inventory. Ther were 9 new listings and 10 units sold at a me price of $744k. The median overbid percenta was 104.5%, with an average of 6 days on th market.
e-Family
Homes
ngs
7 f Inventory
26 Sold Listings
$1.3M Median Sale Price
7.9% ale vs List
15 Avg Days on Market
sourced from Broker Metrics, includes all single-family homes, condos and the California Area from August 2022 to August 2023. This may include ata, and may vary from the time the data was gathered. All data is deemed guaranteed. DRE# 01345026. Copyright KW Advisors Fremont 2023. Each office is independently owned and operated.August
Newark
AUGUST 2022 - AUGUST 2023
Single-Family Homes
Last 12 months, year-over-year.
Condos & Townhomes
Last 12 months, year-over-year
Median SalesPrice
Single-Family Homes
The median sales price has increased from $1 2m last August 2022, to $1 3m as of August 2023
Condos & Townhomes
The median sales price has decreased from $745k last August 2022, to $744k as of August 2023.
AVGDays OntheMarket
Single-Family Homes
The average time spent on the market went down from 34 days last August 2022, to 15 days as of August 2023
Condos & Townhomes
The average time spent on the market went down from 22 days in August 2022, to 6 days as of August 2023
Overbids
Single-Family Homes
The overbid percentage has increased from 96 4% last August 2022, to 107 9% a year later
Condos & Townhomes
The overbid percentage has increased from 99% last August 2022, to 104.5% a year later.
Union
What's in the Unio
There were 41 single-family providing 0.7 months of inve new listings and 28 homes s of $1.3m. The median overb 103.5%, with an average of 1
There were 21 condo and to sale, providing 1.1 months o were 11 new listings and 6 u price of $612k. The median was 105.2%, with an averag market.
omes
28 Sold Listings
$1.3M
Median Sale Price
12
Avg Days on Market
includes all single-family homes, condos and August 2022 to August 2023. This may include time the data was gathered. All data is deemed 01345026. Copyright KW Advisors Fremont 2023. Each office is independently owned and operated.
UnionCity
AUGUST 2022 - AUGUST 2023
gle-Family Homes
st 12 months, year-over-year.
ndos & Townhomes st 12 months, year-over-year
Median SalesPrice
Single-Family Homes
The median sales price has remained at $1 3m since last August 2022
Condos & Townhomes
The median sales price has decreased from $605k last August 2022, to $612k as of August 2023.
AVGDays OntheMarket
Single-Family Homes
The average time spent on the market went down from 28 days last August 2022, to 12 days as of August 2023
Condos & Townhomes
The average time spent on the market went down from 20 days last August 2022, to 12 days as of August 2023
Overbids
Single-Family Homes
The overbid percentage has increased from 92% last August 2022, to 103 5% a year later
Condos & Townhomes
The overbid percentage has increased from 96.3% last August 2022, to 105.2% a year later.
Hayward
What's in the Hayward data?
There were 156 single-family homes for sale, providing 1 month of inventory. There were 94 new listings, and 67 homes sold at a median price of $915k. The median overbid percentage was 103.3%, with an average of 13 days on the market.
There were 65 condo and townhome units for sale, providing 1.1 months of inventory. There were 33 new listings and 22 units sold at a median price of $600k. The median overbid percentage was 101.1%, with an average of 19 days on the market.
e-Family Homes
ngs Inventory
67 Sold Listings
$915K Median Sale Price
3.3% ale vs List
13 Avg Days on Market
sourced from Broker Metrics, includes all single-family homes, condos and the California Area from August 2022 to August 2023. This may include ata, and may vary from the time the data was gathered. All data is deemed not guaranteed. DRE# 01345026. Copyright KW Advisors Fremont 2023. Each office is independently owned and operated.
AUGUST 2022 - AUGUST 2023
Single-Family Homes
Last 12 months, year-over-year.
Condos & Townhomes
Last 12 months, year-over-year
Median SalesPrice
Single-Family Homes
The median sales price has increased from $900k last August 2022, to $915k as of August 2023
Condos & Townhomes
The median sales price has increased from $591k last August 2022, to $600k as of August 2023.
AVGDays OntheMarket
Single-Family Homes
The average time spent on the market went down from 26 days last August 2022, to 13 days as of August 2023
Condos & Townhomes
The average time spent on the market went down from 25 days last August 2022, to 19 days as of August 2023
Overbids
Single-Family Homes
The overbid percentage has increased from 98 4% last August 2022, to 103 3% a year later
Condos & Townhomes
The overbid percentage has decreased from 101.3% last August 2022, to 101.1% a year later.
Castr Valle
What's in the data?
There were 54 single providing 0.8 months new listings, and 38 h of $1.2m. The media 102%, with an averag
There were 6 condo a providing 2 months o new listings and 0 un $0. The median overb an average of 48 day
1.2M n Sale Price
8 Listings s single-family homes, condos and August 2023. This may include was gathered. All data is deemed Copyright KW Advisors Fremont 2023.
4 ays on Market
AUGUST 2022 - AUGUST 2023
Median SalesPrice
Single-Family Homes
The median sales price has increased from $1 1m last August 2022, to $1 2m as of August 2023
Condos & Townhomes
The median sales price has decreased from $877k last August 2022, to $0 as of August 2023.
AVGDays OntheMarket
Single-Family Homes
The average time spent on the market went down from 29 days last August 2022, to 14 days as of August 2023
Condos & Townhomes
The average time spent on the market went up from 24 days in August 2022, to 48 days as of August 2023
Overbids
Single-Family Homes
The overbid percentage has increased from 94 8% last August 2022, to 102% a year later
Condos & Townhomes
The overbid percentage has decreased from 95.6% last August 2022, to 0% a year later.
San Leandro
What's in the San Leandro data?
There were 88 single-family homes for sale, providing 0.7 months of inventory. There we new listings, and 46 homes sold at a median of $900k. The median overbid percentage w 106.3%, with an average of 12 days on the m
There were 18 condo and townhome units f sale, providing 3.2 months of inventory. The were 10 new listings and 16 units sold at a m price of $575k. The median overbid percent was 100 9%, with an average of 20 days on market.
Single-Family Homes
55 New Listings
46 Sold Listings
0.7 Months of Inventory
$900K Median Sale Price
106.3%
Median Sale vs List
12
Avg Days on Market
The data, sourced from Broker Metrics, includes all single-family homes, condos and townhomes in the California Area from August 2022 to August 2023. This may include preliminary data, and may vary from the time the data was gathered. All data is deemed reliable but not guaranteed. DRE# 01345026. Copyright KW Advisors Fremont 2023. Each office is independently owned and operated.
New Listings
3.2 Months of Inventory $5 Me 100.9%
Median Sale vs List Avg D
Median SalesPrice
Single-Family Homes
The median sales price has increased from $825k last August 2022, to $900k as of August 2023
Condos & Townhomes
The median sales price has increased from $502k last August 2022, to $575k as of August 2023.
AVGDays OntheMarket
Single-Family Homes
The average time spent on the market went down from 34 days last August 2022, to 12 days as of August 2023
Condos & Townhomes
The average time spent on the market went down from 26 days in August 2022, to 20 days as of August 2023
Overbids
Single-Family Homes
The overbid percentage has increased from 98 9% last August 2022, to 106 3% a year later
Condos & Townhomes
The overbid percentage has increased from 100.6% last August 2022, to 100.9% a year later.
Tri-Cities
What's in the Tri-Cities data?
There were 247 single-family homes for sale, providing 0 6 months of inventory There were 157 new listings, and 123 homes sold at a median price of $1.5m. The median overbid percentage was 105.7%, with an average of 13 days on the market.
There were 162 condo and townhome units for sale, providing 1.3 months of inventory. There were 88 new listings and 55 units sold at a median price of $780k. The median overbid percentage was 103%, with an average of 16 days on the market.
AUGUST 2022 - AUGUST 2023 es ar-over-year.
Median SalesPrice
Single-Family Homes
The median sales price has increased from $1 3m last August 2022, to $1 5m as of August 2023
Condos & Townhomes
The median sales price has decreased from $795k last August 2022, to $780k as of August 2023.
AVGDays OntheMarket
Single-Family Homes
The average time spent on the market went down from 28 days last August 2022, to 13 days as of August 2023
Condos & Townhomes
The average time spent on the market went down from 26 days last August 2022, to 16 days as of August 2023
Overbids
Single-Family Homes
The overbid percentage has increased from 94 2% last August 2022, to 105 7% a year later
Condos & Townhomes
The overbid percentage has increased from 98.9% last August 2022, to 103% a year later.
Pleasanton
What's in the Pleasanton data?
There were 81 single-family homes for sale, providing 0.7 months of inventory. There were 52 new listings, and 38 homes sold at a median price of $1.8m. The median overbid percentage was 99.8%, with an average of 10 days on the market.
There were 19 condo and townhome units for sale, providing 0.2 months of inventory. There were 12 new listings and 15 units sold at a median price of $875k. The median overbid percentage was 100.1%, with an average of 14 days on the market.
Single-Family Homes
52 New Listings
38 Sold Listings
0.7 Months of Inventory
$1.8M Median Sale Price
99.8% Median Sale vs List
10 Avg Days on Market
The data, sourced from Broker Metrics, includes all single-family homes, condos and townhomes in the California Area from August 2022 to August 2023. This may include preliminary data, and may vary from the time the data was gathered. All data is deemed reliable but not guaranteed. DRE# 01345026. Copyright KW Advisors Fremont 2023. Each office is independently owned and operated.
Median SalesPrice
Single-Family Homes
The median sales price has increased from $1 5m last August 2022, to $1 8m as of August 2023
Condos & Townhomes
The median sales price has increased from $650k last August 2022, to $875k as of August 2023.
AVGDays OntheMarket
Single-Family Homes
The average time spent on the market went down from 26 days last August 2022, to 10 days as of August 2023
Condos & Townhomes
The average time spent on the market went down from 27 days last August 2022, to 14 days as of August 2023
Overbids
Single-Family Homes
The overbid percentage has increased from 93 2% last August 2022, to 99 8% a year later
Condos & Townhomes
The overbid percentage has increased from 99.3% last August 2022, to 100.1% a year later.
SanR
What's in the
There were 67 singleproviding 0.4 months new listings and 42 ho of $1.6m. The median 102.7%, with an avera
There were 48 condo sale, providing 1 mon 31 new listings and 15 price of $890k. The m was 100.7%, with an a market.
1.6M an Sale Price
2 d Listings s single-family homes, condos and to August 2023. This may include was gathered. All data is deemed Copyright KW Advisors Fremont 2023.
4 Days on Market
31
1
SanRamon
AUGUST 2022 - AUGUST 2023
Single-Family Homes
Last 12 months, year-over-year.
Condos & Townhomes
Last 12 months, year-over-year
Median SalesPrice
Single-Family Homes
The median sales price has decreased from $1 8m last August 2022, to $1 6m as of August 2023
Condos & Townhomes
The median sales price has increased from $782k last August 2022, to $890k as of August 2023.
AVGDays OntheMarket
Single-Family Homes
The average time spent on the market went down from 30 days last August 2022, to 14 days as of August 2023
Condos & Townhomes
The average time spent on the market went down from 31 days in August 2022, to 17 days as of August 2023
Overbids
Single-Family Homes
The overbid percentage has increased from 92 8% last August 2022, to 102 7% a year later
Condos & Townhomes
The overbid percentage has increased from 96% last August 2022, to 100.7% a year later.
Liver
What's in the
There were 121 single providing 0.7 months new listings and 56 ho of $1.3m. The median 104.3%, with an avera
There were 33 condo sale, providing 0.7 mo were 18 new listings a price of $890k. The m was 100.4%, with an a market.
1.3M an Sale Price
6 d Listings s single-family homes, condos and to August 2023. This may include was gathered. All data is deemed Copyright KW Advisors Fremont 2023.
3 Days on Market
18
Livermore
AUGUST 2022 - AUGUST 2023
Single-Family Homes
Last 12 months, year-over-year.
Condos & Townhomes
Last 12 months, year-over-year
Median SalesPrice
Single-Family Homes
The median sales price has increased from $1 1m last August 2022, to $1 3m as of August 2023
Condos & Townhomes
The median sales price has increased from $785k last August 2022, to $890k as of August 2023.
AVGDays OntheMarket
Single-Family Homes
The average time spent on the market went down from 28 days last August 2022, to 13 days as of August 2023
Condos & Townhomes
The average time spent on the market has remained at 20 days since August 2022
Overbids
Single-Family Homes
The overbid percentage has increased from 94 3% last August 2022, to 104 3% a year later
Condos & Townhomes
The overbid percentage has increased from 98% last August 2022, to 100.4% a year later.