The Cunningham Group - September 2023 Market Report | Peninsula Estates
Peninsula Estates
San Francisco County
Jump to San Francisco County Report
San Mateo County
Jump to San Mateo County Report
Belmont
Jump to Belmont Report
Jump to Burlingame Report Burlingame
Jump to Daly City Report Daly City
Foster City
Jump to Foster City Report
Half Moon Bay
Jump to Half Moon Bay Report
Hillsborough
Jump to Hillsborough Report
Jump to Millbrae Report
Jump to Pacifica Report
San Bruno
Jump to San Bruno Report
San Carlos
Jump to San Carlos Report
San Mateo
Jump to San Mateo Report
South San Francisco
Jump to South San Francisco Report
What’syourhome reallyworthin today’smarket?
That's the question you should be asking yourself.
Our market is incredibly diverse and rapidly changing. Values vary not just by neighborhood but by street. Your home isn't necessarily worth what your neighbors' home is. It's the current market that sets the value of your home.
So, do you know what your home is worth in today's market?
Icanhelp...
Contact me for a confidential, no obligation assessment of your home's value.
MortgageRates:Past,Present, andPossibleFuture
If you’re hoping to buy a home this year, you’re probably paying close attention to mortgage rates. Since mortgage rates impact what you can afford when you take out a home loan – and affordability is a challenge today – it’s a good time to look at the big picture of where mortgage rates have been historically compared to where they are now. Beyond that, it’s important to understand their relationship with inflation for insights into where mortgage rates might go in the near future.
Giving Context to the Sticker Shock
Freddie Mac has been tracking the 30-year fixed mortgage rate since April of 1971. Every week, they release the results of their Primary Mortgage Market Survey, which averages mortgage application data from lenders across the country.
1
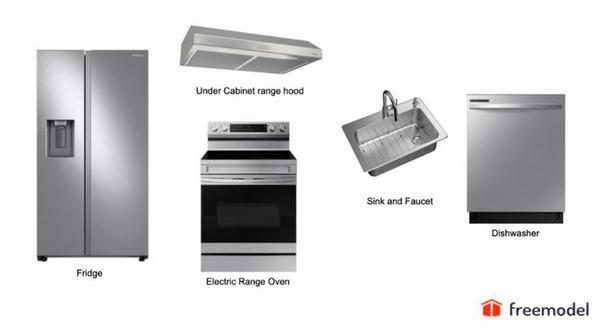
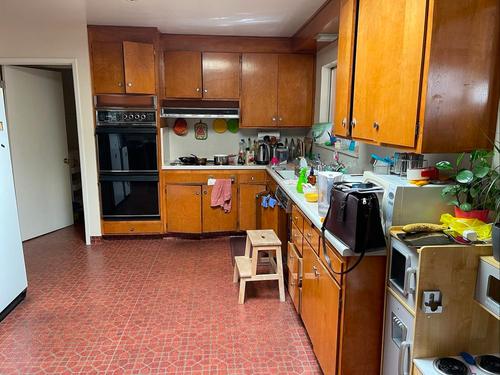
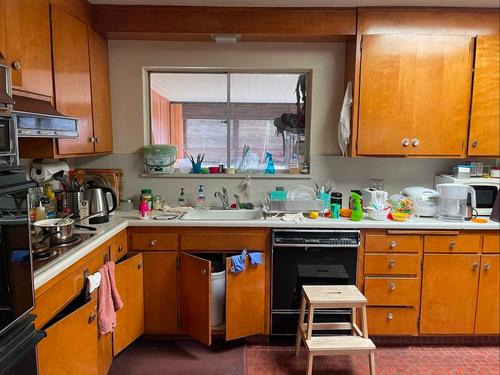
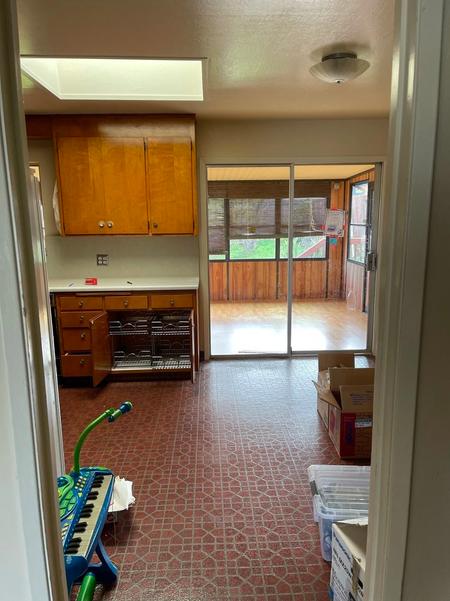
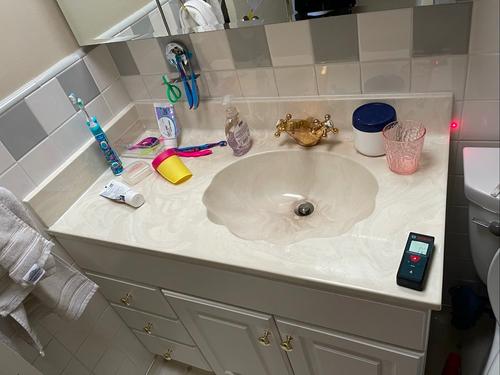
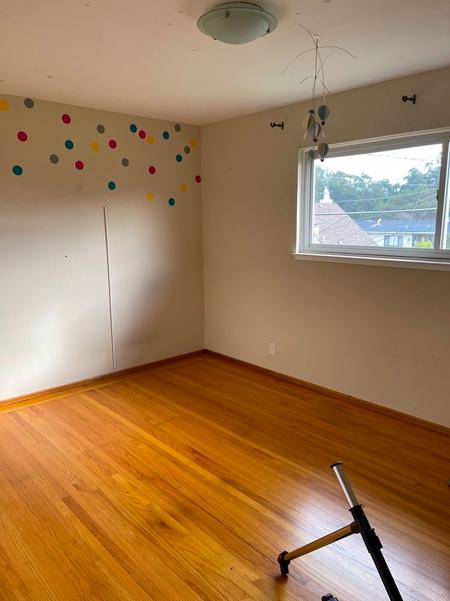
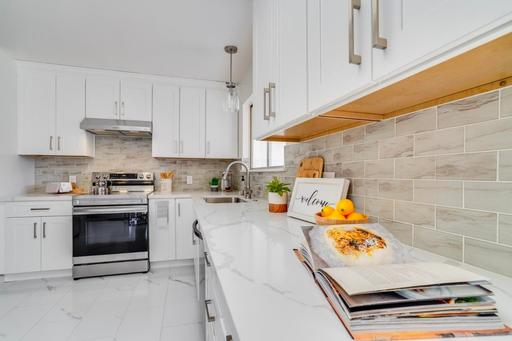
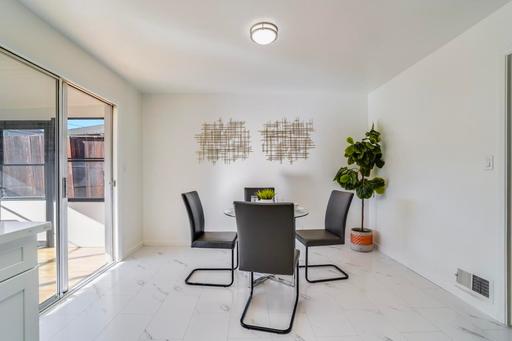
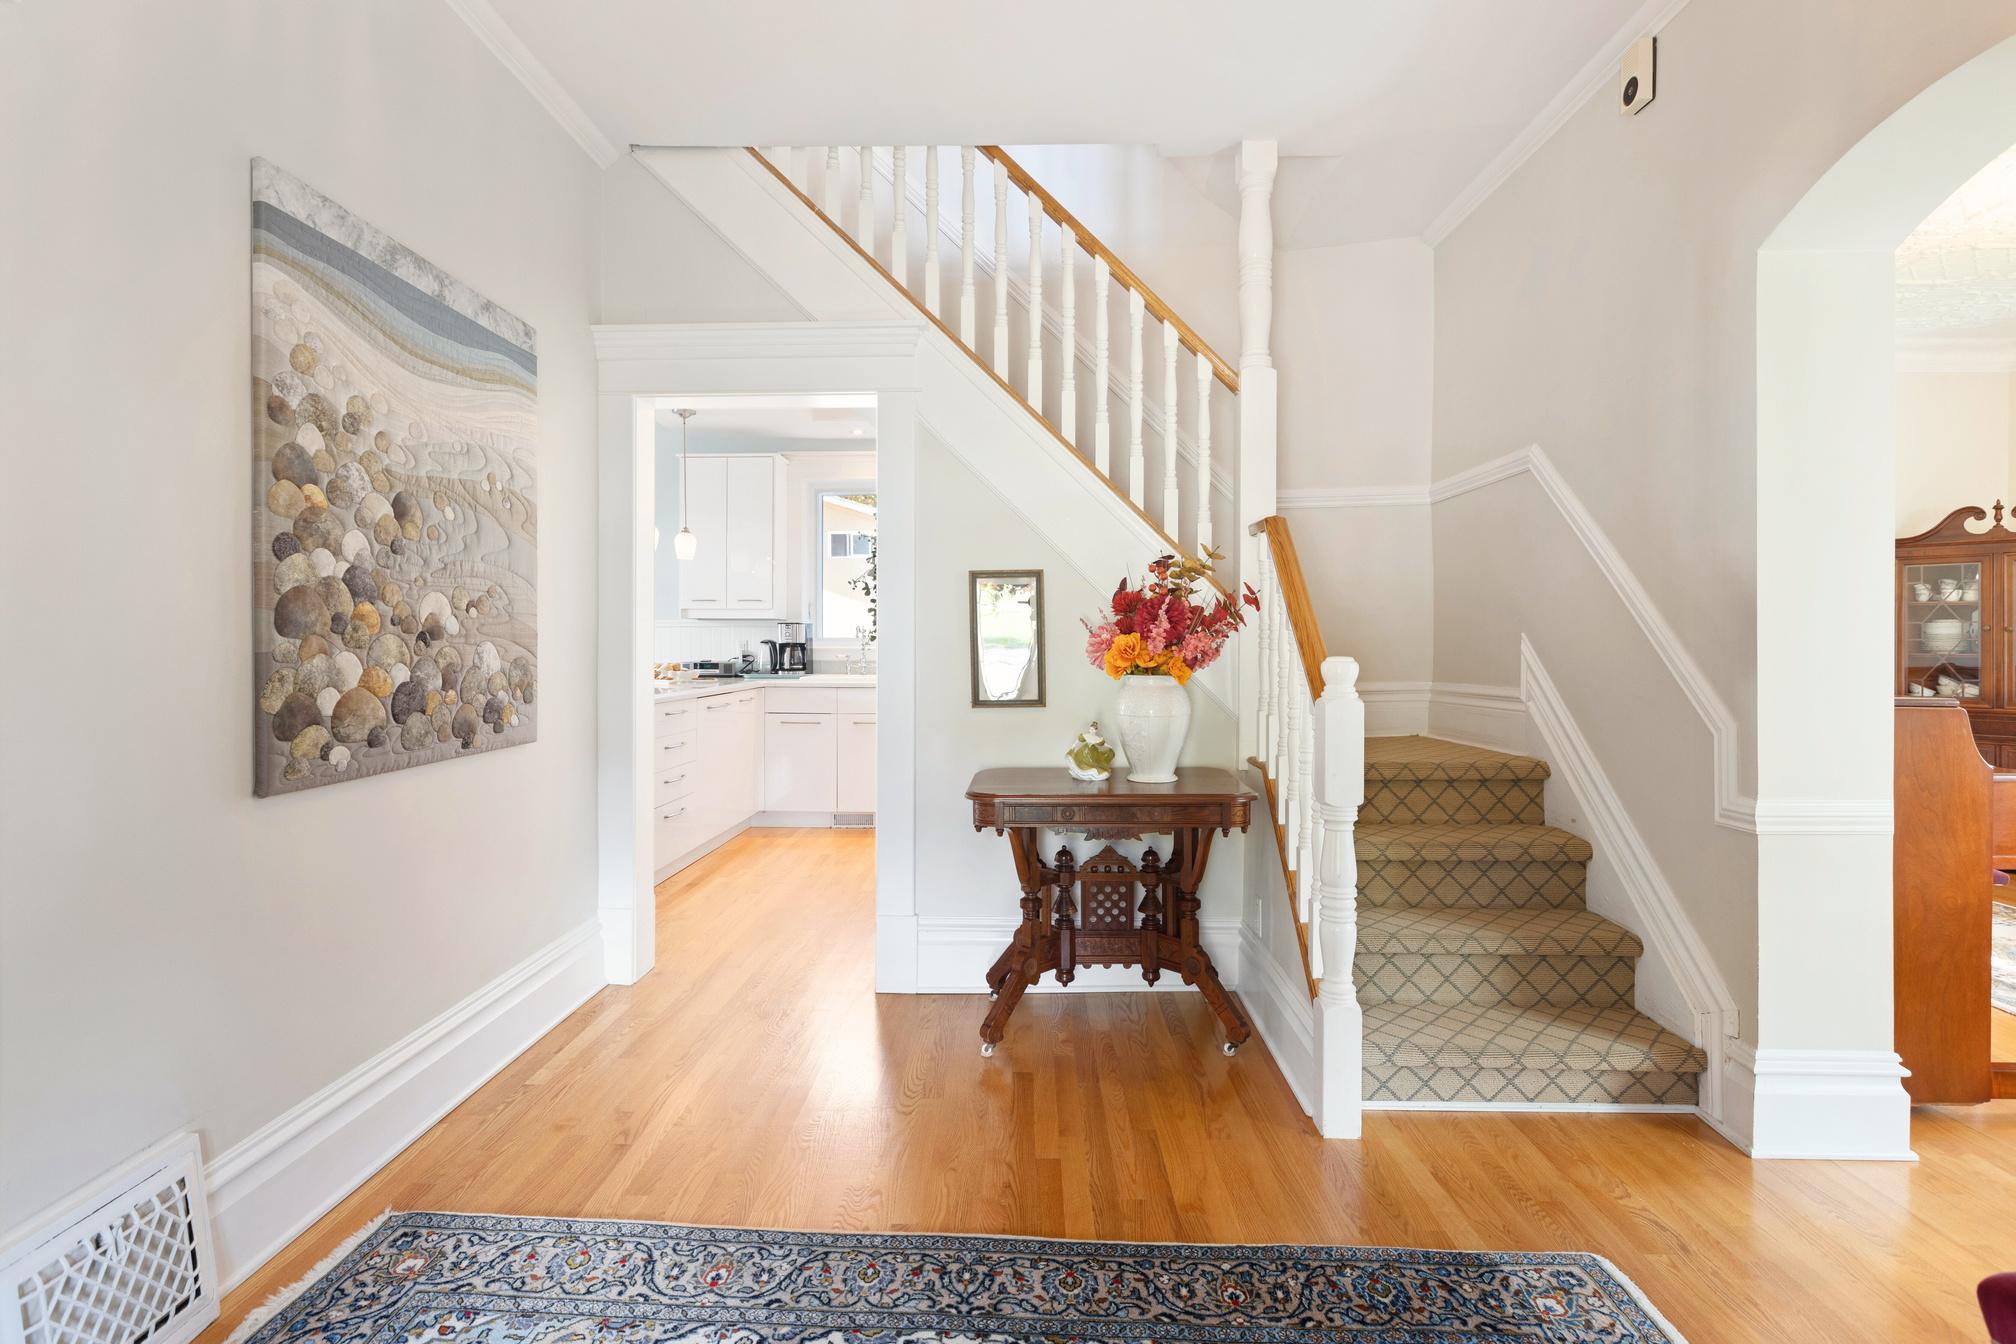
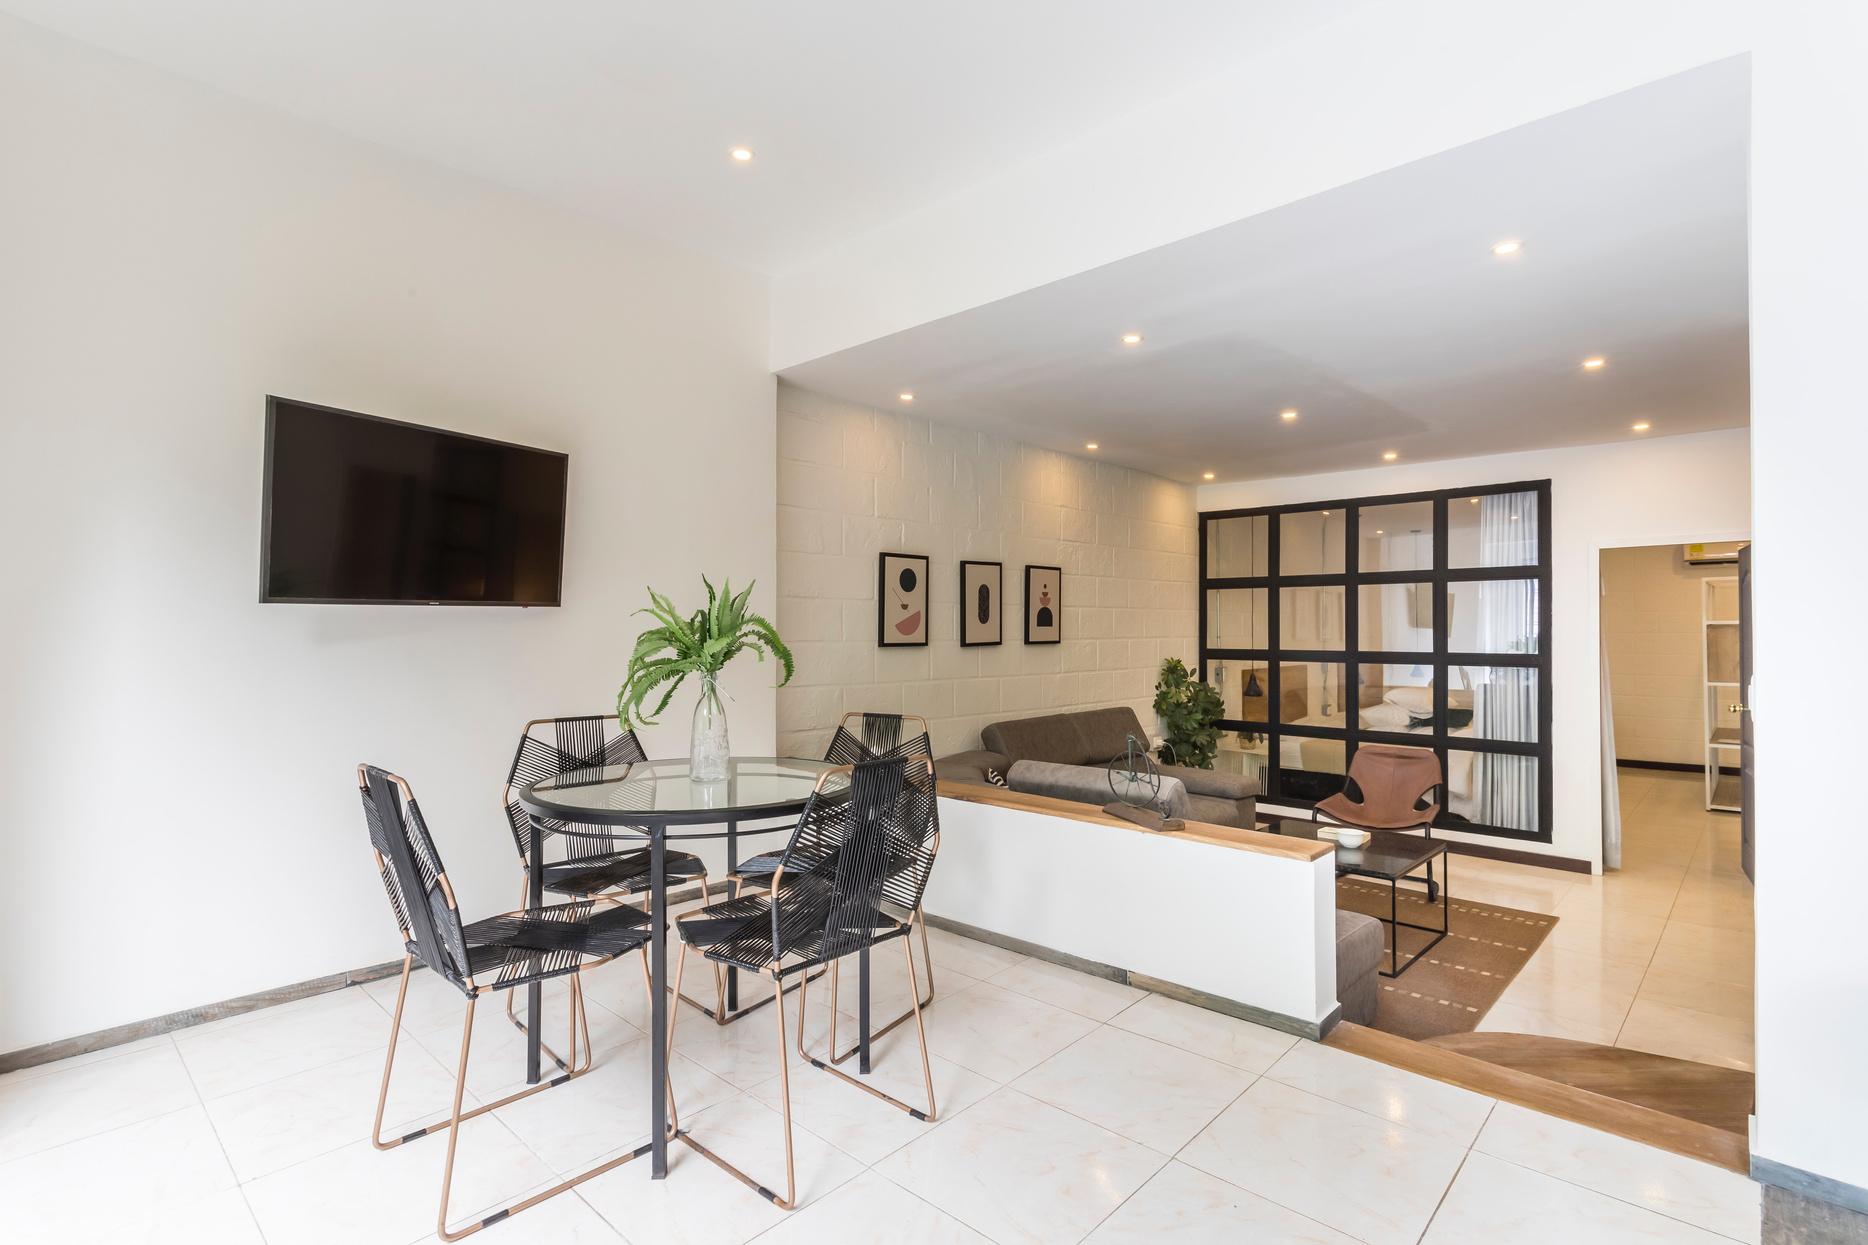
Home Concierge's secret weapon is our local project directors, who visit and personally manage each of our projects. When the agent reached out with a tight deadline, project director Azary Khalfan took it in stride and immediately called on her local vendors and subcontractors. Our in-house designer, Samantha Black, worked quickly over the holidays to design a new kitchen while Azary ordered finishes for other parts of the home. Ingenuity, strong vendor connections, and hard work transformed the kitchen in 17 days! The home sold for over $400,000 over asking in just one week.
BEFORE AFTER
Tips to Harden Your Home During Wildfires
Source: Cal Fire
ROOF
Build your roof or re-roof with materials such as composition, metal, clay, or tile Remove any vegetative debris from the roof.
VENTS
Remove all openings with 1/16-inch to 1/4-inch metal mesh Do not use fiberglass or plastic mesh because they can melt and burn
EAVES + SOFFITS
Eaves should be boxed in and protected with ignition-resistant or non-combustible materials.
WINDOWS
Install dual-paned windows with one pane of tempered glass to reduce the chance of breakage in a fire.
WALLS
Use ignition-resistant materials, such as stucco, fiber cement, wall siding, fire retardant, treated wood, etc.
DECKS
Create an ember-resistant zone around and under all decks and clear debris from under your deck.
FENCES
Separate your fences from your house or upgrade the last 5 feet of the fence to a non-combustible material.
GUTTERS
Keep rain gutters clear or enclose rain gutters to prevent accumulation of plant debris
DRIVEWAY
Driveways should be built and maintained in accordance with state and local codes to allow fire and emergency vehicles to reach
CHIMNEY
Close the fireplace during fire season when the chimney is not being used.
PATIO COVER
Use the same ignitionresistant materials for patio coverings as a roof
DECKS
Have a fire extinguisher and tools such as a shovel, rake, bucket, and hose available for fire
BroughtToYouBy:
San Francisco County
What's in the San Francisco County data?
There were 335 single-family homes for sale providing 2.4 months of inventory. There we new listings, and 139 homes sold at a media price of $1.6m. The median overbid percenta was 107.3%, with an average of 31 days on t market.
There were 590 condo and townhome units sale, providing 4.2 months of inventory. Ther were 278 new listings and 140 units sold at a median sale price of $1.1m. The median ove percentage was 106.5%, with an average of 5 days on the market.
e-Family Homes
0 ngs
4 f Inventory
139 Sold Listings
$1.6M Median Sale Price
7.3% ale vs List
31 Avg Days on Market
urced from MLS Listings Inc, includes all single-family homes, condos and the California Area from August 2022 to August 2023. This may include ata, and may vary from the time the data was gathered. All data is deemed guaranteed. DRE# 01906450. Copyright KW Advisors Peninsula Estates | Burlingame | San Mateo 2023. Each office is independently owned and operated.
278
LISTINGS FOR SALE SOLD LISTINGS
Median SalesPrice
Single-Family Homes
The median sales price has decreased from $1 61m last August 2022, to $1 6m as of August 2023
Condos & Townhomes
The median sales price has increased from $1m last August 2022, to $1.1m as of August 2023.
AVGDays OntheMarket
Single-Family Homes
The average time spent on the market went up from 25 days last August 2022, to 31 days as of August 2023
Condos & Townhomes
The average time spent on the market went up from 50 days in August 2022, to 57 days as of August 2023
Overbids
Single-Family Homes
The overbid percentage has decreased from 108 3% last August 2022, to 107 3% a year later
Condos & Townhomes
The overbid percentage has increased from 101% last August 2022, to 106.5% a year later.
SanMateo County
What's in the San Mateo County data?
There were 507 single-family homes for sale, providing 1.6 months of inventory. There were 452 new listings, and 318 homes sold at a median price of $1.8m. The median overbid percentage was 103 3%, with an average of 28 days on the market.
There were 186 condo and townhome units for sale, providing 2 months of inventory. There were 137 new listings and 94 units sold at a median price of $1m. The median overbid percentage was 100.6%, with an average of 45 days on the market.
SanMateoCounty
AUGUST 2022 - AUGUST 2023
Single-Family Homes
Last 12 months, year-over-year.
Condos & Townhomes
Last 12 months, year-over-year
Median SalesPrice
Single-Family Homes
The median sales price has decreased from $1 83m last August 2022, to $1 8m as of August 2023
Condos & Townhomes
The median sales price has increased from $900k last August 2022, to $1m as of August 2023.
AVGDays OntheMarket
Single-Family Homes
The average time spent on the market went up from 23 days last August 2022, to 28 days as of August 2023
Condos & Townhomes
The average time spent on the market went up from 32 days in August 2022, to 45 days as of August 2023
Overbids
Single-Family Homes
The overbid percentage has increased from 100 8% last August 2022, to 103 3% a year later
Condos & Townhomes
The overbid percentage has decreased from 100.8% last August 2022, to 100.6% a year later.
Belmont
What's in the Belmont data?
There were 7 single-family homes for sale, providing 0.6 months of inventory. There were 11 new listings and 11 homes sold at a median price of $2.1m. The median overbid percentage was 109.2%, with an average of 18 days on the market.
There were 3 condo and townhome units for sale, providing 1.5 months of inventory. There were 4 new listings and 2 units sold at a median price of $1.2m. The median overbid percentage was 107.6%, with an average of 28 days on the market.
11 Sold Listings mes
$2.1M
Median Sale Price
18 Avg Days on Market
includes all single-family homes, condos and August 2022 to August 2023. This may include the data was gathered. All data is deemed Copyright KW Advisors Peninsula Estates | Burlingame | San Mateo 2023. Each office is independently owned and operated.
4
New Listings
2 Sold Listings
1.5
Months of Inventory
$1.2M
Median Sale Price
107.6%
Median Sale vs List
28 Avg Days on Market
LISTINGS FOR SALE SOLD LISTINGS
Median SalesPrice
Single-Family Homes
The median sales price has increased from $2 150m last August 2022, to $2 180m as of August 2023
Condos & Townhomes
The median sales price has increased from $564k last August 2022, to $1.2m as of August 2023.
AVGDays OntheMarket
Single-Family Homes
The average time spent on the market went down from 20 days last August 2022, to 18 days as of August 2023
Condos & Townhomes
The average time spent on the market went up from 25 days in August 2022, to 28 days as of August 2023
Overbids
Single-Family Homes
The overbid percentage has increased from 99 9% last August 2022, to 109 2% a year later
Condos & Townhomes
The overbid percentage has increased from 98.9% last August 2022, to 107.6% a year later.
Burlingame
What's in the Burlingame data?
There were 29 single-family homes for sale, providing 2.2 months of inventory. There were 23 new listings, and 13 homes sold at a median price of $2.8m. The median overbid percentage was 101.6%, with an average of 17 days on the market.
There were 8 condo and townhome units for sale, providing 4 months of inventory. There were 6 new listings and 2 units sold at a median price of $926k. The median overbid percentage was 96.2%, with an average of 15 days on the market.
Single-Family Homes
23 New Listings
13 Sold Listings
2.2 Months of Inventory
$2.8M Median Sale Price
101.6%
Median Sale vs List
17 Avg Days on Market
The data, sourced from MLS Listings Inc, includes all single-family homes, condos and townhomes in the California Area from August 2022 to August 2023. This may include preliminary data, and may vary from the time the data was gathered. All data is deemed reliable but not guaranteed. DRE# 01906450. Copyright KW Advisors Peninsula Estates | Burlingame | San Mateo 2023. Each office is independently owned and operated.
LISTINGS FOR SALE SOLD LISTINGS
Median SalesPrice
Single-Family Homes
The median sales price has decreased from $2 83m last August 2022, to $2 8m as of August 2023
Condos & Townhomes
The median sales price has decreased from $1.3m last August 2022, to $926k as of August 2023.
AVGDays OntheMarket
Single-Family Homes
The average time spent on the market went down from 25 days last August 2022, to 17 days as of August 2023
Condos & Townhomes
The average time spent on the market went up from 3 days in August 2022, to 15 days as of August 2023
Overbids
Single-Family Homes
The overbid percentage has increased from 99 1% last August 2022, to 101 6% a year later
Condos & Townhomes
The overbid percentage has decreased from 104.5% last August 2022, to 96.2%a year later.
Wha There w providi new lis of $1.1 109.2% There w sale, pr were 1 price o was 10 market
Single-Family Homes
44 New Listings
31 Sold Listings
1.6 Months of Inventory
$1.1M Median Sale Price
109.2% Median Sale vs List
15 Avg Days on Market
The data, sourced from MLS Listings Inc, includes all single-family homes, condos and townhomes in the California Area from August 2022 to August 2023. This may include preliminary data, and may vary from the time the data was gathered. All data is deemed reliable but not guaranteed. DRE# 01906450. Copyright KW Advisors Peninsula Estates | Burlingame | San Mateo 2023. Each office is independently owned and operated.
14
City
AUGUST 2022 - AUGUST 2023 s r-over-year.
LISTINGS FOR SALE SOLD LISTINGS
r-over-year
Median SalesPrice
Single-Family Homes
The median sales price has decreased from $1 2m last August 2022, to $1 1m as of August 2023
Condos & Townhomes
The median sales price has decreased from $715k last August 2022, to $690k as of August 2023.
AVGDays OntheMarket
Single-Family Homes
The average time spent on the market went down from 27 days last August 2022, to 15 days as of August 2023
Condos & Townhomes
The average time spent on the market went up from 39 days in August 2022, to 49 days as of August 2023
Overbids
Single-Family Homes
The overbid percentage has increased from 106 1% last August 2022, to 109 2% a year later
Condos & Townhomes
The overbid percentage has increased from 100.4% last August 2022, to 100.6% a year later.
FosterCity
What's in the Foster City data?
There were 4 single-family homes for sale, providing 0.3 months of inventory. There were 6 new listings and 12 homes sold at a median price of $2.5m. The median overbid percentage was 103.6%, with an average of 18 days on the market.
There were 15 condo and townhome units for sale, providing 1.5 months of inventory. There were 16 new listings and 10 units sold at a median price of $1.4m. The median overbid percentage was 103.7%, with an average of 14 days on the market.
Single-Family Homes
6 New Listings
12 Sold Listings
0.3 Months of Inventory
$2.5M Median Sale Price
103.6% Median Sale vs List
18 Avg Days on Market
The data, sourced from MLS Listings Inc, includes all single-family homes, condos and townhomes in the California Area from August 2022 to August 2023. This may include preliminary data, and may vary from the time the data was gathered. All data is deemed reliable but not guaranteed. DRE# 01906450. Copyright KW Advisors Peninsula Estates | Burlingame | San Mateo 2023. Each office is independently owned and operated.
Condo & Townh
New Listings 1.5 Months of Inventory $1.4 Median S
103.7%
Median Sale vs List Avg Days o
sterCity
AUGUST 2022 - AUGUST 2023
LISTINGS FOR SALE SOLD LISTINGS
mily Homes onths, year-over-year.
Townhomes onths, year-over-year
Median SalesPrice
Single-Family Homes
The median sales price has increased from $2m last August 2022, to $2 5m as of August 2023
Condos & Townhomes
The median sales price has increased from $1.2m last August 2022, to $1.4m as of August 2023.
AVGDays OntheMarket
Single-Family Homes
The average time spent on the market has remained at 18 days since last August 2022
Condos & Townhomes
The average time spent on the market went down from 16 days in August 2022, to 14 days as of August 2023
Overbids
Single-Family Homes
The overbid percentage has increased from 98 3% last August 2022, to 103 6% a year later
Condos & Townhomes
The overbid percentage has increased from 103.4% last August 2022, to 103.7% a year later.
Half Bay
What's in th
data?
There were 12 sin providing 12 mon new listings, and $2.9m. The medi with an average o
There were 3 con providing 0 mont new listings and 0 $0. The median o with an average o
0 Listings
1 Sold Listing
2 hs of Inventory
$2.9M Median Sale Price
00% an Sale vs List
0 Avg Days on Market
ta, sourced from MLS Listings Inc, includes all single-family homes, condos and townhomes in the California Area from August 2022 to August 2023. This may include preliminary data, and may vary from the time the data was gathered. All data is deemed but not guaranteed. DRE# 01906450. Copyright KW Advisors Peninsula Estates | Burlingame | San Mateo 2023. Each office is independently owned and operated.
CO Condo &
New Listings
Months of Inventory
Median Sale vs List
MoonBay
AUGUST 2022 - AUGUST 2023
mes year-over-year.
omes year-over-year
Median SalesPrice
Single-Family Homes
The median sales price has increased from $2 2m last August 2022, to $2 9m as of August 2023
Condos & Townhomes
The median sales price has decreased from $809k last August 2022, to $0 as of August 2023.
AVGDays OntheMarket
Single-Family Homes
The average time spent on the market went down from 26 days last August 2022, to 0 days as of August 2023
Condos & Townhomes
The average time spent on the market went down from 18 days in August 2022, to 0 days as of August 2023
Overbids
Single-Family Homes
The overbid percentage has increased from 97 5% last August 2022, to 100% a year later
Condos & Townhomes
The overbid percentage has decreased from 102.3% last August 2022, to 0% a year later.
Homes
9 Sold Listings
$6.5M
Median Sale Price
28 Avg Days on Market
Listings Inc, includes all single-family homes, condos and from August 2022 to August 2023. This may include the time the data was gathered. All data is deemed 01906450. Copyright KW Advisors Peninsula Estates | Burlingame | San Mateo 2023. Each office is independently owned and operated.
Hillsborough
AUGUST 2022 - AUGUST 2023
LISTINGS FOR SALE SOLD LISTINGS
Single-Family Homes
Last 12 months, year-over-year.
No data for this month.
Condos & Townhomes
Last 12 months, year-over-year
Median SalesPrice
Single-Family Homes
The median sales price has increased from $6m last August 2022, to $6 5m as of August 2023
Condos & Townhomes
No data for this month.
AVGDays OntheMarket
Single-Family Homes
The average time spent on the market went up from 22 days last August 2022, to 28 days as of August 2023
Condos & Townhomes
No data for this month
Overbids
Single-Family Homes
The overbid percentage has decreased from 101 8% last August 2022, to 96 8% a year later
Condos & Townhomes
No data for this month.
Millb
What's in the
There were 9 single-f providing 1.3 months new listings and 7 ho of $1.9m. The media 103%, with an averag
There were 3 condo a providing 1 month of listings and 3 units s $1.1m. The median o 102.6%, with an avera
Listings s
1.9M n Sale Price
9 ays on Market
single-family homes, condos and August 2023. This may include was gathered. All data is deemed KW Advisors Peninsula Estates | Burlingame | San Mateo 2023. Each office is independently owned and operated.
4 New Listings
3 Sold Listings
1 Months of Inventory
$1.1M Median Sale Price 102.6% Median Sale vs List
4 Avg Days on Market
Millbrae
AUGUST 2022 - AUGUST 2023
Single-Family Homes
Last 12 months, year-over-year.
Condos & Townhomes
Last 12 months, year-over-year
Median SalesPrice
Single-Family Homes
The median sales price has decreased from $2m last August 2022, to $1 9m as of August 2023
Condos & Townhomes
The median sales price has increased from $850k last August 2022, to $1.1m as of August 2023.
AVGDays OntheMarket
Single-Family Homes
The average time spent on the market went down from 22 days last August 2022, to 19 days as of August 2023
Condos & Townhomes
The average time spent on the market went down from 23 days in August 2022, to 4 days as of August 2023
Overbids
Single-Family Homes
The overbid percentage has increased from 101 4% last August 2022, to 103% a year later
Condos & Townhomes
The overbid percentage has increased from 99.6% last August 2022, to 102.6% a year later.
Pacifica
What's in the Pacifica data?
There were 24 single-family homes for sale, providing 1 month of inventory. There were 24 new listings and 25 homes sold at a median p of $1.4m. The median overbid percentage wa 106.3%, with an average of 37 days on the ma
There were 8 condo and townhome units for s providing 4 months of inventory. There were 7 new listings and 2 units sold at a median price $778k. The median overbid percentage was 104.6%, with an average of 5 days on the mark
tings of Inventory
Homes
25 Sold Listings
$1.4M Median Sale Price
6.3% Sale vs List
37 Avg Days on Market
urced from MLS Listings Inc, includes all single-family homes, condos and in the California Area from August 2022 to August 2023. This may include ata, and may vary from the time the data was gathered. All data is deemed not guaranteed. DRE# 01906450. Copyright KW Advisors Peninsula Estates | Burlingame | San Mateo 2023. Each office is independently owned and operated.
AUGUST 2022 - AUGUST 2023
Single-Family Homes
Last 12 months, year-over-year.
Condos & Townhomes
Last 12 months, year-over-year
Median SalesPrice
Single-Family Homes
The median sales price has increased from $1 2m last August 2022, to $1 4m as of August 2023
Condos & Townhomes
The median sales price has decreased from $845k last August 2022, to $778k as of August 2023.
AVGDays OntheMarket
Single-Family Homes
The average time spent on the market went up from 19 days last August 2022, to 37 days as of August 2023
Condos & Townhomes
The average time spent on the market went down from 50 days in August 2022, to 5 days as of August 2023
Overbids
Single-Family Homes
The overbid percentage has increased from 102% last August 2022, to 106 3% a year later
Condos & Townhomes
The overbid percentage has increased from 98% last August 2022, to 104.6% a year later.
SanBru
What's in the San B
There were 15 single-family ho providing 0.8 months of inven new listings and 20 homes so of $1.5m. The median overbid 104.9%, with an average of 13
There were 15 condo and tow sale, providing 3.8 months of i were 11 new listings and 4 un price of $527k. The median ov was 101%, with an average of market.
Mrice s homes, condos and 2023. This may include All data is deemed Peninsula Estates | Burlingame | San Mateo 2023. Each office is independently owned and operated.
Market
Listings
3.8
SanBruno
AUGUST 2022 - AUGUST 2023
Single-Family Homes
Last 12 months, year-over-year.
Condos & Townhomes
Last 12 months, year-over-year
Median SalesPrice
Single-Family Homes
The median sales price has increased from $1 4m last August 2022, to $1 5m as of August 2023
Condos & Townhomes
The median sales price has increased from $475k last August 2022, to $527k as of August 2023.
AVGDays OntheMarket
Single-Family Homes
The average time spent on the market went down from 26 days last August 2022, to 13 days as of August 2023
Condos & Townhomes
The average time spent on the market went up from 18 days in August 2022, to 23 days as of August 2023
Overbids
Single-Family Homes
The overbid percentage has increased from 101 3% last August 2022, to 104 9% a year later
Condos & Townhomes
The overbid percentage has decreased from 101.6% last August 2022, to 101% a year later.
SanCarlos
What's in the San Carlos data?
There were 33 single-family homes for sale, providing 1.9 months of inventory. There were 41 new listings and 17 homes sold at a median price of $2.4m. The median overbid percentage was 104.7%, with an average of 26 days on the market.
There were 13 condo and townhome units for sale, providing 1.4 months of inventory. There were 11 new listings and 9 units sold at a median price of $1.2m. The median overbid percentage was 100.5%, with an average of 33 days on the market.
Single-Family Homes
41 New Listings
17 Sold Listings
1.9 Months of Inventory
$2.4M Median Sale Price
104.7%
Median Sale vs List
26 Avg Days on Market
The data, sourced from MLS Listings Inc, includes all single-family homes, condos and townhomes in the California Area from August 2022 to August 2023. This may include preliminary data, and may vary from the time the data was gathered. All data is deemed reliable but not guaranteed. DRE# 01906450. Copyright KW Advisors Peninsula Estates | Burlingame | San Mateo 2023. Each office is independently owned and operated.
11 New Listings
1.4 Months of Inventory
Listings
SanCarlos
AUGUST 2022 - AUGUST 2023
Single-Family Homes
Last 12 months, year-over-year.
Condos & Townhomes
Last 12 months, year-over-year
Median SalesPrice
Single-Family Homes
The median sales price has increased from $2 1m last August 2022, to $2 4m as of August 2023
Condos & Townhomes
The median sales price has increased from $940k last August 2022, to $1.2m as of August 2023.
AVGDays OntheMarket
Single-Family Homes
The average time spent on the market went up from 23 days last August 2022, to 26 days as of August 2023
Condos & Townhomes
The average time spent on the market went up from 17 days in August 2022, to 33 days as of August 2023
Overbids
Single-Family Homes
The overbid percentage has increased from 102% last August 2022, to 104 7% a year later
Condos & Townhomes
The overbid percentage has increased from 98.3% last August 2022, to 100.5% a year later.
SanMa
What's in the San M
There were 54 single-family ho providing 1.1 months of inven new listings, and 47 homes so of $1.8m. The median overbid 105%, with an average of 172
There were 52 condo and tow sale, providing 1.5 months of i were 28 new listings and 34 un price of $951k. The median ov was 99.1%, with an average of market.
omes
47 Sold Listings
$1.8M
Median Sale Price
17
Avg Days on Market
includes all single-family homes, condos and August 2022 to August 2023. This may include time the data was gathered. All data is deemed 01906450. Copyright KW Advisors Peninsula Estates | Burlingame | San Mateo 2023. Each office is independently owned and operated.
28 New Listings
1.5
Months of Inventory
99.1%
Median Sale vs List
AUGUST 2022 - AUGUST 2023
Median SalesPrice
Single-Family Homes
The median sales price has decreased from $1 9m last August 2022, to $1 8m as of August 2023
Condos & Townhomes
The median sales price has increased from $765k last August 2022, to $951k as of August 2023.
AVGDays OntheMarket
Single-Family Homes
The average time spent on the market went down from 18 days last August 2022, to 17 days as of August 2023
Condos & Townhomes
The average time spent on the market went up from 56 days in August 2022, to 71 days as of August 2023
Overbids
Single-Family Homes
The overbid percentage has increased from 100% last August 2022, to 105% a year later
Condos & Townhomes
The overbid percentage has decreased from 100.4% last August 2022, to 99.1% a year later.
SouthSan Francisco
What's in the South San Francisco data?
There were 19 single-family homes for sale, providing 0.8 months of inventory. There were 29 new listings and 23 homes sold at a median price of $1.2m. The median overbid percentage was 106 2%, with an average of 19 days on the market
There were 8 condo and townhome units for sale, providing 4 months of inventory. There were 5 new listings and 2 units sold at a median price of $730k. The median overbid percentage was 99.1%, with an average of 16 days on the market.
Single-Family Homes
29 New Listings
23 Sold Listings
0.8 Months of Inventory
$1.2M Median Sale Price
106.2% Median Sale vs List
19 Avg Days on Market
The data, sourced from MLS Listings Inc, includes all single-family homes, condos and townhomes in the California Area from August 2022 to August 2023. This may include preliminary data, and may vary from the time the data was gathered. All data is deemed reliable but not guaranteed. DRE# 01906450. Copyright KW Advisors Peninsula Estates | Burlingame | San Mateo 2023. Each office is independently owned and operated.
Median SalesPrice
Single-Family Homes
The median sales price has decreased from $1 3m last August 2022, to $1 2m as of August 2023
Condos & Townhomes
The median sales price has decreased from $740k last August 2022, to $730k as of August 2023.
AVGDays OntheMarket
Single-Family Homes
The average time spent on the market went down from 25 days last August 2022, to 19 days as of August 2023
Condos & Townhomes
The average time spent on the market went down from 26 days in August 2022, to 16 days as of August 2023
Overbids
Single-Family Homes
The overbid percentage has increased from 101 9% last August 2022, to 106 2% a year later
Condos & Townhomes
The overbid percentage has decreased from 99.5% last August 2022, to 99.1% a year later.