

San Francisco County
Jump to San Francisco County Report
San Mateo County
Jump to San Mateo County Report
Santa Clara County
Jump to Sant Clara County Report
Jump to Atherton Report
Jump to Brisbane Report
Jump to Belmont Report
Jump to Colma Report
Jump to Burlingame Report
City
Jump to Daly City Report
Palo Alto
Jump to East Palo Alto Report
City
Jump to Foster City Report
Jump to Half Moon Bay Report Half Moon Bay
Hillsborough
Jump to Hillsborough Report
Menlo Park
Jump to Menlo Park Report
Millbrae
Jump to Millbrae Report
Pacifica
Jump to Pacifica Report
Portola Valley
Jump to Portola Valley Report
Redwood City
Jump to Redwood City Report
San Bruno
Jump to San Bruno Report
San Carlos
Jump to San Carlos Report
San Mateo
Jump to San Mateo Report
South San Francisco
Jump to South San Francisco Report
Jump to Woodside Report
That's the question you should be asking yourself.
Our market is incredibly diverse and rapidly changing. Values vary not just by neighborhood but by street. Your home isn't necessarily worth what your neighbors' home is. It's the current market that sets the value of your home.
So, do you know what your home is worth in today's market?
Icanhelp...
Contact me for a confidential, no obligation assessment of your home's value.

If your house is on the market but you haven’t gotten any offers you’re comfortable with, you may be wondering: what do I do if it doesn’t sell? And for a growing number of homeowners, that’s turning into a new dilemma: should I just rent it instead?
There’s a term for this in the industry, and it’s called an accidental landlord. Here’s how Yahoo Finance defines it:

There were 0 single-family homes for sale, providing 0 months of inventory. There were 0 new listings, and 0 homes sold at a median price of $0. The median overbid percentage was at 0%, with an average of 0 days on the market.
There were 0 condo and townhome units for sale, providing 0 months of inventory There were 0 new listings and 0 units sold at a median sale price of $0. The median overbid percentage was at 0%, with an average of 0 days on the market.

0
New Listings
0 Sold Listings
0 Months of Inventory
$0 Median Sale Price
0%
Median Sale vs List
0 Avg Days on Market
The data, sourced from MLS Listings Inc., and Courted.io, includes all single-family homes, condos, and townhomes in the California Area above from August 2024 to August 2025. This may include preliminary data and may vary from the time the data was gathered. All data is deemed reliable but not guaranteed. DRE# 01906450. Copyright KW Advisors Peninsula Estates | Burlingame | San Mateo 2025. Each office is independently owned and operated.
New Listings
Sold Listings
Months of Inventory
Median Sale Price 0%
Median Sale vs List
Avg Days on Market

AUGUST 2024 - AUGUST 2025
Nodatatodispla�
Single-Family Homes
Last 12 months, year-over-year.
Condos & Townhomes
Nodatatodispla�
Last 12 months, year-over-year
The median sale price has increased from $0 last August 2024, to $0 as of August 2025
The median sale price has increased from $0 last August 2024, to $0 as of August 2025
No data to display
No data to display
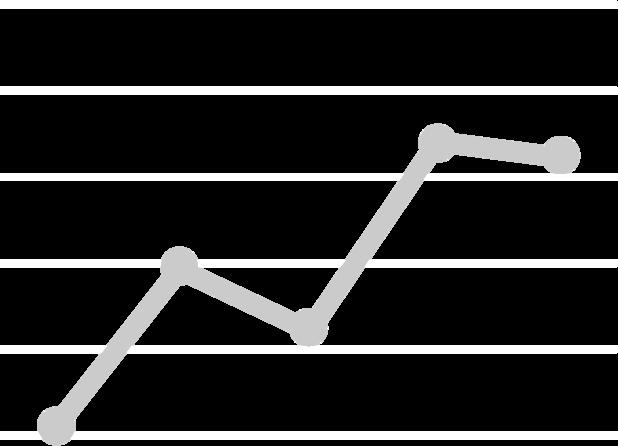
The average time spent on the market went up from 0 days in August 2024, to 0 days as of August 2025
The average time spent on the market went up from 0 days in August 2024, to 0 days as of August 2025.
Single-Family Homes
The overbid percentage has increased from 0% last August 2024, to 0% a year later
Condos & Townhomes
The overbid percentage has increased from 0% last August 2024, to 0% a year later.
No data to display

There were 0 single-family homes for sale, providing 0 months of inventory. There were new listings, and 0 homes sold at a median p of $0. The median overbid percentage was a with an average of 0 days on the market
There were 0 condo and townhome units for providing 0 months of inventory. There were new listings and 0 units sold at a median sal price of $0. The median overbid percentage at 0%, with an average of 0 days on the mark

HHomes ngs f Inventory
0 Sold Listings
$0 Median Sale Price ale vs List
0 Avg Days on Market
sourced from MLS Listings Inc., and Courted.io, includes all single-family condos, and townhomes in the California Area above from August 2024 to This may include preliminary data and may vary from the time the data was data is deemed reliable but not guaranteed. DRE# 01906450. Copyright KW Peninsula Estates | Burlingame | San Mateo 2025. Each office is independently owned and operated.

AUGUST 2024 - AUGUST 2025
Nodatatodispla�
amily Homes
months, year-over-year. & Townhomes
Nodatatodispla�
months, year-over-year
The median sale price has increased from $0 last August 2024, to $0 as of August 2025
The median sale price has increased from $0 last August 2024, to $0 as of August 2025
No data to display
No data to display
The average time spent on the market went up from 0 days in August 2024, to 0 days as of August 2025
The average time spent on the market went up from 0 days in August 2024, to 0 days as of August 2025.
Single-Family Homes
The overbid percentage has increased from 0% last August 2024, to 0% a year later
Condos & Townhomes
The overbid percentage has increased from 0% last August 2024, to 0% a year later.
No data to display

There were 0 singleproviding 0 months new listings, and 0 h of $0. The median o with an average of 0
There were 0 condo providing 0 months new listings and 0 u price of $0. The med at 0%, with an avera
0 d Listings
$0 dian Sale Price
0 g Days on Market
Courted.io, includes all single-family California Area above from August 2024 to may vary from the time the data was guaranteed. DRE# 01906450. Copyright KW Mateo 2025. Each office is independently

, y y
displa�
displa�
The median sale price has increased from $0 last August 2024, to $0 as of August 2025
The median sale price has increased from $0 last August 2024, to $0 as of August 2025
No data to display
No data to display
The average time spent on the market went up from 0 days in August 2024, to 0 days as of August 2025
The average time spent on the market went up from 0 days in August 2024, to 0 days as of August 2025.
Single-Family Homes
The overbid percentage has increased from 0% last August 2024, to 0% a year later
Condos & Townhomes
The overbid percentage has increased from 0% last August 2024, to 0% a year later.
No data to display

There were 0 single-f providing 0 months o new listings, and 0 ho of $0. The median ov with an average of 0
There were 0 condo a providing 0 months o new listings and 0 un price of $0. The med at 0%, with an averag

n Sale Price
ays on Market
Courted.io, includes all single-family Area above from August 2024 to may vary from the time the data was guaranteed. DRE# 01906450. Copyright KW 2025. Each office is independently
New Listings
Sold Listings
Months of Inventory
Median Sale Price 0%
Median Sale vs List
Avg Days on Market

AUGUST 2024 - AUGUST 2025
Nodatatodispla�
Single-Family Homes
Last 12 months, year-over-year.
Condos & Townhomes
Nodatatodispla�
Last 12 months, year-over-year
The median sale price has increased from $0 last August 2024, to $0 as of August 2025
The median sale price has increased from $0 last August 2024, to $0 as of August 2025
No data to display
No data to display
The average time spent on the market went up from 0 days in August 2024, to 0 days as of August 2025
The average time spent on the market went up from 0 days in August 2024, to 0 days as of August 2025.
Single-Family Homes
The overbid percentage has increased from 0% last August 2024, to 0% a year later
Condos & Townhomes
The overbid percentage has increased from 0% last August 2024, to 0% a year later.
No data to display
Listings hs of Inventory
% an Sale vs List
0 Sold Listings
$0 Median Sale Price
0 Avg Days on Market
data, sourced from MLS Listings Inc., and Courted.io, includes all single-family condos, and townhomes in the California Area above from August 2024 to 2025. This may include preliminary data and may vary from the time the data was gathered. All data is deemed reliable but not guaranteed. DRE# 01906450. Copyright KW Peninsula Estates | Burlingame | San Mateo 2025. Each office is independently owned and operated.
The median sale price has increased from $0 last August 2024, to $0 as of August 2025
The median sale price has increased from $0 last August 2024, to $0 as of August 2025
No data to display
No data to display
The average time spent on the market went up from 0 days in August 2024, to 0 days as of August 2025
The average time spent on the market went up from 0 days in August 2024, to 0 days as of August 2025.
Single-Family Homes
The overbid percentage has increased from 0% last August 2024, to 0% a year later
Condos & Townhomes
The overbid percentage has increased from 0% last August 2024, to 0% a year later.
No data to display
There were 0 single-family homes for sale, providing 0 months of inventory. There were 0 new listings, and 0 homes sold at a median price of $0. The median overbid percentage was at 0%, with an average of 0 days on the market.
There were 0 condo and townhome units for sale, providing 0 months of inventory. There were 0 new listings and 0 units sold at a median sale price of $0. The median overbid percentage was at 0%, with an average of 0 days on the market

0
New Listings
0 Sold Listings
0 Months of Inventory
$0 Median Sale Price
0%
Median Sale vs List
0 Avg Days on Market
The data, sourced from MLS Listings Inc., and Courted.io, includes all single-family homes, condos, and townhomes in the California Area above from August 2024 to August 2025. This may include preliminary data and may vary from the time the data was gathered. All data is deemed reliable but not guaranteed. DRE# 01906450. Copyright KW Advisors Peninsula Estates | Burlingame | San Mateo 2025. Each office is independently owned and operated.
New Listings
Sold Listings
Months of Inventory
Median Sale Price
Median Sale vs List
Avg Days on Market

AUGUST 2024 - AUGUST 2025
Nodatatodispla�
Single-Family Homes
Last 12 months, year-over-year.
Condos & Townhomes
Nodatatodispla�
Last 12 months, year-over-year
The median sale price has increased from $0 last August 2024, to $0 as of August 2025
The median sale price has increased from $0 last August 2024, to $0 as of August 2025
No data to display
No data to display
The average time spent on the market went up from 0 days in August 2024, to 0 days as of August 2025
The average time spent on the market went up from 0 days in August 2024, to 0 days as of August 2025.
Single-Family Homes
The overbid percentage has increased from 0% last August 2024, to 0% a year later
Condos & Townhomes
The overbid percentage has increased from 0% last August 2024, to 0% a year later.
No data to display

There were 0 single-family homes for sale, providing 0 months of inventory. There were 0 new listings, and 0 homes sold at a median price of $0. The median overbid percentage was at 0%, with an average of 0 days on the market.
There were 0 condo and townhome units for sale, providing 0 months of inventory. There were 0 new listings and 0 units sold at a median sale price of $0. The median overbid percentage was at 0%, with an average of 0 days on the market.

0
New Listings
0 Sold Listings
0 Months of Inventory
$0 Median Sale Price
0%
Median Sale vs List
0
Avg Days on Market
The data, sourced from MLS Listings Inc., and Courted.io, includes all single-family homes, condos, and townhomes in the California Area above from August 2024 to August 2025. This may include preliminary data and may vary from the time the data was gathered. All data is deemed reliable but not guaranteed. DRE# 01906450. Copyright KW Advisors Peninsula Estates | Burlingame | San Mateo 2025. Each office is independently owned and operated.
New Listings
Sold Listings
Months of Inventory
Median Sale Price 0%
Median Sale vs List
Avg Days on Market

AUGUST 2024 - AUGUST 2025
Nodatatodispla�
Single-Family Homes
Last 12 months, year-over-year.
Condos & Townhomes
Nodatatodispla�
Last 12 months, year-over-year
The median sale price has increased from $0 last August 2024, to $0 as of August 2025
The median sale price has increased from $0 last August 2024, to $0 as of August 2025
No data to display
No data to display
The average time spent on the market went up from 0 days in August 2024, to 0 days as of August 2025
The average time spent on the market went up from 0 days in August 2024, to 0 days as of August 2025.
Single-Family Homes
The overbid percentage has increased from 0% last August 2024, to 0% a year later
Condos & Townhomes
The overbid percentage has increased from 0% last August 2024, to 0% a year later.
No data to display

There were 0 single-fa providing 0 months of new listings, and 0 ho of $0. The median ove with an average of 0 d
There were 0 condo a providing 0 months of new listings and 0 uni price of $0. The media at 0%, with an average

Courted.io, includes all single-family Area above from August 2024 to may vary from the time the data was guaranteed. DRE# 01906450. Copyright KW 2025. Each office is independently
New Listings
Sold Listings
Months of Inventory
Median Sale Price
Median Sale vs List
Avg Days on Market

AUGUST 2024 - AUGUST 2025
Nodatatodispla�
Single-Family Homes
Last 12 months, year-over-year.
Nodatatodispla�
Condos & Townhomes
Last 12 months, year-over-year
The median sale price has increased from $0 last August 2024, to $0 as of August 2025
The median sale price has increased from $0 last August 2024, to $0 as of August 2025
No data to display
No data to display
The average time spent on the market went up from 0 days in August 2024, to 0 days as of August 2025
The average time spent on the market went up from 0 days in August 2024, to 0 days as of August 2025.
Single-Family Homes
The overbid percentage has increased from 0% last August 2024, to 0% a year later
Condos & Townhomes
The overbid percentage has increased from 0% last August 2024, to 0% a year later.
No data to display

There were 0 single-fa providing 0 months of new listings, and 0 ho of $0 The median ove with an average of 0 d
There were 0 condo a providing 0 months of new listings and 0 uni price of $0. The media at 0%, with an average
Courted.io, includes all single-family Area above from August 2024 to may vary from the time the data was guaranteed. DRE# 01906450. Copyright KW 2025. Each office is independently
New Listings
Sold Listings
Months of Inventory
Median Sale Price
Median Sale vs List
Avg Days on Market
AUGUST 2024 - AUGUST 2025
Nodatatodispla�
Single-Family Homes
Last 12 months, year-over-year.
Condos & Townhomes
Nodatatodispla�
Last 12 months, year-over-year
The median sale price has increased from $0 last August 2024, to $0 as of August 2025
The median sale price has increased from $0 last August 2024, to $0 as of August 2025
No data to display
No data to display
The average time spent on the market went up from 0 days in August 2024, to 0 days as of August 2025
The average time spent on the market went up from 0 days in August 2024, to 0 days as of August 2025.
Single-Family Homes
The overbid percentage has increased from 0% last August 2024, to 0% a year later
Condos & Townhomes
The overbid percentage has increased from 0% last August 2024, to 0% a year later.
No data to display
There were 0 single-fa providing 0 months of new listings, and 0 ho of $0. The median ove with an average of 0 d
There were 0 condo a providing 0 months of new listings and 0 uni price of $0. The media at 0%, with an average
an Sale Price Listings
Days on Market
Courted.io, includes all single-family Area above from August 2024 to may vary from the time the data was guaranteed. DRE# 01906450. Copyright KW 2025. Each office is independently
New Listings
Months of Inventory Me 0%
Median Sale vs List Avg D
The median sale price has increased from $0 last August 2024, to $0 as of August 2025
The median sale price has increased from $0 last August 2024, to $0 as of August 2025
No data to display
No data to display
The average time spent on the market went up from 0 days in August 2024, to 0 days as of August 2025
The average time spent on the market went up from 0 days in August 2024, to 0 days as of August 2025.
Single-Family Homes
The overbid percentage has increased from 0% last August 2024, to 0% a year later
Condos & Townhomes
The overbid percentage has increased from 0% last August 2024, to 0% a year later.
No data to display

There we providing new listin of $0. Th with an a
There we providing new listin price of $ at 0%, wit

single-family August 2024 to the data was Copyright KW independently et
New Listings
Sold Listings
Months of Inventory
Median Sale Price
Median Sale vs List
Avg Days on Market
AUGUST 2024 - AUGUST 2025
Nodatatodispla�
Single-Family Homes
Last 12 months, year-over-year.
Condos & Townhomes
Nodatatodispla�
Last 12 months, year-over-year
The median sale price has increased from $0 last August 2024, to $0 as of August 2025
The median sale price has increased from $0 last August 2024, to $0 as of August 2025
No data to display
No data to display
The average time spent on the market went up from 0 days in August 2024, to 0 days as of August 2025
The average time spent on the market went up from 0 days in August 2024, to 0 days as of August 2025.
Single-Family Homes
The overbid percentage has increased from 0% last August 2024, to 0% a year later
Condos & Townhomes
The overbid percentage has increased from 0% last August 2024, to 0% a year later.
No data to display

There were 0 single-family homes for sale, providing 0 months of inventory. There were 0 new listings, and 0 homes sold at a median price of $0. The median overbid percentage was at 0%, with an average of 0 days on the market.
There were 0 condo and townhome units for sale, providing 0 months of inventory. There were 0 new listings and 0 units sold at a median sale price of $0. The median overbid percentage was at 0%, with an average of 0 days on the market.

0
New Listings
0 Sold Listings
0 Months of Inventory
$0 Median Sale Price
0%
Median Sale vs List
0 Avg Days on Market
The data, sourced from MLS Listings Inc., and Courted.io, includes all single-family homes, condos, and townhomes in the California Area above from August 2024 to August 2025. This may include preliminary data and may vary from the time the data was gathered. All data is deemed reliable but not guaranteed. DRE# 01906450. Copyright KW Advisors Peninsula Estates | Burlingame | San Mateo 2025. Each office is independently owned and operated.
New Listings
Sold Listings
Months of Inventory
Median Sale Price
Median Sale vs List
Days on Market

AUGUST 2024 - AUGUST 2025
Single-Family Homes
Last 12 months, year-over-year.
Condos & Townhomes
Last 12 months, year-over-year
The median sale price has increased from $0 last August 2024, to $0 as of August 2025
The median sale price has increased from $0 last August 2024, to $0 as of August 2025
No data to display
No data to display
The average time spent on the market went up from 0 days in August 2024, to 0 days as of August 2025
The average time spent on the market went up from 0 days in August 2024, to 0 days as of August 2025.
Single-Family Homes
The overbid percentage has increased from 0% last August 2024, to 0% a year later
Condos & Townhomes
The overbid percentage has increased from 0% last August 2024, to 0% a year later.
No data to display

There were 0 single-family homes for sale, providing 0 months of inventory. There were 0 new listings, and 0 homes sold at a median price of $0. The median overbid percentage was at 0% with an average of 0 days on the market.
There were 0 condo and townhome units for sale providing 0 months of inventory. There were 0 new listings and 0 units sold at a median sale price of $0. The median overbid percentage was at 0%, with an average of 0 days on the market
, y y
displa� displa�
The median sale price has increased from $0 last August 2024, to $0 as of August 2025
The median sale price has increased from $0 last August 2024, to $0 as of August 2025
No data to display
No data to display
The average time spent on the market went up from 0 days in August 2024, to 0 days as of August 2025
The average time spent on the market went up from 0 days in August 2024, to 0 days as of August 2025.
Single-Family Homes
The overbid percentage has increased from 0% last August 2024, to 0% a year later
Condos & Townhomes
The overbid percentage has increased from 0% last August 2024, to 0% a year later.
No data to display

There were 0 single-family homes fo providing 0 months of inventory. The new listings, and 0 homes sold at a m of $0. The median overbid percentag with an average of 0 days on the ma
There were 0 condo and townhome u providing 0 months of inventory. The new listings and 0 units sold at a me price of $0. The median overbid perc at 0%, with an average of 0 days on t

s on Market
Courted.io, includes all single-family above from August 2024 to vary from the time the data was DRE# 01906450. Copyright KW 2025. Each office is independently

AUGUST 2024 - AUGUST 2025
Nodatatodispla�
mes ear-over-year.
Nodatatodispla�
omes , year-over-year
The median sale price has increased from $0 last August 2024, to $0 as of August 2025
The median sale price has increased from $0 last August 2024, to $0 as of August 2025
No data to display
No data to display
The average time spent on the market went up from 0 days in August 2024, to 0 days as of August 2025
The average time spent on the market went up from 0 days in August 2024, to 0 days as of August 2025.
Single-Family Homes
The overbid percentage has increased from 0% last August 2024, to 0% a year later
Condos & Townhomes
The overbid percentage has increased from 0% last August 2024, to 0% a year later.
No data to display

There were 0 single-family homes for sale, providing 0 months of inventory. There were 0 new listings, and 0 homes sold at a median price of $0. The median overbid percentage was at 0%, with an average of 0 days on the market.
There were 0 condo and townhome units for sale, providing 0 months of inventory. There were 0 new listings and 0 units sold at a median sale price of $0. The median overbid percentage was at 0%, with an average of 0 days on the market.
0 Sold Listings
$0 Median Sale Price ist
MLS Listings Inc., and Courted.io, includes all single-family townhomes in the California Area above from August 2024 to include preliminary data and may vary from the time the data was deemed reliable but not guaranteed. DRE# 01906450. Copyright KW | Burlingame | San Mateo 2025. Each office is independently ory
0 Avg Days on Market

The median sale price has increased from $0 last August 2024, to $0 as of August 2025
The median sale price has increased from $0 last August 2024, to $0 as of August 2025
No data to display
No data to display
The average time spent on the market went up from 0 days in August 2024, to 0 days as of August 2025
The average time spent on the market went up from 0 days in August 2024, to 0 days as of August 2025.
Single-Family Homes
The overbid percentage has increased from 0% last August 2024, to 0% a year later
Condos & Townhomes
The overbid percentage has increased from 0% last August 2024, to 0% a year later.
No data to display

There were 0 single-family homes for sale, providing 0 months of inventory. There were 0 new listings, and 0 homes sold at a median price of $0 The median overbid percentage was at 0%, with an average of 0 days on the market.
There were 0 condo and townhome units for sale, providing 0 months of inventory. There were 0 new listings and 0 units sold at a median sale price of $0. The median overbid percentage was at 0%, with an average of 0 days on the market.

0
New Listings
0 Sold Listings
0 Months of Inventory
$0 Median Sale Price
0%
Median Sale vs List
0 Avg Days on Market
The data, sourced from MLS Listings Inc., and Courted.io, includes all single-family homes, condos, and townhomes in the California Area above from August 2024 to August 2025. This may include preliminary data and may vary from the time the data was gathered. All data is deemed reliable but not guaranteed. DRE# 01906450. Copyright KW Advisors Peninsula Estates | Burlingame | San Mateo 2025. Each office is independently owned and operated.

AUGUST 2024 - AUGUST 2025 LE SOLD
over-year.
Nodatatodispla�
s , y over-year
The median sale price has increased from $0 last August 2024, to $0 as of August 2025
The median sale price has increased from $0 last August 2024, to $0 as of August 2025
No data to display
No data to display
The average time spent on the market went up from 0 days in August 2024, to 0 days as of August 2025
The average time spent on the market went up from 0 days in August 2024, to 0 days as of August 2025.
Single-Family Homes
The overbid percentage has increased from 0% last August 2024, to 0% a year later
Condos & Townhomes
The overbid percentage has increased from 0% last August 2024, to 0% a year later.
No data to display

There were 0 single-family home providing 0 months of inventory. new listings, and 0 homes sold a of $0 The median overbid percen with an average of 0 days on the
There were 0 condo and townhom providing 0 months of inventory. new listings and 0 units sold at a price of $0. The median overbid p at 0%, with an average of 0 days
0 Sold Listings
$0 Median Sale Price
0 Avg Days on Market
Listings Inc., and Courted.io, includes all single-family in the California Area above from August 2024 to preliminary data and may vary from the time the data was reliable but not guaranteed. DRE# 01906450. Copyright KW Burlingame | San Mateo 2025. Each office is independently

The median sale price has increased from $0 last August 2024, to $0 as of August 2025
The median sale price has increased from $0 last August 2024, to $0 as of August 2025
No data to display
No data to display
The average time spent on the market went up from 0 days in August 2024, to 0 days as of August 2025
The average time spent on the market went up from 0 days in August 2024, to 0 days as of August 2025.
Single-Family Homes
The overbid percentage has increased from 0% last August 2024, to 0% a year later
Condos & Townhomes
The overbid percentage has increased from 0% last August 2024, to 0% a year later.
No data to display

There were 0 single-family homes for sale, providing 0 months of inventory. There were 0 new listings, and 0 homes sold at a median price of $0. The median overbid percentage was at 0%, with an average of 0 days on the market.
There were 0 condo and townhome units for sale, providing 0 months of inventory. There were 0 new listings and 0 units sold at a median sale price of $0. The median overbid percentage was at 0%, with an average of 0 days on the market.
stings s of Inventory
% n Sale vs List
0 Sold Listings
$0 Median Sale Price
0 Avg Days on Market
sourced from MLS Listings Inc., and Courted.io, includes all single-family condos, and townhomes in the California Area above from August 2024 to 2025. This may include preliminary data and may vary from the time the data was All data is deemed reliable but not guaranteed. DRE# 01906450. Copyright KW Peninsula Estates | Burlingame | San Mateo 2025. Each office is independently owned and operated.

AUGUST 2024 - AUGUST 2025
Nodatatodispla�
ingle-Family Homes ast 12 months, year-over-year.
Nodatatodispla�
ondos & Townhomes ast 12 months, year-over-year
The median sale price has increased from $0 last August 2024, to $0 as of August 2025
The median sale price has increased from $0 last August 2024, to $0 as of August 2025
No data to display
No data to display
The average time spent on the market went up from 0 days in August 2024, to 0 days as of August 2025
The average time spent on the market went up from 0 days in August 2024, to 0 days as of August 2025.
Single-Family Homes
The overbid percentage has increased from 0% last August 2024, to 0% a year later
Condos & Townhomes
The overbid percentage has increased from 0% last August 2024, to 0% a year later.
No data to display

There were 0 single-family providing 0 months of inve new listings, and 0 homes s of $0. The median overbid with an average of 0 days o
There were 0 condo and to providing 0 months of inve new listings and 0 units so price of $0. The median ov at 0%, with an average of 0
AUGUST 2024 - AUGUST 2025
Nodatatodispla�
s r-over-year.
Nodatatodispla�
es , y r-over-year
The median sale price has increased from $0 last August 2024, to $0 as of August 2025
The median sale price has increased from $0 last August 2024, to $0 as of August 2025
No data to display
No data to display
The average time spent on the market went up from 0 days in August 2024, to 0 days as of August 2025
The average time spent on the market went up from 0 days in August 2024, to 0 days as of August 2025.
Single-Family Homes
The overbid percentage has increased from 0% last August 2024, to 0% a year later
Condos & Townhomes
The overbid percentage has increased from 0% last August 2024, to 0% a year later.
No data to display

There were 0 single-family homes for sale, providing 0 months of inventory. There were 0 new listings, and 0 homes sold at a median price of $0. The median overbid percentage was at 0%, with an average of 0 days on the market.
There were 0 condo and townhome units for sale, providing 0 months of inventory. There were 0 new listings and 0 units sold at a median sale price of $0. The median overbid percentage was at 0%, with an average of 0 days on the market.

0 Sold Listings
$0 Median Sale Price ist
MLS Listings Inc., and Courted.io, includes all single-family townhomes in the California Area above from August 2024 to include preliminary data and may vary from the time the data was deemed reliable but not guaranteed. DRE# 01906450. Copyright KW | Burlingame | San Mateo 2025. Each office is independently ory
0 Avg Days on Market
New Listings
Sold Listings
Months of Inventory
Median Sale Price
Median Sale vs List
Avg Days on Market

AUGUST 2024 - AUGUST 2025
Nodatatodispla�
le-Family Homes
12 months, year-over-year.
dos & Townhomes
Nodatatodispla�
12 months, year-over-year
The median sale price has increased from $0 last August 2024, to $0 as of August 2025
The median sale price has increased from $0 last August 2024, to $0 as of August 2025
No data to display
No data to display
The average time spent on the market went up from 0 days in August 2024, to 0 days as of August 2025
The average time spent on the market went up from 0 days in August 2024, to 0 days as of August 2025.
Single-Family Homes
The overbid percentage has increased from 0% last August 2024, to 0% a year later
Condos & Townhomes
The overbid percentage has increased from 0% last August 2024, to 0% a year later.
No data to display

There were 0 single-family homes for sale, providing 0 months of inventory. There were 0 new listings, and 0 homes sold at a median price of $0. The median overbid percentage was at 0%, with an average of 0 days on the market
There were 0 condo and townhome units for sale, providing 0 months of inventory. There were 0 new listings and 0 units sold at a median sale price of $0. The median overbid percentage was at 0%, with an average of 0 days on the market.
0 Sold Listings
$0 Median Sale Price ist
MLS Listings Inc., and Courted.io, includes all single-family townhomes in the California Area above from August 2024 to include preliminary data and may vary from the time the data was deemed reliable but not guaranteed. DRE# 01906450. Copyright KW | Burlingame | San Mateo 2025. Each office is independently ory
0 Avg Days on Market

AUGUST 2024 - AUGUST 2025
Nodatatodispla�
ily Homes onths, year-over-year.
Nodatatodispla�
Townhomes onths, year-over-year
The median sale price has increased from $0 last August 2024, to $0 as of August 2025
The median sale price has increased from $0 last August 2024, to $0 as of August 2025
No data to display
No data to display
The average time spent on the market went up from 0 days in August 2024, to 0 days as of August 2025
The average time spent on the market went up from 0 days in August 2024, to 0 days as of August 2025.
Single-Family Homes
The overbid percentage has increased from 0% last August 2024, to 0% a year later
Condos & Townhomes
The overbid percentage has increased from 0% last August 2024, to 0% a year later.
No data to display

There were 0 sin providing 0 mon new listings, an of $0. The medi with an average There were 0 co providing 0 mon new listings and price of $0. The at 0%, with an a

New Listings
Sold Listings
Months of Inventory
Median Sale Price 0%
Median Sale vs List
Avg Days on Market

AUGUST 2024 - AUGUST 2025
Nodatatodispla�
Single-Family Homes
Last 12 months, year-over-year.
Condos & Townhomes
Nodatatodispla�
Last 12 months, year-over-year
The median sale price has increased from $0 last August 2024, to $0 as of August 2025
The median sale price has increased from $0 last August 2024, to $0 as of August 2025
No data to display
No data to display
The average time spent on the market went up from 0 days in August 2024, to 0 days as of August 2025
The average time spent on the market went up from 0 days in August 2024, to 0 days as of August 2025.
Single-Family Homes
The overbid percentage has increased from 0% last August 2024, to 0% a year later
Condos & Townhomes
The overbid percentage has increased from 0% last August 2024, to 0% a year later.
No data to display


Secure Your Dream Home Today

Navigating the mortgage application process can be a breeze with a little preparation. To ensure a successful application and closing, consider these helpful tips for what to avoid.


3
4 5 6 1 2
Avoid major purchases like furniture, cars, or vacations to keep your credit profile stable. Maintain your current employment to show financial stability. Always consult your mortgage professional before making large financial moves.
Avoid paying off debts or collections without professional advice.
Use verified funds for deposits to prevent closing delays.
Don't have your credit report pulled too many times - this can hurt your credit score.


In2024,thehomebuyingmarketfacessignificantchallenges highprices, steepinterestrates,andlimitedhousinginventory Formany,renovatingtheir currenthomeisamoreattractiveoptionthanpurchasinganewone.Whilethe LIRAreportpredictsadeclineinrenovationspending,expertsemphasizethat small-scaleupdatesortargetedlargerprojectscanstilldelivermajorbenefits.
Beforedivingintoarenovation,it’sessentialtoplan carefullyandbudgetwisely.Workingwithreputable professionalsiskey,especiallythoseoffering financingoptionsandtransferablewarranties.Sharing yourbudgetwithcontractorsupfrontandinvolving designersearlyensuresthatyourrenovationruns smoothlyandachievesbothfinancialandfunctional success Adetailedplanwillkeeptheprojectontrack andhelpavoidcostlysurprises


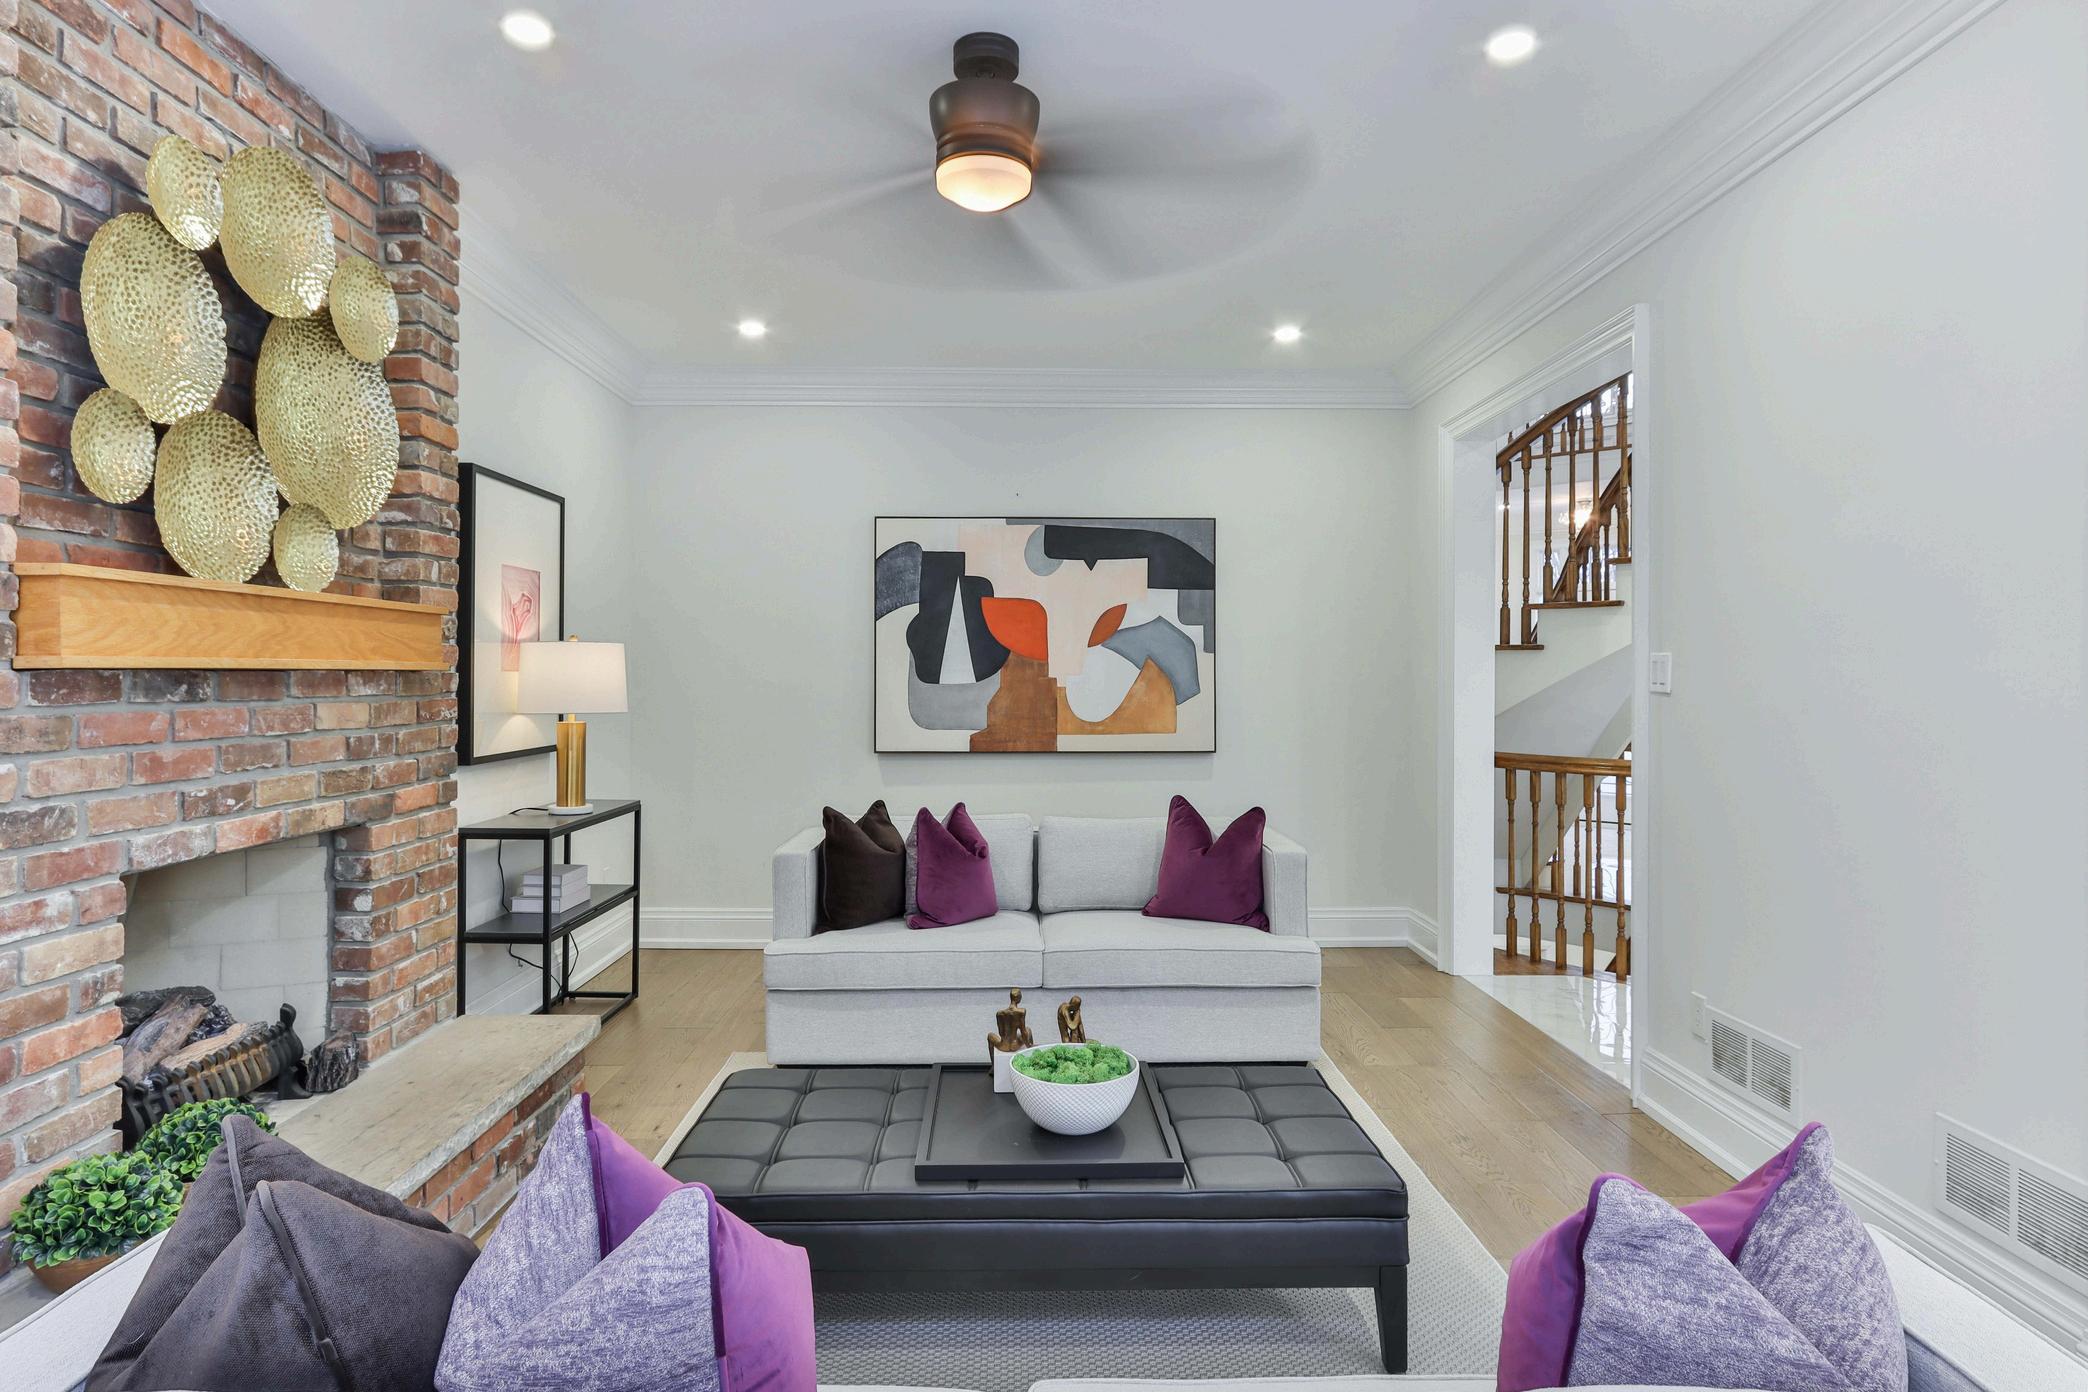
Bathrooms are a safe investment. Simple changes like a new vanity, upgraded flooring, or fresh lighting can completely transform the space. For a luxurious touch, consider adding a freestanding tub for a spa-like experience


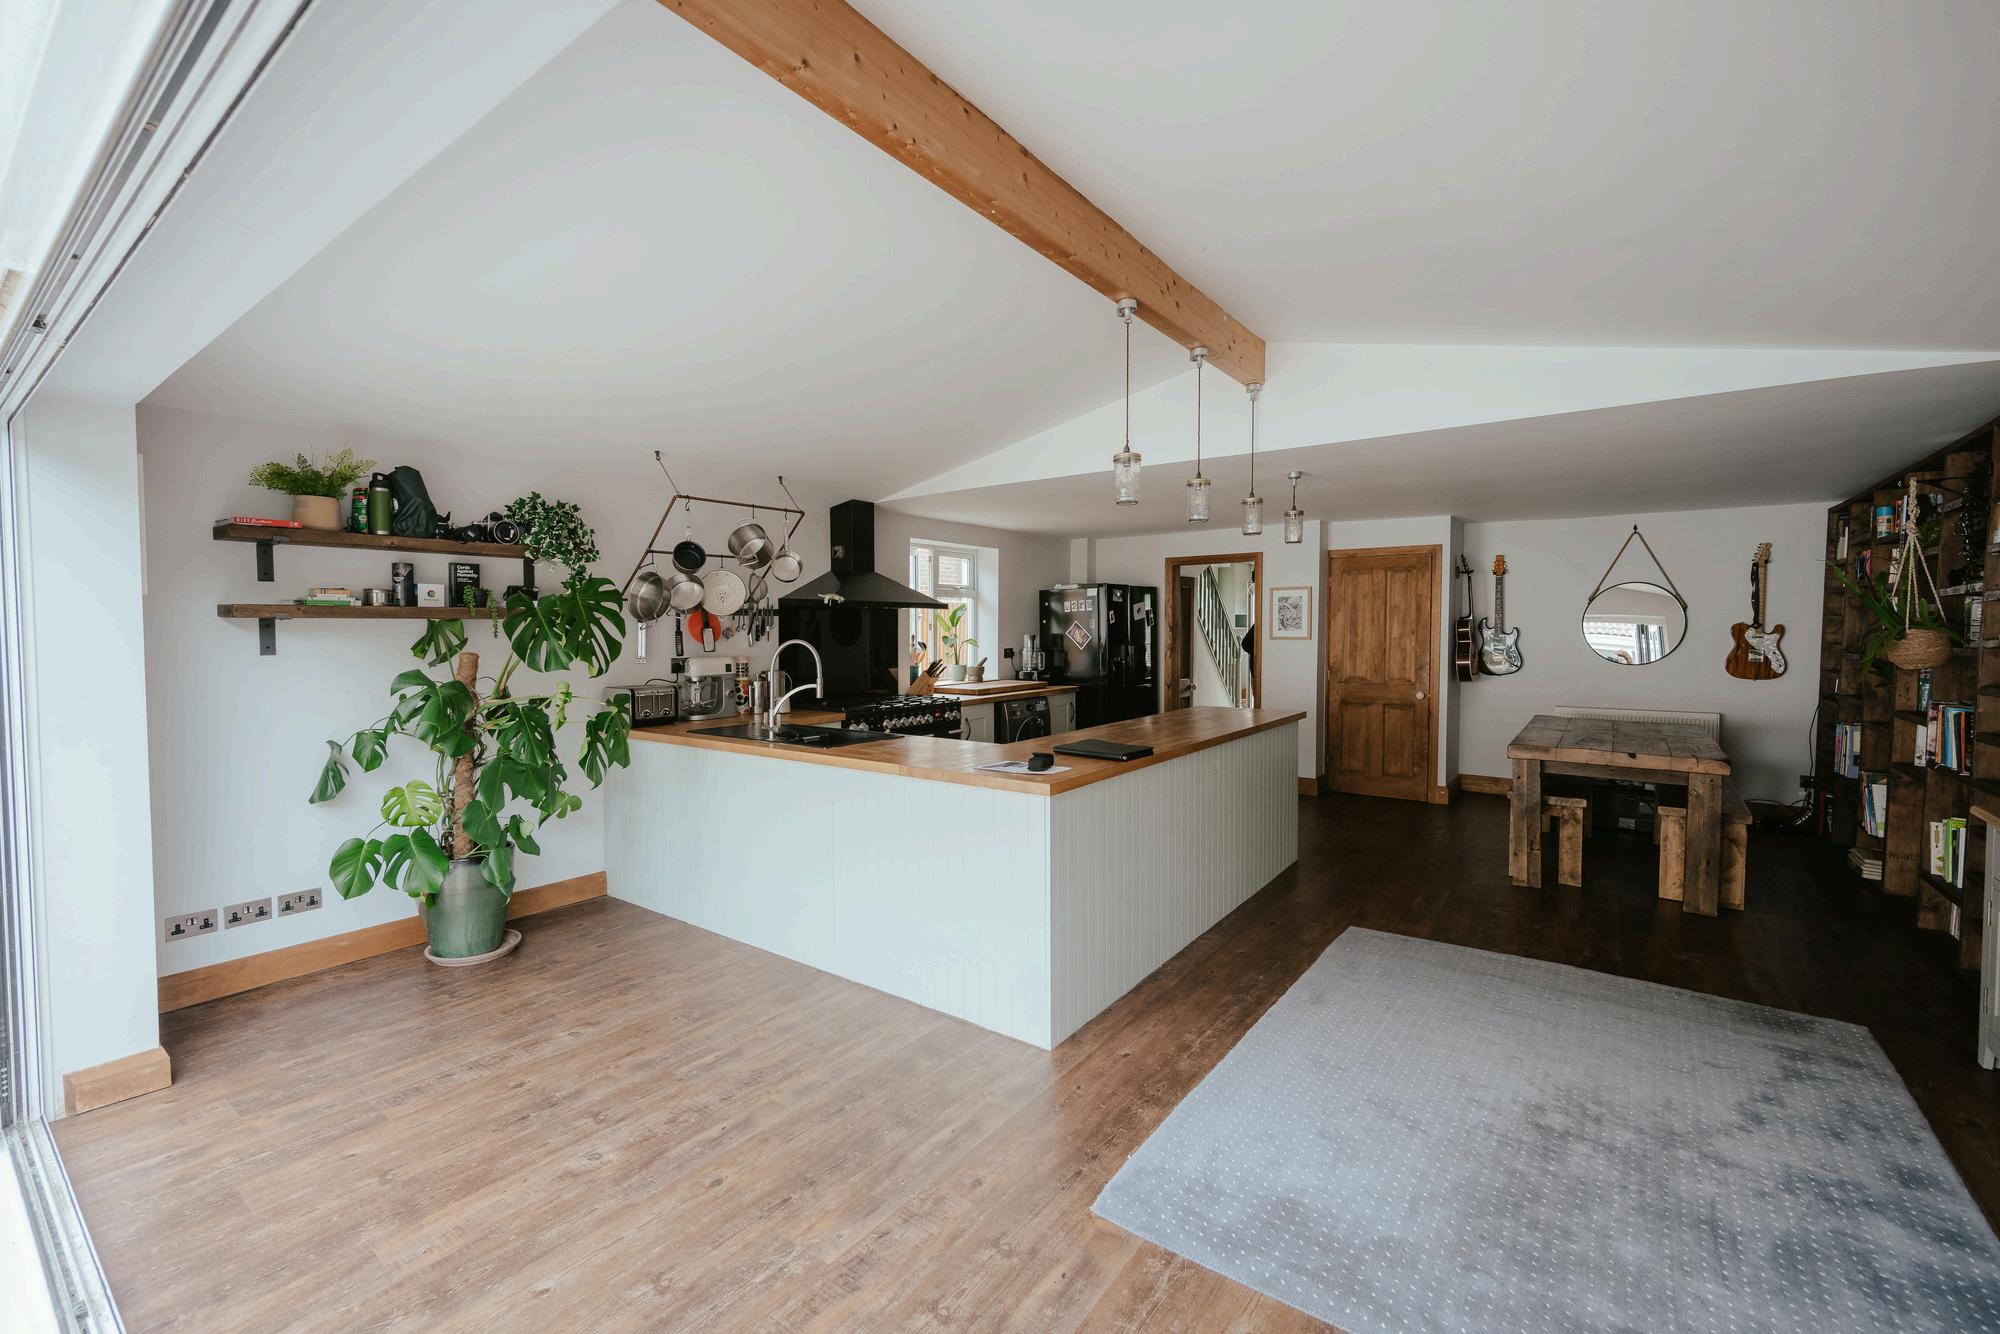
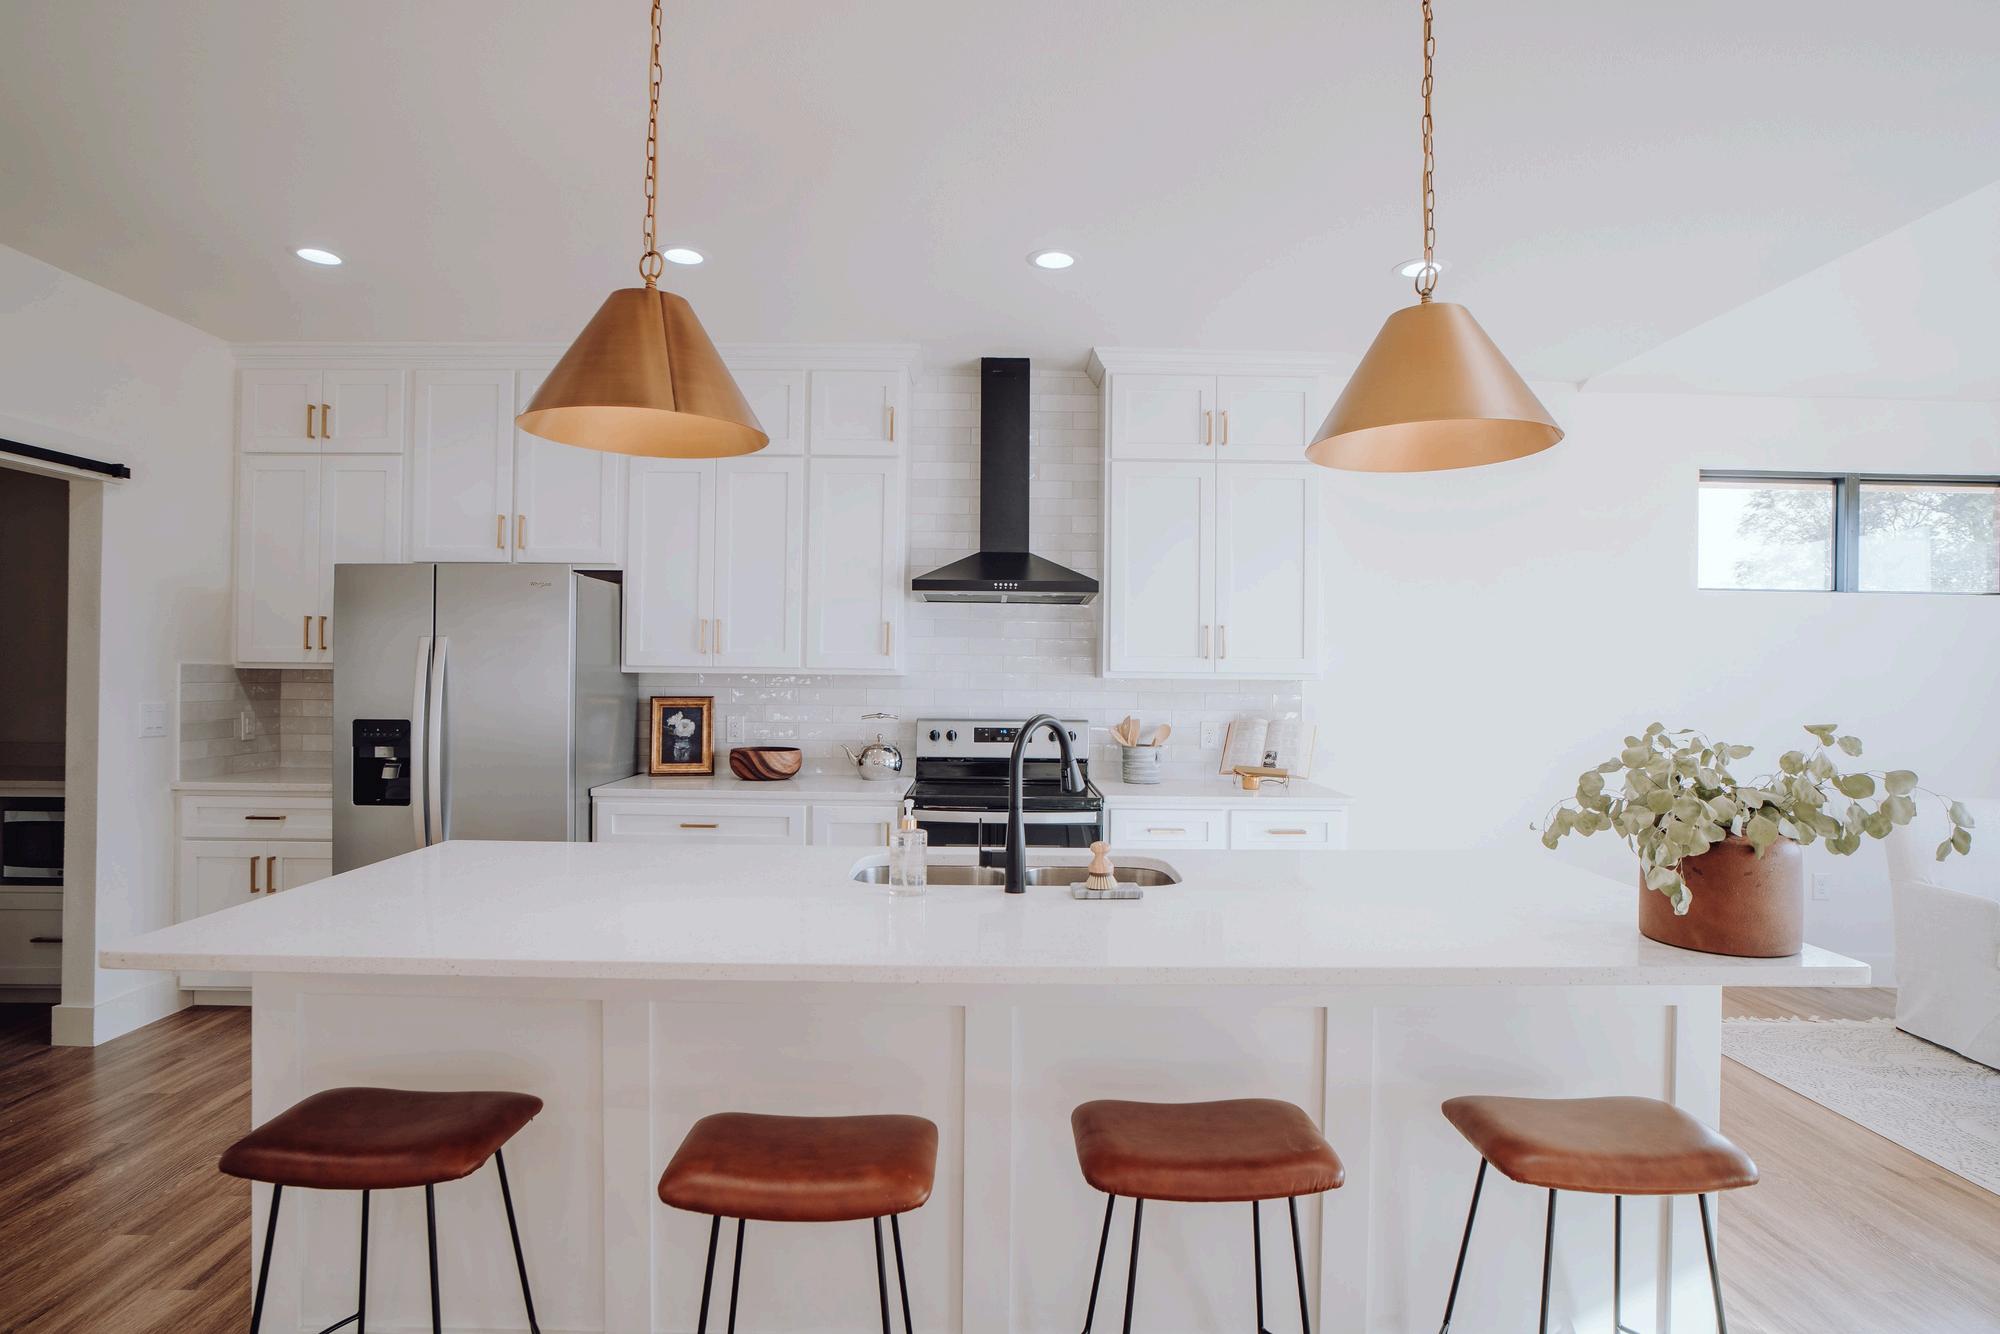
The kitchen is a crucial space for resale value. Opening up the space or adding functional features can make a big difference Smaller updates, like upgrading appliances, cabinets, or flooring, can give your kitchen a fresh, modern feel


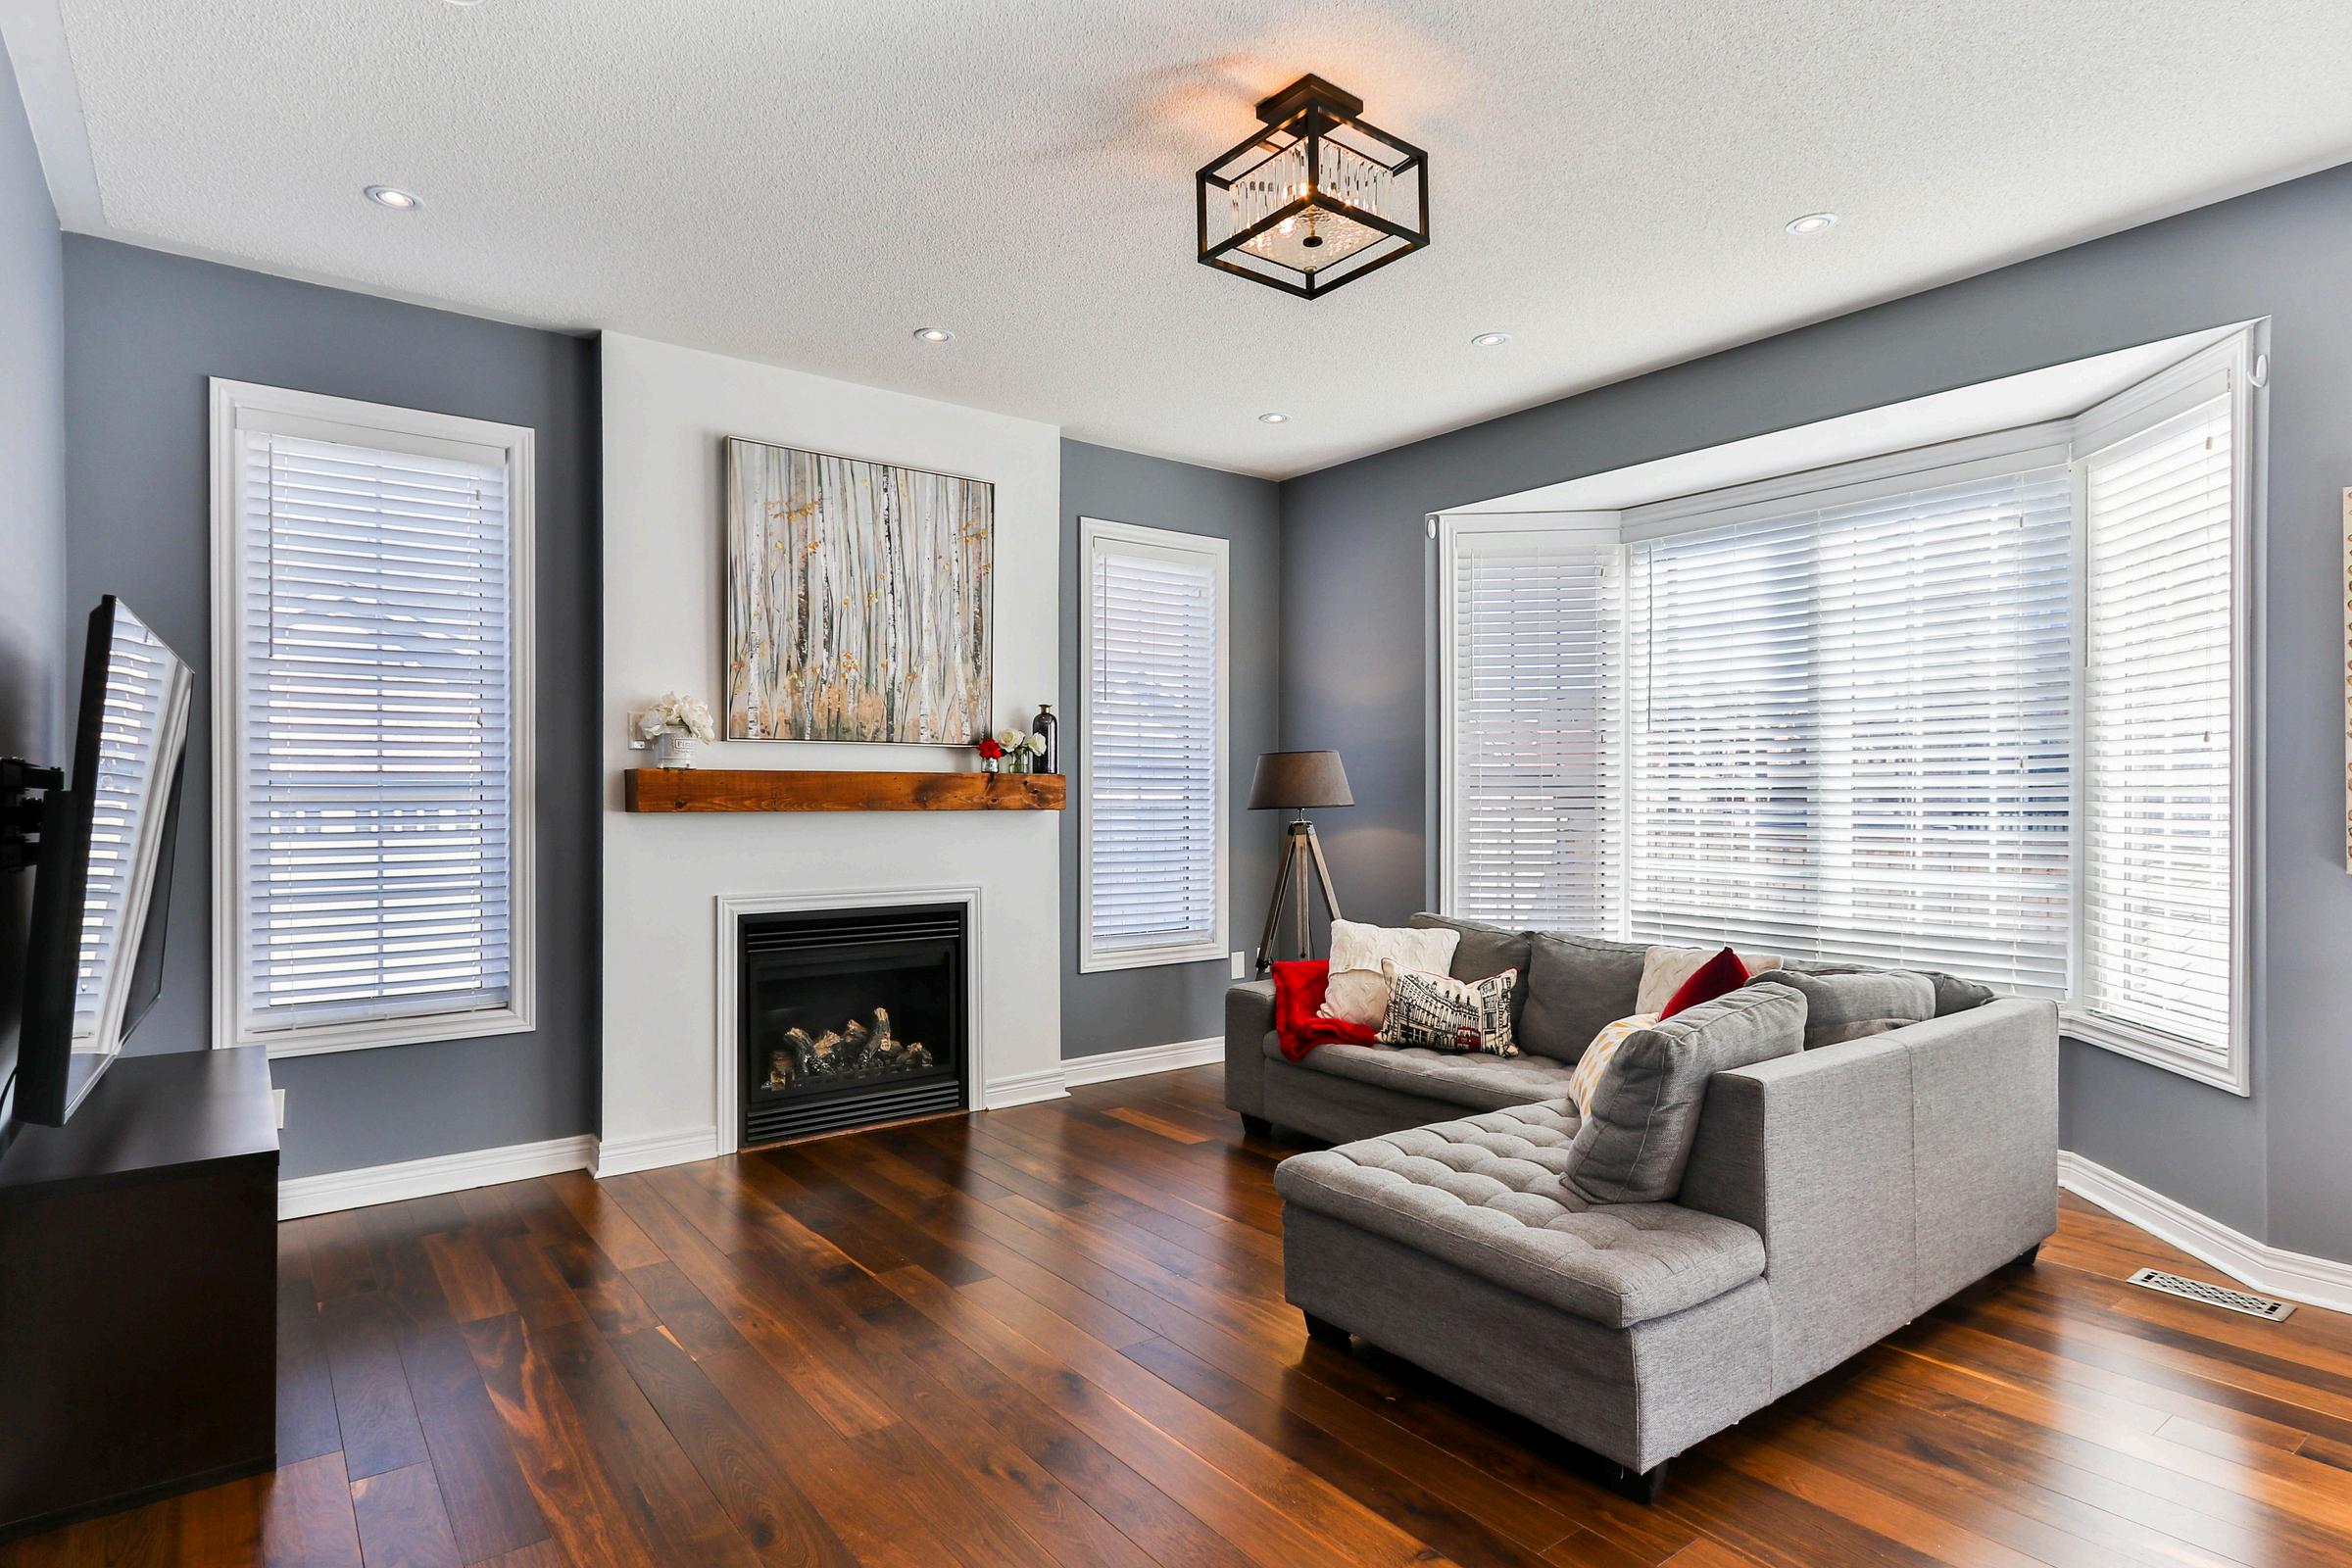
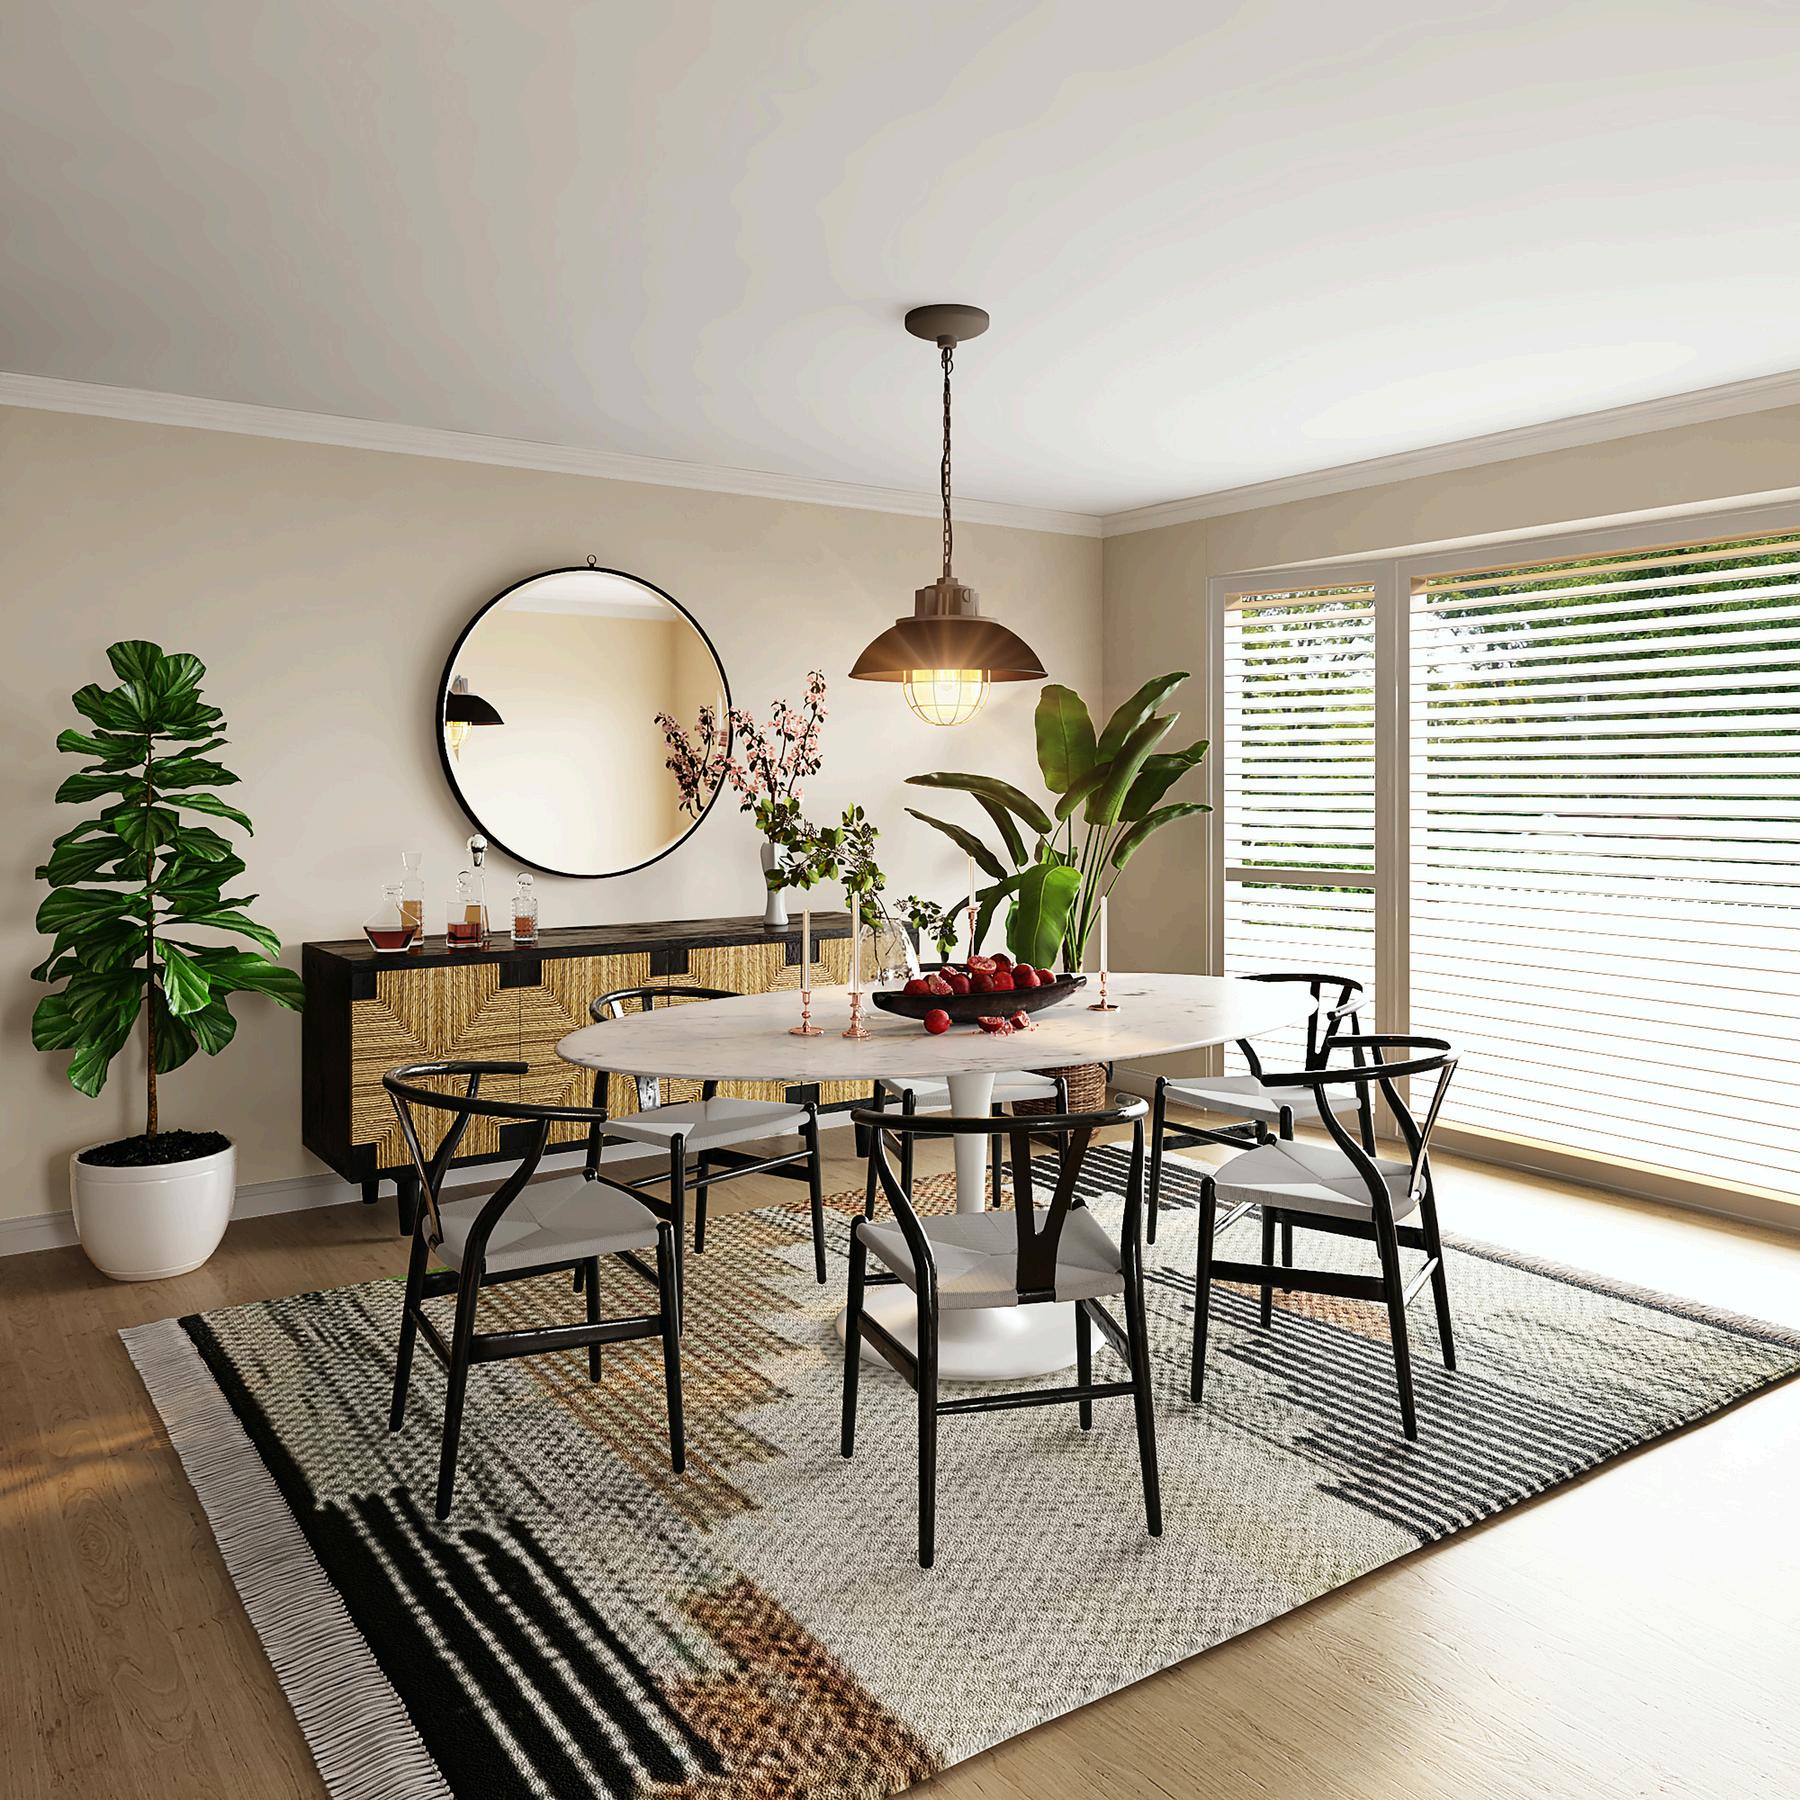
Bold design choices, such as statement wallpaper, unique lighting, or striking color palettes, can refresh any room. Layering textiles or mixing traditional and modern styles creates a space that feels cohesive and impactful


Renovations focusing on health are becoming increasingly popular. Use non-toxic materials free from Red List chemicals like BPA and VOCs. Consider adding air purifiers, water filtration systems, and better ventilation to create a healthier living environment


First impressions matter, and curb appeal can greatly impact your home's value. Exterior upgrades like siding, roofing, and landscaping enhance both aesthetics and security. Adding outdoor living spaces, such as a garden or entertainment area, boosts appeal even more.


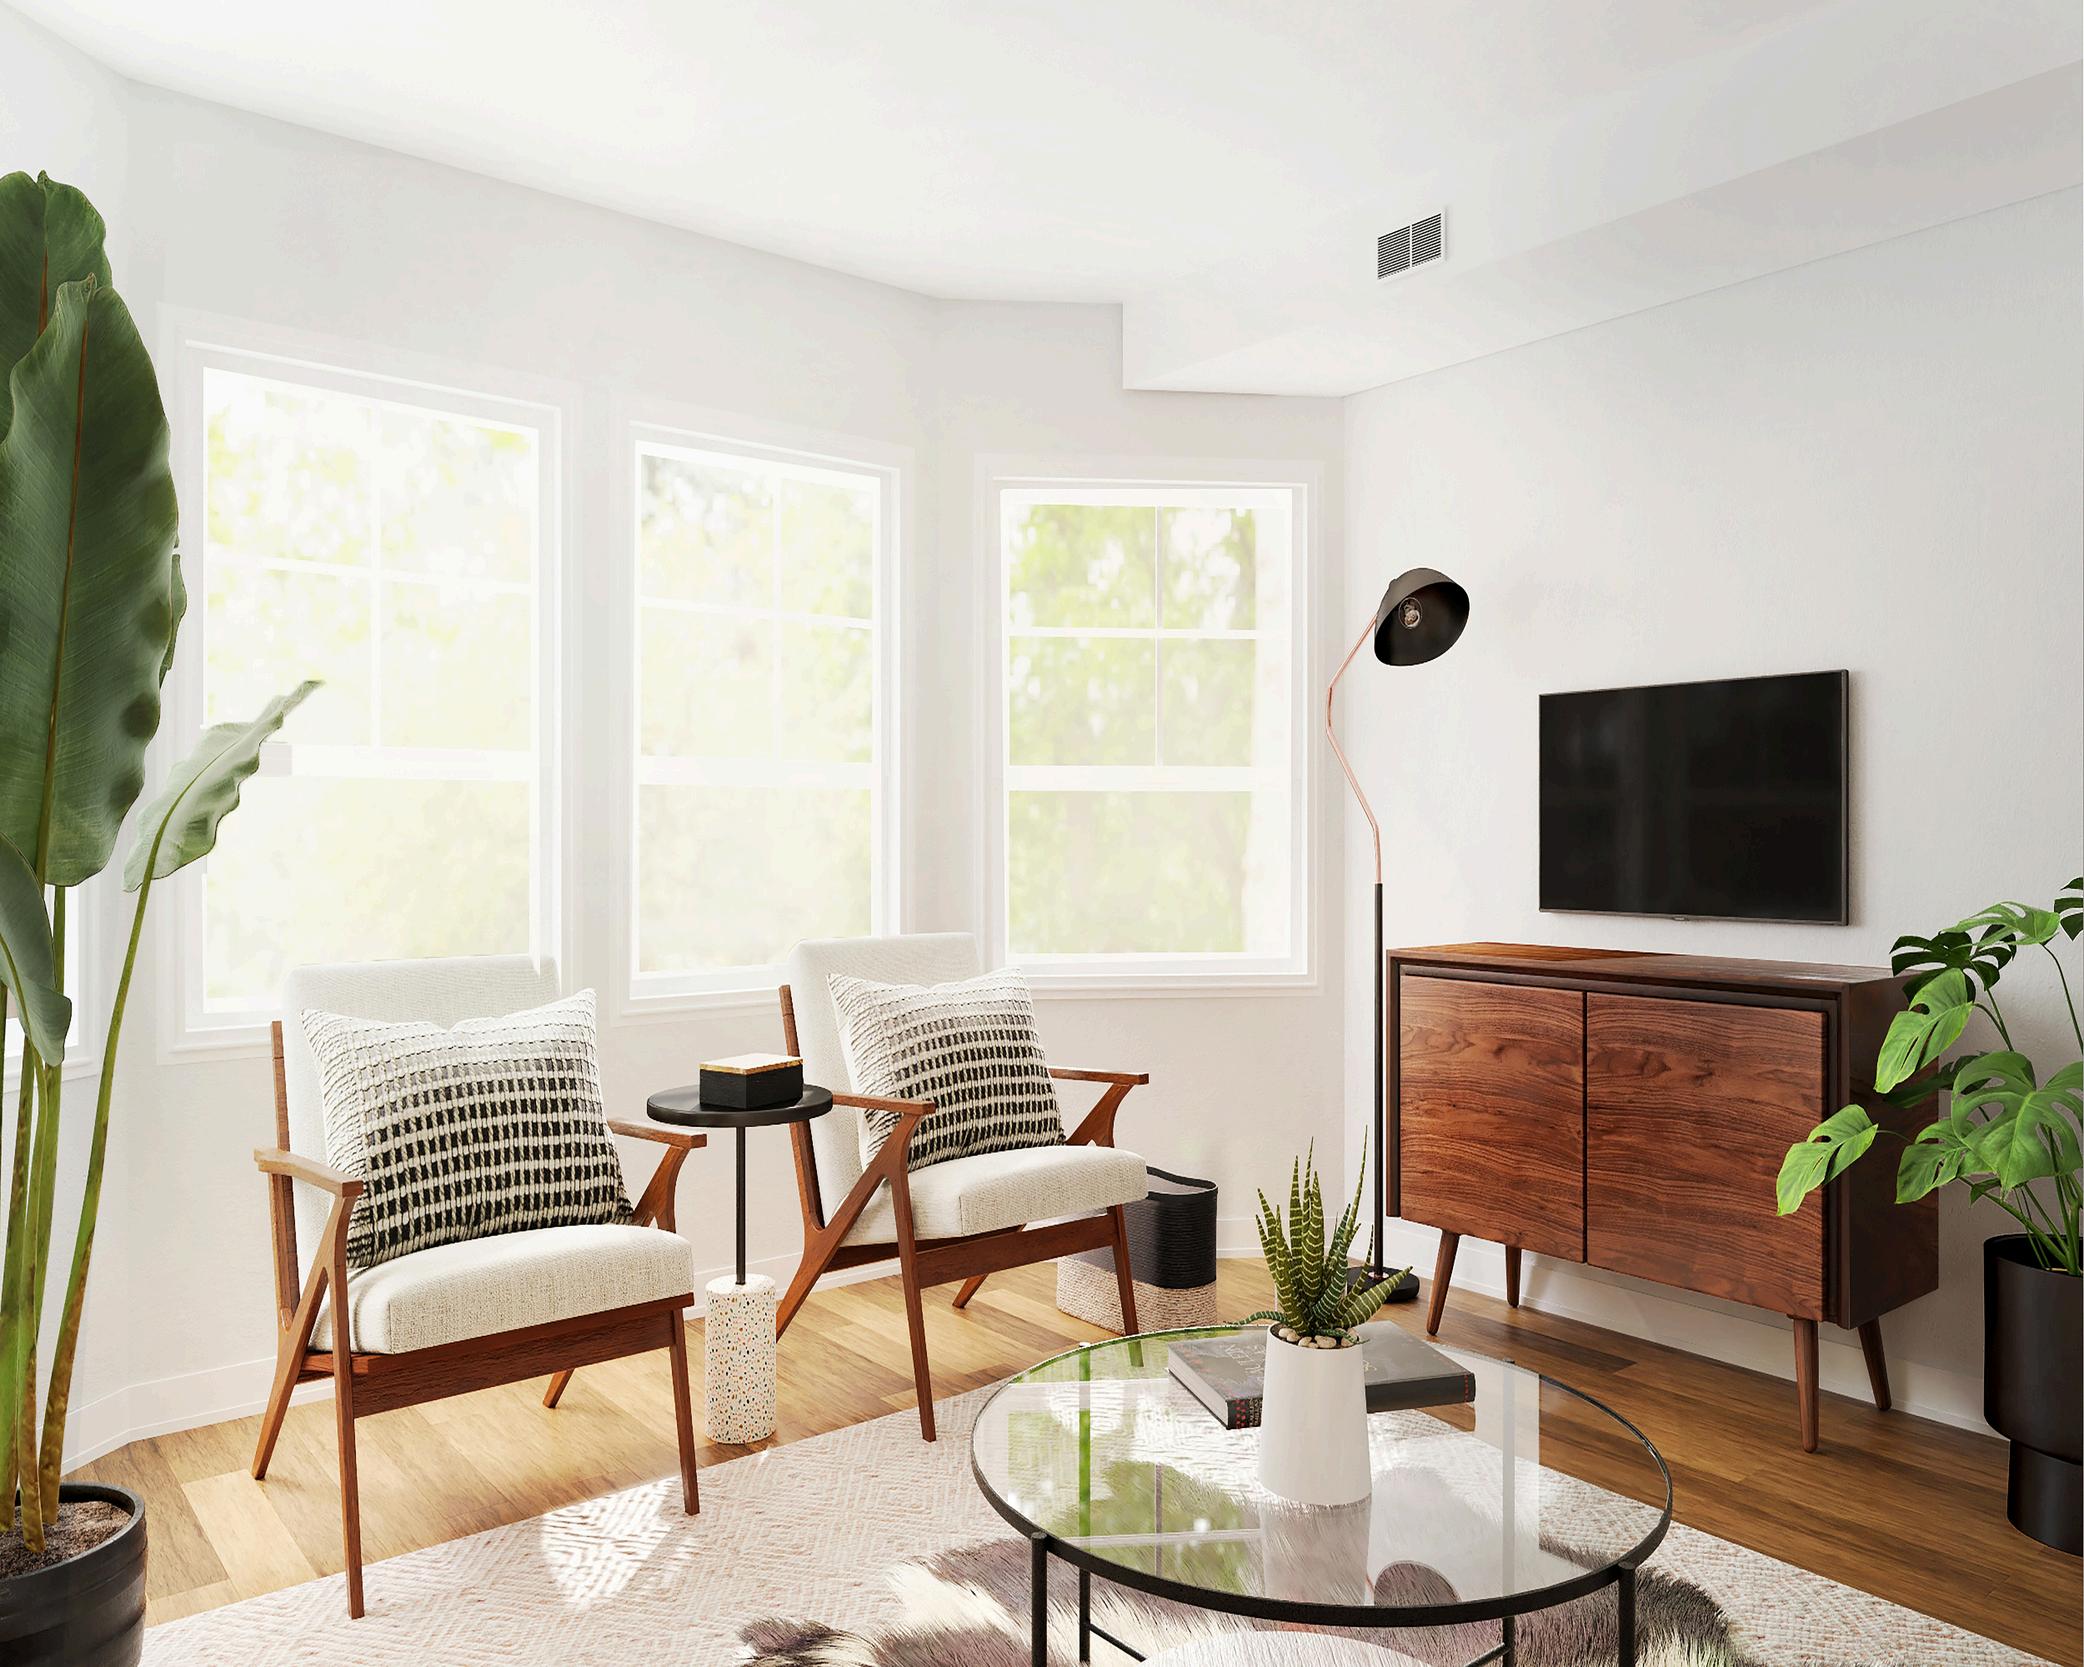
Tailor renovations to your family’s lifestyle. Flexible spaces that accommodate workfrom-home needs, growing children, or future buyers will add lasting value. Think about both how your family uses the space and how it will appeal to future buyers.

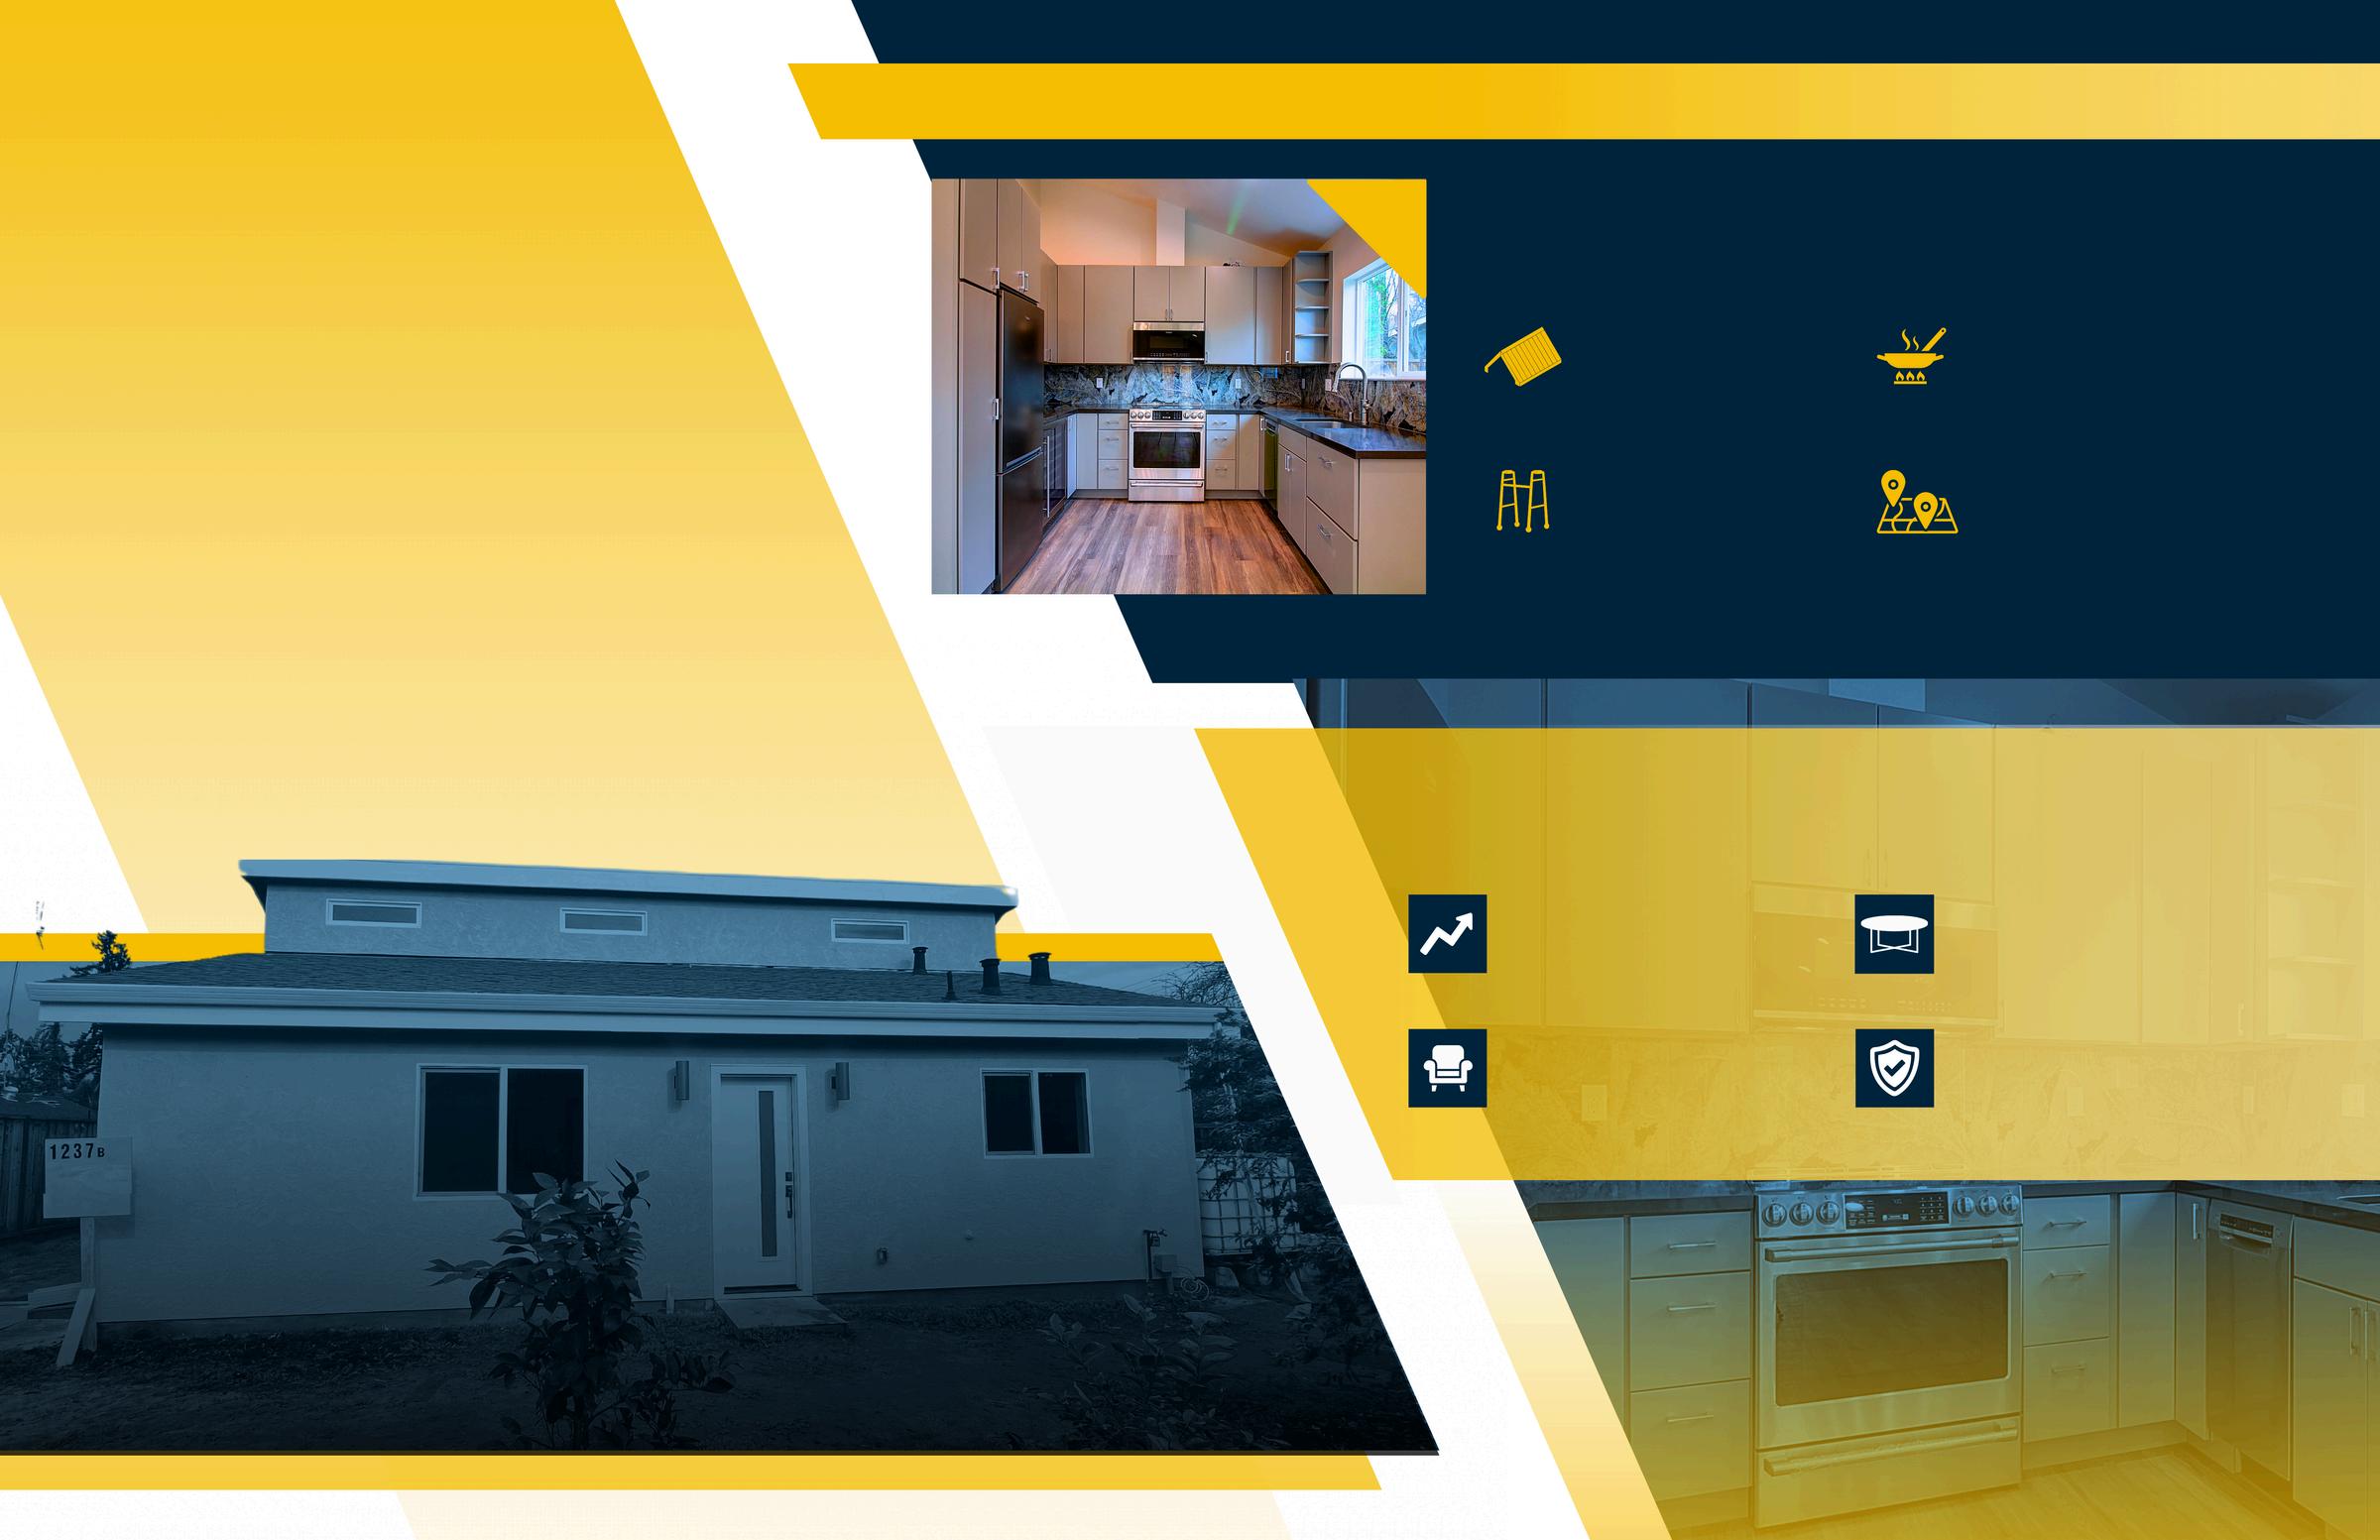

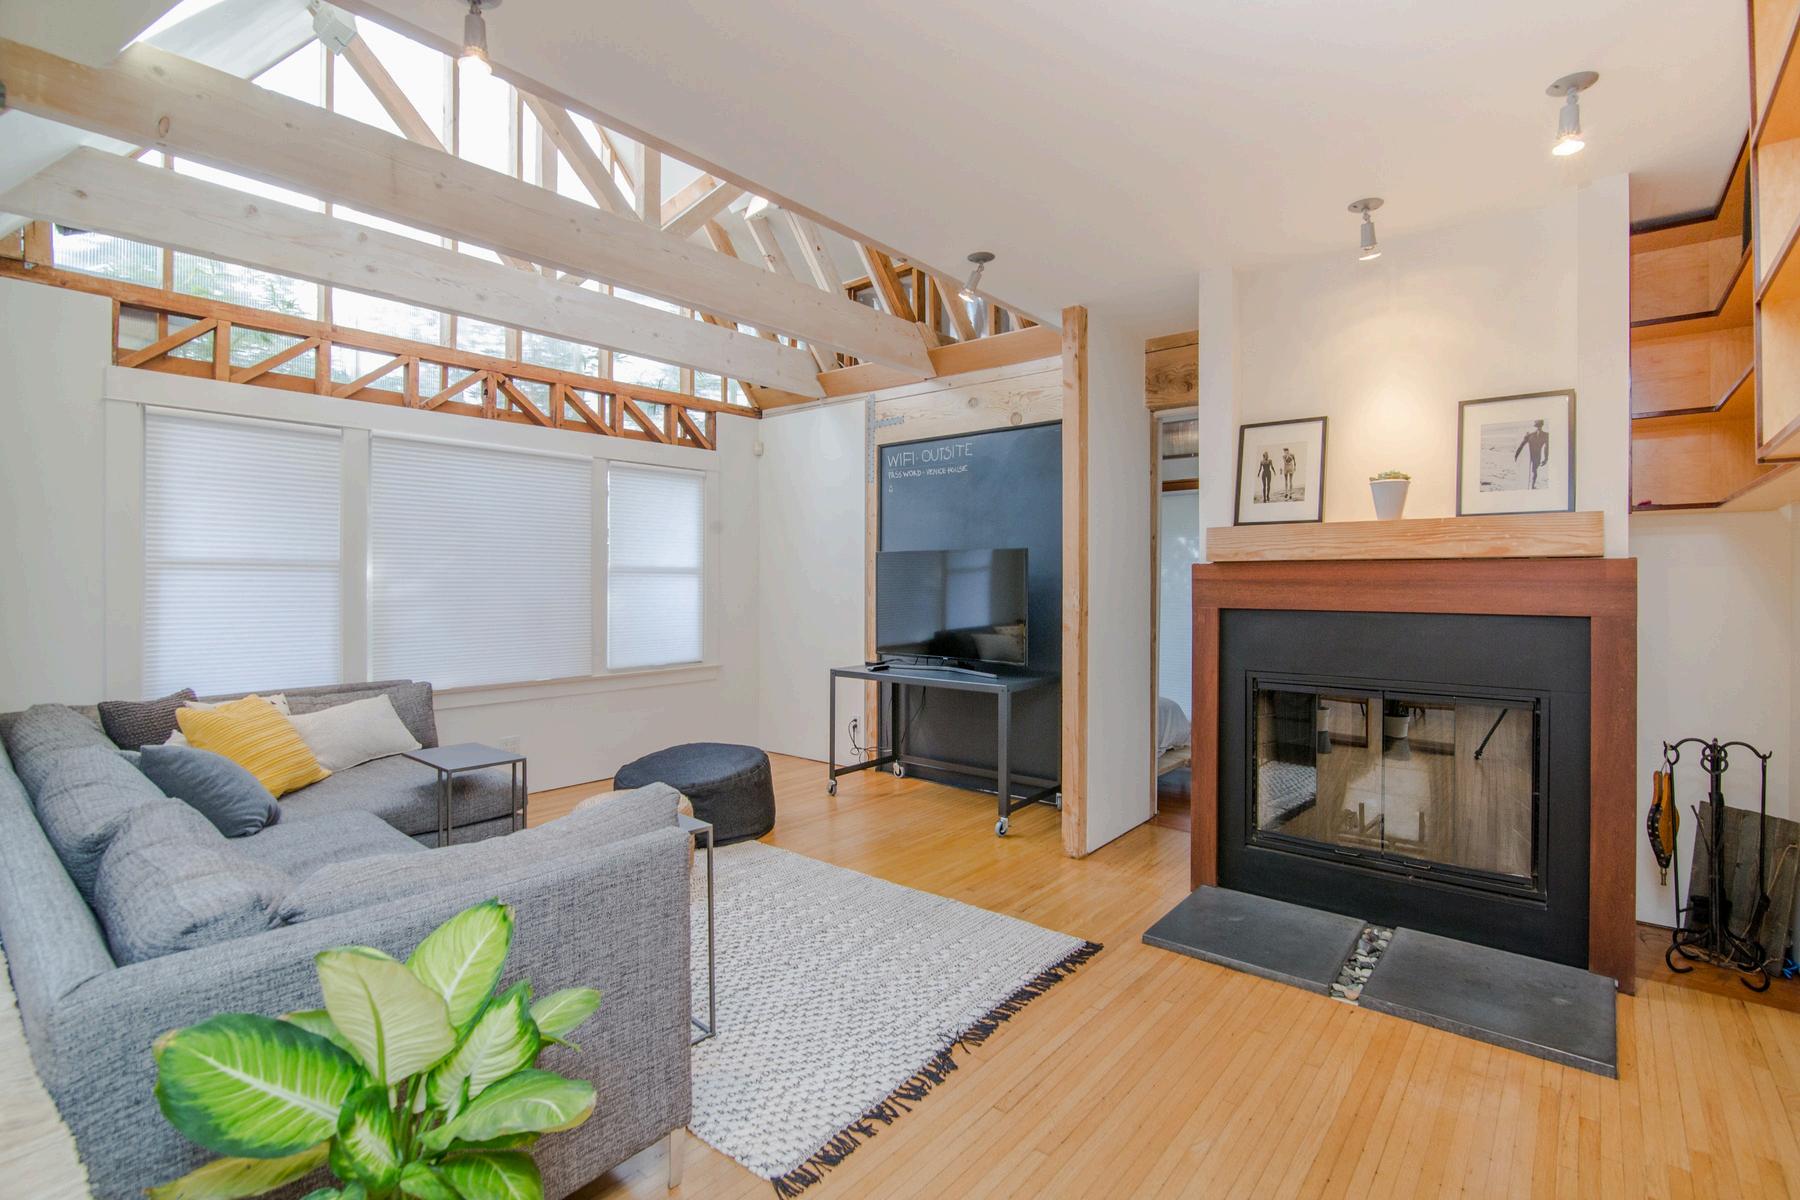
The Anenberg-Essert family in Campbell collaborated with Acton ADU to create a versatile, comfortable, and valuable addition to their property. This ADU project is a shining example of how a well-designed accessory dwelling unit can increase property value and serve a family’s unique needs.
The family envisioned an ADU that would function as an independent living space for family members, enhance their property’s worth, and provide seamless integration with the main home They wanted a space that balanced privacy with connectivity, feeling like a natural extension of their residence
Constructed at 747 square feet, this ADU was designed with modern, high-quality finishes to serve both aesthetic and practical needs. Key features include:
Vaulted Ceilings
Creates a spacious, open atmosphere
Senior-Friendly Living
Safe, independent space for elderly family members
Fully Equipped Kitchen
Modern amenities for everyday convenience
Open Living Area
Multipurpose area for relaxation and entertainment
The completion of the Anenberg-Essert ADU led to several valuable outcomes:
Increased Property Value
The ADU addition significantly boosted property value
Flexible Living Space
A versatile space for family, guests, or as a rental
Modern Comforts
High-end finishes and amenities enhance both function and style.
Enhanced Family Living
The ADU enriches the AnenbergEssert family’s home with both privacy and connection

Thinking about how an ADU could fit into your family’s lifestyle or property investment strategy?
Trust Acton ADU to guide you every step of the way.

When it comes to home ownership, knowing who you can trust is crucial. That's why we've curated a select list of trusted vendors who are ready to help with your home goals.