


Atherton
Jump to Atherton Report
Menlo Park
Jump to Menlo Park Report
Belmont
Jump to Belmont Report
Burlingame
Jump to Burlingame Report
Foster City
Jump to Foster City Report

Hillsborough
Jump to Hillsborough Report
Palo Alto
Jump to Palo Alto Report
Portola Valley
Jump to Portola Valley Report
Redwood City
Jump to Redwood City Report
San Carlos
Jump to San Carlos County
San Mateo County
Jump to San Mateo County Report
Santa Clara County
Jump to Santa Clara County Report
Jump to Woodside Report

A local Bay Area Pioneer- Sarah is the 5th Generation in San Mateo County She began her career over 30 years ago as the owner and operator of her own real estate company Then went onto opening two Century 21 franchises, followed by opening a RE/MAX franchise.
She earned the prestigious “Centurion” and “Platinum” top producer awards. Both of these awards acknowledge Sarah’s accomplishments that lead her to ranking in the top 1% of Sales Professionals Nationwide
In addition to her vast real estate experience, and successfully closing over 575 sales in her career she also has background and experience in interior design, construction and remodeling. Sarah has built 2 custom luxury homes, as well as...

KW Peninsula Estates DRE #01312901 (650) 898-4863 sarahparsons@realtor com
www.sarahparsons.biz
Check out my website here 1430 Howard Ave , Burlingame, CA. 94010
Sarah advised us on what truly needed to be done to get the most 'bang' for our dollar. She sold our house in 13 days, with 4 bids all over asking price. It closed in 21 days and we were super happy with her skills to accomplish this in such a short period of time Our house sold for $116,000 Over the last sale in our neighborhood, on the market for only 14 days, Closed escrow in 21 days!
Thank you so much for making a 20 year dream of mine come true! When I tell people that we found our home, put in a bid and the bid was accepted (in one day) UNDER ASKING PRICE all they could say was ”WOW, in this market, I can’t believe it. Truly I don’t think I could have done this without your support, you had some amazing tricks up your sleeve! Glad you were referred to us!”
-Laura and David
What a pleasure it has been working with you in the sale of our home. We had been listed with another brokerage with no results but were pleasantly surprised at how efficient your system was You made the entire process seem so easy compared to what we previously experienced! We thank you and your team! Please stay in touch with us.
- Stan and Eve
For more testimonials, click here
Curious about what’s trending in your neighborhood? Ready to make a move? Download our app for real estate insights, on demand.
Work with an Agent Custom Searches
Dynamic Map Get Local
Anytime Access
Share Information
Download the Keller Williams Real Estate Mobile App for iPhone, iPad, and Android via the links below:

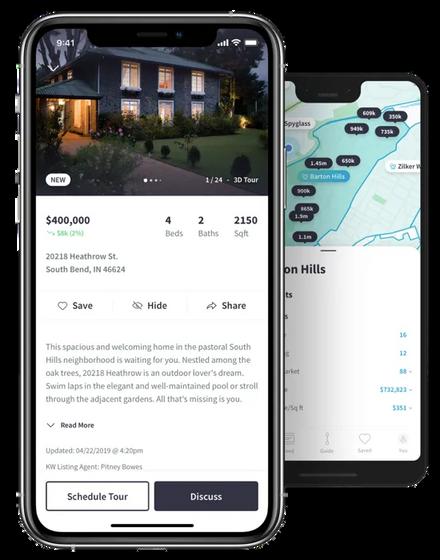
For more information, click here
I am
to maintaining a
relationship with you, as evidenced by my past work Please contact me when you're ready to move forward with your next purchase or sale, and let's discuss how to make it happen
That's really the question you should be asking yourself
Our market is incredibly diverse, and rapidly changing. Values vary not just by neighborhood, but by street Your home isn't necessarily worth what your neighbors’ home is. At the end of the day, it’s the current market that sets the value of your home
So, do you know what your home is worth in today's market?


If you’re hoping to buy a home this year, you’re probably paying close attention to mortgage rates. Since mortgage rates impact what you can afford when you take out a home loan – and affordability is a challenge today – it’s a good time to look at the big picture of where mortgage rates have been historically compared to where they are now Beyond that, it’s important to understand their relationship with inflation for insights into where mortgage rates might go in the near future.
Freddie Mac has been tracking the 30-year fixed mortgage rate since April of 1971 Every week, they release the results of their Primary Mortgage Market Survey, which averages mortgage application data from lenders across the country.
There were 31 single-family homes for sale, providing 15 months of inventory There were 6 new listings and 12 homes sold at a median price of $8.2m. The median overbid percentage was 89.1%, with an average of 88 days on the market.
There were 0 condo and townhome units for sale, providing 0 months of inventory. There were 0 new listings, and 1 unit sold at a median sale price of $1.5m. The median overbid percentage was 0%, with an average of 0 days on the market.

6 New Listings
1.5 Months of Inventory
6 Sold Listings
$8.2M Median Sale Price
89.1% Median Sale vs List
88 Avg Days on Market
The data, sourced from MLS Listings, InfoSparks and Broker Metrics, includes all single-family homes, condos and townhomes in the California Area from July 2022 to July 2023 (Pulled August 22, 2023) This may include preliminary data, and may vary from the time the data was gathered All data is deemed reliable but not guaranteed DRE# 01906450 Copyright KW Advisors Peninsula Estates | Burlingame | San Mateo 2023 Each office is independently owned and operated
New Listings
1 Sold Listing
0
Months of Inventory
$1.5M Median Sale Price 0%
Median Sale vs List 0 Avg Days on Market

amily Homes onths, year-over-year. & Townhomes onths, year-over-year
The median sales price has increased from $7m last August 2022, to $82m as of August 2023
Condos & Townhomes
The median sales price has increased from $0 last August 2022, to $1.5m as of August 2023.
Single-Family Homes
The average time spent on the market went up from 59 days last August 2022, to 88 days as of August 2023
Condos & Townhomes
The average time spent on the market has remained at 0 days since August 2022
Single-Family Homes
The overbid percentage has decreased from 91.3% last August 2022, to 891% a year later
Condos & Townhomes
The overbid percentage has increased from 0% last August 2022, to 100.1% a year later.

There were 7 single-family homes for sale, providing 06 months of inventory There were 11 new listings and 11 homes sold at a median price of $2.1m. The median overbid percentage was 109.2%, with an average of 18 days on the market.
There were 3 condo and townhome units for sale, providing 1.5 months of inventory. There were 4 new listings and 2 units sold at a median price of $1.2m. The median overbid percentage was 107.6%, with an average of 28 days on the market.

11 Sold Listings Homes
$2.1M
Median Sale Price
18 Avg Days on Market
oSparks and Broker Metrics, includes wnhomes in the California Area from , 2023) This may include preliminary ata was gathered All data is deemed 01906450 Copyright KW Advisors eo 2023 Each office is independently
4
New Listings
2 Sold Listings
1.5
Months of Inventory
$1.2M
Median Sale Price
107.6%
Median Sale vs List
28 Avg Days on Market


Single-Family Homes
The median sales price has increased from $564k last August 2022, to $1.2m as of August 2023. The median sales price has increased from $2150m last August 2022, to $2180m as of August 2023
Condos & Townhomes
Single-Family Homes
The average time spent on the market went down from 20 days last August 2022, to 18 days as of August 2023
Condos & Townhomes
The average time spent on the market went up from 25 days in August 2022, to 28 days as of August 2023
Single-Family Homes
The overbid percentage has increased from 99.9% last August 2022, to 1092% a year later
Condos & Townhomes
The overbid percentage has increased from 98.9% last August 2022, to 107.6% a year later.

There were 29 single-family homes for sale, providing 22 months of inventory There were 23 new listings, and 13 homes sold at a median price of $2.8m. The median overbid percentage was 101.6%, with an average of 17 days on the market.
There were 8 condo and townhome units for sale, providing 4 months of inventory. There were 6 new listings and 2 units sold at a median price of $926k. The median overbid percentage was 96.2%, with an average of 15 days on the market.

23 New Listings
2.2 Months of Inventory
13 Sold Listings
$2.8M Median Sale Price
101.6% Median Sale vs List
17 Avg Days on Market
The data, sourced from MLS Listings, InfoSparks and Broker Metrics, includes all single-family homes, condos and townhomes in the California Area from July 2022 to July 2023 (Pulled August 22, 2023) This may include preliminary data, and may vary from the time the data was gathered All data is deemed reliable but not guaranteed DRE# 01906450 Copyright KW Advisors Peninsula Estates | Burlingame | San Mateo 2023 Each office is independently owned and operated

Single-Family Homes
The median sales price has decreased from $283m last August 2022, to $28m as of August 2023
Condos & Townhomes
The median sales price has decreased from $1.3m last August 2022, to $926k as of August 2023.
Single-Family Homes
The average time spent on the market went down from 25 days last August 2022, to 17 days as of August 2023
Condos & Townhomes
The average time spent on the market went up from 3 days in August 2022, to 15 days as of August 2023
Single-Family Homes
The overbid percentage has increased from 99.1% last August 2022, to 1016% a year later
Condos & Townhomes
The overbid percentage has decreased from 104.5% last August 2022, to 96.2%a year later.
There were 4 single-family homes for sale, providing 03 months of inventory There were 6 new listings and 12 homes sold at a median price of $2.5m. The median overbid percentage was 103.6%, with an average of 18 days on the market.
There were 15 condo and townhome units for sale, providing 1.5 months of inventory. There were 16 new listings and 10 units sold at a median price of $1.4m. The median overbid percentage was 103.7%, with an average of 14 days on the market.
6 New Listings
0.3 Months of Inventory
12 Sold Listings
$2.5M Median Sale Price
103.6% Median Sale vs List
18 Avg Days on Market
The data, sourced from MLS Listings, InfoSparks and Broker Metrics, includes all single-family homes, condos and townhomes in the California Area from July 2022 to July 2023 (Pulled August 22, 2023) This may include preliminary data, and may vary from the time the data was gathered All data is deemed reliable but not guaranteed DRE# 01906450 Copyright KW Advisors Peninsula Estates | Burlingame | San Mateo 2023 Each office is independently owned and operated
16 New Listings
Median Sale vs List Avg Days on Sold
1.5 Months of Inventory $1.4 Median Sa 103.7%
2022
LISTINGS FOR SALE SOLD LISTINGS
amily Homes onths, year-over-year. & Townhomes onths, year-over-year
Single-Family Homes
The median sales price has increased from $1.2m last August 2022, to $1.4m as of August 2023. The median sales price has increased from $2m last August 2022, to $25m as of August 2023
Condos & Townhomes
Single-Family Homes
The average time spent on the market has remained at 18 days since last August 2022
Condos & Townhomes
The average time spent on the market went down from 16 days in August 2022, to 14 days as of August 2023
Single-Family Homes
The overbid percentage has increased from 98.3% last August 2022, to 1036% a year later
Condos & Townhomes
The overbid percentage has increased from 103.4% last August 2022, to 103.7% a year later.
9 Sold Listings ly Homes
$6.5M Median Sale Price
28 Avg Days on Market
ngs, InfoSparks and Broker Metrics, includes and townhomes in the California Area from ugust 22, 2023) This may include preliminary e the data was gathered All data is deemed DRE# 01906450 Copyright KW Advisors San Mateo 2023 Each office is independently

AUGUST 2022 - AUGUST 2023
LISTINGS FOR SALE SOLD LISTINGS
Single-Family Homes
Last 12 months, year-over-year.
No data for this month
Condos & Townhomes
Last 12 months, year-over-year
Single-Family Homes
The median sales price has increased from $6m last August 2022, to $65m as of August 2023
Condos & Townhomes
No data for this month.
Single-Family Homes
The average time spent on the market went up from 22 days last August 2022, to 28 days as of August 2023
Condos & Townhomes
No data for this month
Single-Family Homes
The overbid percentage has decreased from 101.8% last August 2022, to 968% a year later
Condos & Townhomes
No data for this month

MWha data
There provid were 3 media percen days o
There for sal
There at a m overbi averag

36 New Listings
2.1 Months of Inventory
24 Sold Listings
$2.8M Median Sale Price
97.3% Median Sale vs List
26 Avg Days on Market
The data, sourced from MLS Listings, InfoSparks and Broker Metrics, includes all single-family homes, condos and townhomes in the California Area from July 2022 to July 2023 (Pulled August 22, 2023) This may include preliminary data, and may vary from the time the data was gathered All data is deemed reliable but not guaranteed DRE# 01906450 Copyright KW Advisors Peninsula Estates | Burlingame | San Mateo 2023 Each office is independently owned and operated
Listings 3

Single-Family Homes
The median sales price has increased from $920k last August 2022, to $950k as of August 2023. The median sales price has increased from $27m last August 2022, to $28m as of August 2023
Condos & Townhomes
Single-Family Homes
The average time spent on the market went down from 28 days last August 2022, to 26 days as of August 2023
Condos & Townhomes
The average time spent on the market went down from 22 days in August 2022, to 12 days as of August 2023
Single-Family Homes
The overbid percentage has increased from 95.8% last August 2022, to 973% a year later
Condos & Townhomes
The overbid percentage has decreased from 96.2% last August 2022, to 91% a year later.

There were 81 single-family homes for s providing 17 months of inventory Ther were 35 new listings and 29 homes sold median price of $3.9m. The median ove percentage was 98.5%, with an average days on the market.
There were 22 condo and townhome un for sale, providing 1.1 months of invento There were 6 new listings and 5 units so a median sale price of $1.6m. The media overbid percentage was 97.6%, with an average of 19 days on the market.

ings of Inventory
29 Sold Listings
$3.9M Median Sale Price .5% Sale vs List
19 Avg Days on Market
ced from MLS Listings, InfoSparks and Broker Metrics, includes ly homes, condos and townhomes in the California Area from uly 2023 (Pulled August 22, 2023) This may include preliminary vary from the time the data was gathered All data is deemed not guaranteed DRE# 01906450 Copyright KW Advisors ates | Burlingame | San Mateo 2023 Each office is independently erated
6
New Listings
5 Sold Listings
1.1
Months of Inventory
$1.6M Median Sale Price
97.6%
Median Sale vs List
19 Avg Days on Market


Single-Family Homes
The median sales price has remained at $1.6m since last August 2022. The median sales price has increased from $34m last August 2022, to $39m as of August 2023
Condos & Townhomes
Single-Family Homes
The average time spent on the market went down from 31 days last August 2022, to 19 days as of August 2023
Condos & Townhomes
The average time spent on the market went down from 34 days in August 2022, to 19 days as of August 2023
Single-Family Homes
The overbid percentage has decreased from 1008% last August 2022, to 985% a year later
Condos & Townhomes
The overbid percentage has decreased from 100.4% last August 2022, to 97.6% a year later.

There were 13 single-family homes for sale, providing 0 months of inventory There were 2 new listings, and 3 homes sold at a median price of $7.4m. The median overbid percentage was 87.9%, with an average of 0 days on the market.
There is no data for condos and townhomes this month.
2 New Listings
0 Months of Inventory
3 Sold Listings
$7.4M Median Sale Price
87.9%
Median Sale vs List
0 Avg Days on Market
The data, sourced from MLS Listings, InfoSparks and Broker Metrics, includes all single-family homes, condos and townhomes in the California Area from July 2022 to July 2023 (Pulled August 22, 2023) This may include preliminary data, and may vary from the time the data was gathered All data is deemed reliable but not guaranteed DRE# 01906450 Copyright KW Advisors Peninsula Estates | Burlingame | San Mateo 2023 Each office is independently owned and operated
No Data For This Month.
Single-Family Homes
The median sales price has increased from $34m last August 2022, to $74m as of August 2023
Condos & Townhomes
No Data For This Month.
Single-Family Homes
The average time spent on the market went down from 36 days last August 2022, to 0 days as of August 2023
Condos & Townhomes
No Data For This Month
Single-Family Homes
The overbid percentage has decreased from 95.3% last August 2022, to 879% a year later
Condos & Townhomes
No Data For This Month
There were 81 single-family homes for sale, providing 13 months of inventory There were 41 new listings and 34 homes sold at a median price of $2.1m. The median overbid percentage was 102.4%, averaging 38 days on the market.
There were 36 condo and townhome units for sale, providing 4.3 months of inventory. There were 6 new listings and 8 units sold at a median sale price of $1.2m. The median overbid percentage was 102.4%, with an average of 15 days on the market.

6
New Listings
8 Sold Listings
4.3 Months of Inventory
$1.2M Median Sale Price
102.4%
Median Sale vs List
15 Avg Days on Market

AUGUST 2022 - AUGUST 2023
Single-Family Homes
Last 12 months, year-over-year.
Condos & Townhomes
Last 12 months, year-over-year
Single-Family Homes
The median sales price has decreased from $1.4m last August 2022, to $1.2m as of August 2023. The median sales price has decreased from $22m last August 2022, to $21m as of August 2023
Condos & Townhomes
Single-Family Homes
The average time spent on the market went up from 25 days last August 2022, to 38 days as of August 2023
Condos & Townhomes
The average time spent on the market went up from 11 days in August 2022, to 15 days as of August 2023
Single-Family Homes
The overbid percentage has increased from 97.9% last August 2022, to 1024% a year later
Condos & Townhomes
The overbid percentage has increased from 99.6% last August 2022, to 102.4% a year later.

There were 33 single-family homes for sale, providing 19 months of inventory There were 41 new listings and 17 homes sold at a median price of $2.4m. The median overbid percentage was 104.7%, with an average of 26 days on the market.
There were 13 condo and townhome units for sale, providing 1.4 months of inventory. There were 11 new listings and 9 units sold at a median price of $1.2m. The median overbid percentage was 100.5%, with an average of 33 days on the market.

41 New Listings
1.9 Months of Inventory
17 Sold Listings
$2.4M Median Sale Price
104.7% Median Sale vs List
26 Avg Days on Market
The data, sourced from MLS Listings, InfoSparks and Broker Metrics, includes all single-family homes, condos and townhomes in the California Area from July 2022 to July 2023 (Pulled August 22, 2023) This may include preliminary data, and may vary from the time the data was gathered All data is deemed reliable but not guaranteed DRE# 01906450 Copyright KW Advisors Peninsula Estates | Burlingame | San Mateo 2023 Each office is independently owned and operated
11 New Listings

AUGUST 2022 - AUGUST 2023
Single-Family Homes
Last 12 months, year-over-year.
Condos & Townhomes
Last 12 months, year-over-year
Single-Family Homes
The median sales price has increased from $940k last August 2022, to $1.2m as of August 2023. The median sales price has increased from $21m last August 2022, to $24m as of August 2023
Condos & Townhomes
Single-Family Homes
The average time spent on the market went up from 23 days last August 2022, to 26 days as of August 2023
Condos & Townhomes
The average time spent on the market went up from 17 days in August 2022, to 33 days as of August 2023
Single-Family Homes
The overbid percentage has increased from 102% last August 2022, to 1047% a year later
Condos & Townhomes
The overbid percentage has increased from 98.3% last August 2022, to 100.5% a year later.

There were 54 single-famil providing 11 months of inv were 53 new listings, and 4 median price of $1.8m. The percentage was 105%, with days on the market.
There were 52 condo and t for sale, providing 1.5 mont
There were 28 new listings at a median price of $951k. overbid percentage was 99 average of 74 days on the m

47 Sold Listings Homes
$1.8M
Median Sale Price
17 Avg Days on Market
nfoSparks and Broker Metrics, includes ownhomes in the California Area from 22, 2023) This may include preliminary data was gathered All data is deemed # 01906450 Copyright KW Advisors Mateo 2023 Each office is independently
28 New Listings
1.5
Months of Inventory 99.1%
Median Sale vs List

Single-Family Homes
The median sales price has increased from $765k last August 2022, to $951k as of August 2023. The median sales price has decreased from $19m last August 2022, to $18m as of August 2023
Condos & Townhomes
Single-Family Homes
The average time spent on the market went down from 18 days last August 2022, to 17 days as of August 2023
Condos & Townhomes
The average time spent on the market went up from 56 days in August 2022, to 71 days as of August 2023
Single-Family Homes
The overbid percentage has increased from 100% last August 2022, to 105% a year later
Condos & Townhomes
The overbid percentage has decreased from 100.4% last August 2022, to 99.1% a year later.

There were 513 single-family homes for s providing 2 months of inventory. There w 376 new listings, and 143 homes sold at a median price of $1.6m. The median overb percentage was 1012%, with an average 27 days on the market.
There were 206 condo and townhome u for sale, providing 2.4 months of invento There were 121 new listings and 44 units at a median sale price of $995k. The med overbid percentage was 100%, with an average of 35 days on the market.

6 stings of Inventory
143 Sold Listings
$1.6M Median Sale Price
1.2% Sale vs List
27 Avg Days on Market
urced from MLS Listings, InfoSparks and Broker Metrics, includes mily homes, condos and townhomes in the California Area from July 2023 (Pulled August 22, 2023) This may include preliminary ay vary from the time the data was gathered All data is deemed t not guaranteed DRE# 01906450 Copyright KW Advisors states | Burlingame | San Mateo 2023 Each office is independently operated
121


AUGUST 2022 - AUGUST 2023
Single-Family Homes
Last 12 months, year-over-year.
Condos & Townhomes
Last 12 months, year-over-year
Single-Family Homes
The median sales price has increased from $900k last August 2022, to $995k as of August 2023. The median sales price has decreased from $18m last August 2022, to $16m as of August 2023
Condos & Townhomes
Single-Family Homes
The average time spent on the market went up from 25 days last August 2022, to 27 days as of August 2023
Condos & Townhomes
The average time spent on the market has remained at 35 days since August 2022
Single-Family Homes Back to Table of Contents
The overbid percentage has increased from 100% last August 2022, to 1012% a year later
Condos & Townhomes
The overbid percentage has remained at 100% since last August 2022.

There were 846 single-fam providing 1.5 months of inv were 795 new listings, and at a median price of $1.7m. overbid percentage was 10 average of 20 days on the m
398 condo and townhome sale, providing 1.6 months
There were 362 new listing sold at a median sale price median overbid percentag with an average of 18 days

8 gs
Market
Metrics, includes ornia Area from ude preliminary data is deemed t KW Advisors s independently
362 New Listings
1.6
95 Sold Listings

AUGUST 2022 - AUGUST 2023
Single-Family Homes
Last 12 months, year-over-year.
Condos & Townhomes
Last 12 months, year-over-year
Single-Family Homes
The median sales price has increased from $900k last August 2022, to $950k as of August 2023. The median sales price has increased from $16m last August 2022, to $17m as of August 2023
Condos & Townhomes
Single-Family Homes
The average time spent on the market went down from 25 days last August 2022, to 20 days as of August 2023
Condos & Townhomes
The average time spent on the market went down from 25 days last August 2022, to 18 days as of August 2023
Single-Family Homes
The overbid percentage has increased from 99.4% last August 2022, to 1037% a year later
Condos & Townhomes
The overbid percentage has increased from 100% last August 2022, to 102.3% a year later.

WWha data There provid 12 new media percen days o There this m
12 New Listings
3 Months of Inventory
5 Sold Listings
$12.5M Median Sale Price
93.4% Median Sale vs List
65 Avg Days on Market
The data, sourced from MLS Listings, InfoSparks and Broker Metrics, includes all single-family homes, condos and townhomes in the California Area from July 2022 to July 2023 (Pulled August 22, 2023) This may include preliminary data, and may vary from the time the data was gathered All data is deemed reliable but not guaranteed DRE# 01906450 Copyright KW Advisors Peninsula Estates | Burlingame | San Mateo 2023 Each office is independently owned and operated
No data for this month.
mes ar-over-year.
mes , y ar-over-year
Single-Family Homes
The median sales price has decreased from $12m last August 2022, to $11m as of August 2023
Condos & Townhomes
No data for this month.
Single-Family Homes
The average time spent on the market went down from 27 days last August 2022, to 15 days as of August 2023
Condos & Townhomes
No data for this month
Single-Family Homes
The overbid percentage has increased from 106.1% last August 2022, to 1092% a year later
Condos & Townhomes
No data for this month