That's the question you should be asking yourself.
Our market is incredibly diverse and rapidly changing. Values vary not just by neighborhood but by street. Your home isn't necessarily worth what your neighbors' home is. It's the current market that sets the value of your home
So, do you know what your home is worth in today's market?
Kind words from my client :
Contact me for a confidential, no obligation assessment of your home's value Dear Michael,
I am delighted with the results of your efforts in selling my house. I also appreciated your good nature and kindness towards the neighbors, vendors and me Cultural sensitivity is very important in any negotiation, particular for selling in a multicultural market. And I really appreciate that you are sensitive to a number of cultures.
Kevin F
MortgageRates:Past,Present, andPossibleFuture
If you’re hoping to buy a home this year, you’re probably paying close attention to mortgage rates. Since mortgage rates impact what you can afford when you take out a home loan – and affordability is a challenge today – it’s a good time to look at the big picture of where mortgage rates have been historically compared to where they are now. Beyond that, it’s important to understand their relationship with inflation for insights into where mortgage rates might go in the near future.
Giving Context to the Sticker Shock
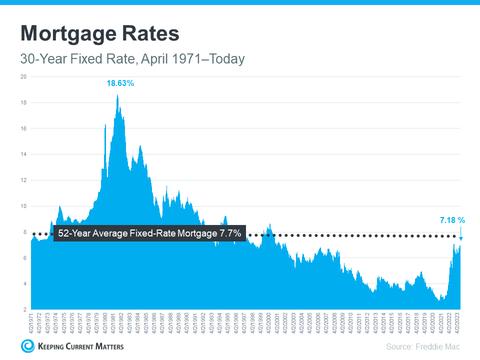
Freddie Mac has been tracking the 30-year fixed mortgage rate since April of 1971. Every week, they release the results of their Primary Mortgage Market Survey, which averages mortgage application data from lenders across the country (see graph below):
Looking at the right side of the graph, mortgage rates have increased significantly since the start of last year. But even with that rise, today’s rates are still below the 52-year average. While that historical perspective is good context, buyers have gotten used to mortgage rates between 3% and 5%, which is where they’ve been over the past 15 years.
That’s important because it explains why the recent jump in rates might have you feeling sticker shock even though they’re close to their long-term average. While many buyers have adjusted to the elevated rates over the past year, a slightly lower rate would be a welcome sight. To determine if that’s a realistic possibility, it’s important to look at inflation
Where Could Mortgage Rates Go in the Future?
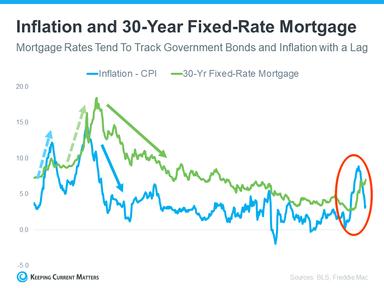
The Federal Reserve has been working hard to lower inflation since early 2022. That’s significant because, historically, there’s been a connection between inflation and mortgage rates (see graph below):
This graph shows a pretty reliable relationship between inflation and mortgage rates. Looking at the left side of the graph, each time inflation moves significantly (shown in blue), mortgage rates follow suit shortly after (shown in green).
The circled portion of the graph points out the most recent spike in inflation, with mortgage rates following closely behind. As inflation has moderated a bit this year, mortgage rates haven’t yet made a similar move. That means, if history is any guide, the market is waiting for mortgage rates to follow inflation and head back down. It’s impossible to accurately predict where mortgage rates will go for sure, but moderating inflation means mortgage rates going down in the near future would fit a well-established trend.
Source: Keeping Current Matters
SantaC County
What's in the San County data?
There were 846 single-fam providing 1.5 months of inv were 795 new listings, and at a median price of $1.7m. overbid percentage was 10 average of 20 days on the m
398 condo and townhome sale, providing 1.6 months
There were 362 new listing sold at a median sale price median overbid percentag with an average of 18 days
8 gs
M Price
Market
udes all singlerea above from ta, and may vary reliable but not 2023 Each office
362
1.6
SantaClaraCounty
AUGUST 2022 - AUGUST 2023
Single-Family Homes
Last 12 months, year-over-year.
Condos & Townhomes
Last 12 months, year-over-year
Median SalesPrice
Single-Family Homes
The median sales price has increased from $16m last August 2022, to $17m as of August 2023
Condos & Townhomes
The median sales price has increased from $900k last August 2022, to $950k as of August 2023.
AVGDays OntheMarket
Single-Family Homes
The average time spent on the market went down from 25 days last August 2022, to 20 days as of August 2023
Condos & Townhomes
The average time spent on the market went down from 25 days last August 2022, to 18 days as of August 2023
Overbids
Single-Family Homes
The overbid percentage has increased from 99.4% last August 2022, to 1037% a year later
Condos & Townhomes
The overbid percentage has increased from 100% last August 2022, to 102.3% a year later.
PaloAlto
What's in the Palo Alto data?
There were 81 single-family homes for s providing 17 months of inventory Ther were 35 new listings and 29 homes sold median price of $3.9m. The median ove percentage was 98.5%, with an average days on the market.
There were 22 condo and townhome un for sale, providing 1.1 months of invento
There were 6 new listings and 5 units so a median sale price of $1.6m. The media overbid percentage was 97.6%, with an average of 19 days on the market.
ings of Inventory
29 Sold Listings
$3.9M Median Sale Price .5% Sale vs List
19 Avg Days on Market
rced from InfoSparks and Broker Metrics, includes all singlecondos and townhomes in the California Area above from o August 2023 This may include preliminary data, and may vary e the data was gathered All data is deemed reliable but not RE# 01511642 Copyright KW Advisors Palo Alto 2023 Each office tly owned and operated
Median SalesPrice
The median sales price has remained at $1.6m since last August 2022. The median sales price has increased from $34m last August 2022, to $39m as of August 2023
& Townhomes
AVGDays OntheMarket
The average time spent on the market went down from 31 days last August 2022, to 19 days as of August 2023
The average time spent on the market went down from 34 days in August 2022, to 19 days as of August 2023
The overbid percentage has decreased from 1008% last August 2022, to 985% a year later
The overbid percentage has decreased from 100.4% last August 2022, to 97.6% a year later.
LosA
What's in data?
There were 43 s providing 07 m
were 20 new lis median price o percentage wa 30 days on the
There were 14 c for sale, providi
There were 8 ne a median sale p overbid percen average of 21 da
ngle-Family Homes
0 Listings
.7 ths of Inventory
20 Sold Listings
$4.3M Median Sale Price
8.4% ian Sale vs List
30 Avg Days on Market
ta, sourced from InfoSparks and Broker Metrics, includes all singlehomes, condos and townhomes in the California Area above from 2022 to August 2023 This may include preliminary data, and may vary he time the data was gathered All data is deemed reliable but not teed DRE# 01511642 Copyright KW Advisors Palo Alto 2023 Each office pendently owned and operated
8 New Listings 0.8 Months of Inventory
109.2%
Median Sale vs List
AUGUST 2023
Median SalesPrice
The median sales price has increased from $1.2m last August 2022, to $1.5m as of August 2023. The median sales price has increased from $38m last August 2022, to $43m as of August 2023
& Townhomes
AVGDays OntheMarket
The average time spent on the market went up from 23 days last August 2022, to 30 days as of August 2023
The average time spent on the market went down from 25 days in August 2022, to 21 days as of August 2023
Overbids
The overbid percentage has increased from 97.8% last August 2022, to 984% a year later
The overbid percentage has increased from 97.3% last August 2022, to 109.2% a year later.
to Table of Contents
LosAltosH
What's in the Los Altos
data?
There were 27 single-family homes providing 4 months of inventory Th 9 new listings and 6 homes sold at price of $5.7m. The median overbid percentage was 107.4%, with an ave 20 days on the market.
There is no data for condos and tow this month.
CONDO
Condo & Townhomes
No Data For This Month.
LosAltosHills
AUGUST 2022 - AUGUST 2023
Single-Family Homes
Last 12 months, year-over-year.
Condos & Townhomes
Last 12 months, year-over-year
The median sales price has increased from $43m last August 2022, to $57m as of August 2023
AVGDays
The average time spent on the market went down from 55 days last August 2022, to 20 days as of August 2023
Moun View
What's in th View data?
There were 42 sing providing 0.5 mon were 29 new listing median price of $2 percentage was 10 days on the marke
There were 48 con for sale, providing There were 28 new at a median sale p overbid percentag average of 25 days
6 Listings mes
2.6M an Sale Price
Days on Market
Metrics, includes all singleCalifornia Area above from liminary data, and may vary is deemed reliable but not rs Palo Alto 2023 Each office
28 New Listings
30 Sold Listings
Median SalesPrice
Homes
The median sales price has remained at $1.3m since August 2022. The median sales price has decreased from $28m last August 2022, to $26m as of August 2023
Overbids
The overbid percentage has increased from 99.2% last August 2022, to 1063% a year later Back to Table of Contents Condos & Townhomes
The overbid percentage has increased from 97.5% last August 2022, to 101.6% a year later.
AVGDays OntheMarket
The average time spent on the market went down from 18 days last August 2022, to 11 days as of August 2023
The average time spent on the market went down from 28 days in August 2022, to 25 days as of August 2023
Sunnyvale
What's in the Sunnyvale data?
There were 61 single-family homes for sale, providing 03 months of inventory There were 43 new listings, and 43 homes sold at a median price of $2.1m. The median overbid percentage was 107.4%, with an average of 15 days on the market.
There were 38 condo and townhome units for sale, providing 0.7 months of inventory. There were 25 new listings and 22 units sold at a median sale price of $1.2m. The median overbid percentage was 100.8%, with an average of 20 days on the market.
Single-Family Homes
43 New Listings
0.3 Months of Inventory
43 Sold Listings
$2.1M Median Sale Price
107.4% Median Sale vs List
15 Avg Days on Market
The data, sourced from InfoSparks and Broker Metrics, includes all singlefamily homes, condos and townhomes in the California Area above from August 2022 to August 2023 This may include preliminary data, and may vary from the time the data was gathered All data is deemed reliable but not guaranteed DRE# 01511642 Copyright KW Advisors Palo Alto 2023 Each office is independently owned and operated
25
Sunnyvale
AUGUST 2022 - AUGUST 2023
Single-Family Homes
Last 12 months, year-over-year.
Condos & Townhomes
Last 12 months, year-over-year
Median SalesPrice
The median sales price has increased from $1.4m last August 2022, to $1.2m as of August 2023. The median sales price has increased from $2m last August 2022, to $21m as of August 2023
& Townhomes
AVGDays
The average time spent on the market went down from 16 days last August 2022, to 15 days as of August 2023
The average time spent on the market went down from 27 days in August 2022, to 20 days as of August 2023
Overbids
The overbid percentage has increased from 97.2% last August 2022, to 1074% a year later
The overbid percentage has increased from 99.1% last August 2022, to 100.8% a year later.
SantaClara City
What's in the Santa Clara City data?
There were 63 single-family homes for sale, providing 0.7 months of inventory. There were 45 new listings and 34 homes sold at a median price of $1.9M. The median overbid percentage was 1105%, with an average of 10 days on the market.
39 condo and townhome units were for sale, providing 1.6 months of inventory. There were 28 new listings and 17 units sold at a median sale price of $915k. The median overbid percentage was 104%, with an average of 12 days on the market.
Single-Family Homes
45 New Listings
0.7 Months of Inventory
34 Sold Listings
$1.9M Median Sale Price
110.5% Median Sale vs List
10 Avg Days on Market
The data, sourced from InfoSparks and Broker Metrics, includes all singlefamily homes, condos and townhomes in the California Area above from August 2022 to August 2023 This may include preliminary data, and may vary from the time the data was gathered All data is deemed reliable but not guaranteed DRE# 01511642 Copyright KW Advisors Palo Alto 2023 Each office is independently owned and operated
28
SantaClaraCity
AUGUST 2022 - AUGUST 2023
Single-Family Homes
Last 12 months, year-over-year.
Condos & Townhomes
Last 12 months, year-over-year
Median SalesPrice
The median sales price has increased from $895k last August 2022, to $915k as of August 2023. The median sales price has increased from $16m last August 2022, to $19m as of August 2023
& Townhomes
The average time spent on the market went down from 22 days last August 2022, to 10 days as of August 2023
The average time spent on the market went down from 27 days in August 2022, to 12 days as of August 2023
Overbids
The overbid percentage has increased from 98.9% last August 2022, to 1105% a year later
The overbid percentage has increased from 100% last August 2022, to 104.0% a year later.
Cupertino
What's in the Cupertino data?
There were 63 single-family homes for sale, providing 09 months of inventory There were 26 new listings and 22 homes sold at a median price of $3.1m. The median overbid percentage was 110.9%, with an average of 15 days on the market.
There were 13 condo and townhome units for sale, providing 1.5 months of inventory. There were 10 new listings and 2 units sold at a median price of $1.2m. The median overbid percentage was 101.5%, with an average of 9 days on the market.
Single-Family Homes
26 New Listings
0.9 Months of Inventory
22 Sold Listings
$3.1M Median Sale Price
110.9% Median Sale vs List
15 Avg Days on Market
The data, sourced from InfoSparks and Broker Metrics, includes all singlefamily homes, condos and townhomes in the California Area above from August 2022 to August 2023 This may include preliminary data, and may vary from the time the data was gathered All data is deemed reliable but not guaranteed DRE# 01511642 Copyright KW Advisors Palo Alto 2023 Each office is independently owned and operated
10 New Listings
2 Sold Listings
1.5 Months of Inventory $1.2M Median Sale Price 101.5% Median Sale vs List 9 Avg Days on Market
Cupertino
AUGUST 2022 - AUGUST 2023
Single-Family Homes
Last 12 months, year-over-year.
Condos & Townhomes
Last 12 months, year-over-year
Median SalesPrice
The median sales price has decreased from $1.3m last August 2022, to $1.2m as of August 2023. The median sales price has increased from $27m last August 2022, to $31m as of August 2023
& Townhomes
AVGDays OntheMarket
The average time spent on the market went down from 19 days last August 2022, to 15 days as of August 2023
The average time spent on the market went down from 17 days in August 2022, to 9 days as of August 2023
Overbids
The overbid percentage has increased from 99% last August 2022, to 1109% a year later
The overbid percentage has increased from 100.4% last August 2022, to 101.5% a year later.
LosGatos
What's in the Los Gatos data?
There were 127 single-family homes for sale, providing 31 months of inventory There were 62 new listings and 34 homes sold at a median price of $2.2m. The median overbid percentage was 96.7%, with an average of 23 days on the market.
There were 30 condo and townhome units for sale, providing 2.3 months of inventory. There were 18 new listings and 11 units sold at a median price of $1.5m. The median overbid percentage was 103.3%, with an average of 20 days on the market.
Single-Family Homes
62 New Listings
3.1 Months of Inventory
34 Sold Listings
$2.2M Median Sale Price
96.7% Median Sale vs List
23 Avg Days on Market
The data, sourced from InfoSparks and Broker Metrics, includes all singlefamily homes, condos and townhomes in the California Area above from August 2022 to August 2023 This may include preliminary data, and may vary from the time the data was gathered All data is deemed reliable but not guaranteed DRE# 01511642 Copyright KW Advisors Palo Alto 2023 Each office is independently owned and operated
2.3
Median SalesPrice
The median sales price has increased from $1.1m last August 2022, to $1.5m as of August 2023. The median sales price has increased from $21m last August 2022, to $22m as of August 2023
& Townhomes
AVGDays OntheMarket
The average time spent on the market went down from 32 days last August 2022, to 23 days as of August 2023
The average time spent on the market went down from 51 days in August 2022, to 20 days as of August 2023
Overbids
The overbid percentage has increased from 93.2% last August 2022, to 967% a year later
The overbid percentage has increased from 95.7% last August 2022, to 103.3% a year later.
Campbell
What's in the Campbell
data?
There were 46 single-family homes for sale, providing 1 month of inventory There were 25 new listings and 29 homes sold at a median price of $1.9m. The median overbid percentage was 105.3%, with an average of 12 days on the market.
There were 20 condo and townhome units for sale, providing 0.7 months of inventory. There were 9 new listings and 11 units sold at a median price of $913k. The median overbid percentage was 102%, with an average of 15 days on the market.
Single-Family Homes
25 New Listings
1 Month of Inventory
29 Sold Listings
$1.9M Median Sale Price
105.3% Median Sale vs List
12 Avg Days on Market
The data, sourced from InfoSparks and Broker Metrics, includes all singlefamily homes, condos and townhomes in the California Area above from August 2022 to August 2023 This may include preliminary data, and may vary from the time the data was gathered All data is deemed reliable but not guaranteed DRE# 01511642 Copyright KW Advisors Palo Alto 2023 Each office is independently owned and operated
AUGUST 2022 - AUGUST 2023
Single-Family Homes
Last 12 months, year-over-year.
Condos & Townhomes
Last 12 months, year-over-year
Median SalesPrice
The median sales price has increased from $905k last August 2022, to $913k as of August 2023. The median sales price has increased from $17m last August 2022, to $19m as of August 2023
& Townhomes
The average time spent on the market went down from 27 days last August 2022, to 12 days as of August 2023
The average time spent on the market went up from 14 days in August 2022, to 15 days as of August 2023
Overbids
The overbid percentage has increased from 100.4% last August 2022, to 1053% a year later
The overbid percentage has increased from 973% last August 2022, to 1020% a year later
ly Homes
320 Sold Listings
$1.6M
Median Sale Price %
20 Avg Days on Market
rks and Broker Metrics, includes all singlenhomes in the California Area above from s may include preliminary data, and may vary thered All data is deemed reliable but not yright KW Advisors Palo Alto 2023 Each office rated
170
SanJose
AUGUST 2022 - AUGUST 2023
Single-Family Homes
Last 12 months, year-over-year.
Condos & Townhomes
Last 12 months, year-over-year
The median sales price has increased from $751k last August 2022, to $855k as of August 2023. The median sales price has increased from $14m last August 2022, to $16m as of August 2023
Condos & Townhomes
AVGDays OntheMarket
The average time spent on the market went up from 29 days last August 2022, to 20 days as of August 2023
The average time spent on the market went up from 28 days in August 2022, to 20 days as of August 2023
Overbids
The overbid percentage has increased from 96.3% last August 2022, to 1044% a year later
The overbid percentage has increased from 97.5% last August 2022, to 103.2% a year later.
SanMateo County
What's in the San Mateo County data?
There were 513 single-family homes for s providing 2 months of inventory. There w 376 new listings, and 143 homes sold at a median price of $1.6m. The median overb percentage was 1012%, with an average 27 days on the market.
There were 206 condo and townhome u for sale, providing 2.4 months of invento
There were 121 new listings and 44 units at a median sale price of $995k. The med overbid percentage was 100%, with an average of 35 days on the market.
le-Family Homes
6 stings of Inventory
143 Sold Listings
$1.6M Median Sale Price
1.2% Sale vs List
27 Avg Days on Market
ourced from InfoSparks and Broker Metrics, includes all singlees, condos and townhomes in the California Area above from 2 to August 2023 This may include preliminary data, and may vary me the data was gathered All data is deemed reliable but not DRE# 01511642 Copyright KW Advisors Palo Alto 2023 Each office ently owned and operated
SanMateo
AUGUST 2022 - AUGUST 2023
Single-Family Homes
Last 12 months, year-over-year.
Condos & Townhomes
Last 12 months, year-over-year
Median SalesPrice
Homes
The median sales price has increased from $900k last August 2022, to $995k as of August 2023. The median sales price has decreased from $18m last August 2022, to $16m as of August 2023
& Townhomes
The average time spent on the market went up from 25 days last August 2022, to 27 days as of August 2023
The average time spent on the market has remained at 35 days since August 2022
Overbids
The overbid percentage has increased from 100% last August 2022, to 1012% a year later
The overbid percentage has remained at 100% since last August 2022.
SanMa
What's in the San data?
There were 54 single-famil providing 11 months of inv were 53 new listings, and 4 median price of $1.8m. The percentage was 105%, with days on the market.
There were 52 condo and t for sale, providing 1.5 mont
There were 28 new listings at a median price of $951k. overbid percentage was 99 average of 74 days on the m
47 Sold Listings Homes
$1.8M
Median Sale Price
17 Avg Days on Market
Inc, includes all single-family homes, ornia Area above from August 2022 to nary data, and may vary from the time med reliable but not guaranteed DRE# Alto 2023 Each office is independently
28 New Listings
1.5
Months of Inventory 99.1%
Median Sale vs List
Median SalesPrice
The median sales price has increased from $765k last August 2022, to $951k as of August 2023. The median sales price has decreased from $19m last August 2022, to $18m as of August 2023
& Townhomes
The average time spent on the market went down from 18 days last August 2022, to 17 days as of August 2023
The average time spent on the market went up from 56 days in August 2022, to 71 days as of August 2023
Overbids
The overbid percentage has increased from 100% last August 2022, to 105% a year later
The overbid percentage has decreased from 100.4% last August 2022, to 99.1% a year later.
Belmont
What's in the Belmont data?
There were 7 single-family homes for sale, providing 06 months of inventory There were 11 new listings and 11 homes sold at a median price of $2.1m. The median overbid percentage was 109.2%, with an average of 18 days on the market.
There were 3 condo and townhome units for sale, providing 1.5 months of inventory.
There were 4 new listings and 2 units sold at a median price of $1.2m. The median overbid percentage was 107.6%, with an average of 28 days on the market.
11 Sold Listings Homes
$2.1M
Median Sale Price
18 Avg Days on Market
nc, includes all single-family homes, ia Area above from August 2022 to ry data, and may vary from the time ed reliable but not guaranteed DRE# to 2023 Each office is independently
4 New Listings
2 Sold Listings
1.5 Months of Inventory $1.2M Median Sale Price 107.6% Median Sale vs List 28 Avg Days on Market
LISTINGS FOR SALE SOLD LISTINGS
Median SalesPrice
The median sales price has increased from $564k last August 2022, to $1.2m as of August 2023. The median sales price has increased from $2150m last August 2022, to $2180m as of August 2023
& Townhomes
AVGDays
The average time spent on the market went down from 20 days last August 2022, to 18 days as of August 2023
The average time spent on the market went up from 25 days in August 2022, to 28 days as of August 2023
Overbids
The overbid percentage has increased from 99.9% last August 2022, to 1092% a year later
The overbid percentage has increased from 98.9% last August 2022, to 107.6% a year later.
SanCarlos
What's in the San Carlos data?
There were 33 single-family homes for sale, providing 19 months of inventory There were 41 new listings and 17 homes sold at a median price of $2.4m. The median overbid percentage was 104.7%, with an average of 26 days on the market.
There were 13 condo and townhome units for sale, providing 1.4 months of inventory. There were 11 new listings and 9 units sold at a median price of $1.2m. The median overbid percentage was 100.5%, with an average of 33 days on the market.
Single-Family Homes
41 New Listings
1.9 Months of Inventory
17 Sold Listings
$2.4M Median Sale Price
104.7% Median Sale vs List
26 Avg Days on Market
The data, sourced from MLS Listings Inc, includes all single-family homes, condos and townhomes in the California Area above from August 2022 to August 2023 This may include preliminary data, and may vary from the time the data was gathered All data is deemed reliable but not guaranteed DRE# 01511642 Copyright KW Advisors Palo Alto 2023 Each office is independently owned and operated
SanCarlos
AUGUST 2022 - AUGUST 2023
Single-Family Homes
Last 12 months, year-over-year.
Condos & Townhomes
Last 12 months, year-over-year
Median SalesPrice
The median sales price has increased from $940k last August 2022, to $1.2m as of August 2023. The median sales price has increased from $21m last August 2022, to $24m as of August 2023
& Townhomes
AVGDays OntheMarket
The average time spent on the market went up from 23 days last August 2022, to 26 days as of August 2023
The average time spent on the market went up from 17 days in August 2022, to 33 days as of August 2023
The overbid percentage has increased from 102% last August 2022, to 1047% a year later
The overbid percentage has increased from 98.3% last August 2022, to 100.5% a year later.
MWha data There provid were 3 media percen days o There for sal There at a m overbi averag
36 New Listings
Homes
2.1 Months of Inventory
24 Sold Listings
$2.8M Median Sale Price
97.3% Median Sale vs List
26 Avg Days on Market
The data, sourced from InfoSparks and Broker Metrics, includes all singlefamily homes, condos and townhomes in the California Area above from August 2022 to August 2023 This may include preliminary data, and may vary from the time the data was gathered All data is deemed reliable but not guaranteed DRE# 01511642 Copyright KW Advisors Palo Alto 2023 Each office is independently owned and operated
GUST 2023
Median SalesPrice
The median sales price has increased from $920k last August 2022, to $950k as of August 2023. The median sales price has increased from $27m last August 2022, to $28m as of August 2023
& Townhomes
AVGDays
The average time spent on the market went down from 28 days last August 2022, to 26 days as of August 2023
The average time spent on the market went down from 22 days in August 2022, to 12 days as of August 2023
The overbid percentage has increased from 95.8% last August 2022, to 973% a year later
The overbid percentage has decreased from 96.2% last August 2022, to 91% a year later.
Atherton
What's in the Atherton data?
There were 31 single-family homes for sale, providing 15 months of inventory There were 6 new listings and 12 homes sold at a median price of $8.2m. The median overbid percentage was 89.1%, with an average of 88 days on the market.
There were 0 condo and townhome units for sale, providing 0 months of inventory. There were 0 new listings, and 1 unit sold at a median sale price of $1.5m. The median overbid percentage was 0%, with an average of 0 days on the market.
Single-Family Homes
6 New Listings
1.5 Months of Inventory
6 Sold Listings
$8.2M Median Sale Price
89.1% Median Sale vs List
88 Avg Days on Market
The data, sourced from InfoSparks and Broker Metrics, includes all singlefamily homes, condos and townhomes in the California Area above from August 2022 to August 2023 This may include preliminary data, and may vary from the time the data was gathered All data is deemed reliable but not guaranteed DRE# 01511642 Copyright KW Advisors Palo Alto 2023 Each office is independently owned and operated
0 New Listings 0 Months of Inventory $1.5M Median Sale Price
Median Sale vs List
1 Sold Listing
herton
2022 - AUGUST 2023
amily Homes onths, year-over-year.
& Townhomes onths, year-over-year
The median sales price has increased from $0 last August 2022, to $1.5m as of August 2023. The median sales price has increased from $7m last August 2022, to $82m as of August 2023
& Townhomes
AVGDays OntheMarket
The average time spent on the market went up from 59 days last August 2022, to 88 days as of August 2023
The average time spent on the market has remained at 0 days since August 2022
The overbid percentage has decreased from 91.3% last August 2022, to 891% a year later
The overbid percentage has increased from 0% last August 2022, to 100.1% a year later.
Woodside
What's in the Woodside data?
There were 41 single-family homes for sale, providing 3 months of inventory There were 12 new listings and 5 homes sold at a median price of $12.5m. The median overbid percentage was 93.4%, with an average of 64 days on the market.
There is no data for condos and townhomes this month.
Single-Family Homes
12 New Listings
3 Months of Inventory
5 Sold Listings
$12.5M Median Sale Price
93.4% Median Sale vs List
64 Avg Days on Market
The data, sourced from InfoSparks and Broker Metrics, includes all singlefamily homes, condos and townhomes in the California Area above from August 2022 to August 2023 This may include preliminary data, and may vary from the time the data was gathered All data is deemed reliable but not guaranteed DRE# 01511642 Copyright KW Advisors Palo Alto 2023 Each office is independently owned and operated
Median SalesPrice
The median sales price has increased from $51m last August 2022, to $125m as of August 2023
AVGDays
The average time spent on the market went up from 63 days last August 2022, to 64 days as of August 2023
PortolaValley
What's in the Portola Valley data?
There were 13 single-family homes for sale, providing 0 months of inventory There were 2 new listings, and 3 homes sold at a median price of $7.4m. The median overbid percentage was 87.9%, with an average of 0 days on the market.
There is no data for condos and townhomes this month.
Single-Family Homes
2 New Listings
0 Months of Inventory
3 Sold Listings
$7.4M Median Sale Price
87.9% Median Sale vs List
0 Avg Days on Market
The data, sourced from InfoSparks and Broker Metrics, includes all singlefamily homes, condos and townhomes in the California Area above from August 2022 to August 2023 This may include preliminary data, and may vary from the time the data was gathered All data is deemed reliable but not guaranteed DRE# 01511642 Copyright KW Advisors Palo Alto 2023 Each office is independently owned and operated
CONDO
Condo & Townhomes
No Data For This Month.
No Data For This Month. The median sales price has increased from $34m last August 2022, to $74m as of August 2023
AVGDays
The average time spent on the market went down from 36 days last August 2022, to 0 days as of August 2023
No Data For This Month
PaloAlto East
What's in the East Palo Alto data?
There were 15 single-family homes for sale, providing 0.9 months of inventory. There were 8 new listings, and 6 homes sold at a median price of $1m. The median overbid percentage was 1047%, with an average of 19 days on the market.
There were 2 condo and townhome units for sale, providing 1 month of inventory. There was 1 new listing and 2 units sold at a median sale price of $820k. The median overbid percentage was 97.2%, with an average of 1 day on the market.
Single-Family Homes
8 New Listings
0.9 Months of Inventory
6 Sold Listings
$1M Median Sale Price
104.7% Median Sale vs List
19 Avg Days on Market
The data, sourced from InfoSparks and Broker Metrics, includes all singlefamily homes, condos and townhomes in the California Area above from August 2022 to August 2023 This may include preliminary data, and may vary from the time the data was gathered All data is deemed reliable but not guaranteed DRE# 01511642 Copyright KW Advisors Palo Alto 2023 Each office is independently owned and operated
1
1
2 Sold Listings
Median SalesPrice
The median sales price has decreased from $890k last August 2022, to $820k as of August 2023. The median sales price has increased from $972k last August 2022, to $1m as of August 2023
Condos & Townhomes
AVGDays OntheMarket
The average time spent on the market went down from 33 days last August 2022, to 19 days as of August 2023
The average time spent on the market went up from 0 days in August 2022, to 1 day as of August 2023
Overbids
Homes
The overbid percentage has decreased from 100.1% last August 2022, to 97.2% a year later. The overbid percentage has increased from 104.2% last August 2022, to 1047% a year later
SantaC County
What's in the San County data?
There were 400 single-fam providing 1.9 months of inv were 161 new listings, and 1 a median price of $1.2m. Th percentage was 983%, wit days on the market.
There were 106 condo and for sale, providing 1.7 mont
There were 51 new listings at a median sale price of $8 overbid percentage was 99 average of 21 days on the m
122 Sold Listings Homes
$1.2M
Median Sale Price
37 Avg Days on Market
nd Broker Metrics, includes all singlemes in the California Area above from include preliminary data, and may vary d All data is deemed reliable but not KW Advisors Palo Alto 2023 Each office
51 New Listings
1.7
Months of Inventory 99.8%
Median Sale vs List
The median sales price has remained at $805k since last August 2022. The median sales price has decreased from $13m last August 2022, to $12m as of August 2023
& Townhomes
AVGDays OntheMarket
The average time spent on the market went up from 30 days last August 2022, to 37 days as of August 2023
The average time spent on the market went up from 18 days in August 2022, to 21 days as of August 2023
Overbids
The overbid percentage has increased from 95.5% last August 2022, to 983% a year later
The overbid percentage has increased from 97.3% last August 2022, to 99.8% a year later.
to Table of Contents
SanFrancisco County
What's in the San Francisco County
data?
There were 334 single-family homes for sale, providing 2.1 months of inventory. There were 253 new listings and 120 homes sold at a median price of $1.6m. The median overbid percentage was 1039%, with an average of 35 days on the market.
There were 588 condo and townhome units for sale, providing 3.6 months of inventory. There were 265 new listings and 136 units sold at a median price of $1.1m. The median overbid percentage was 99%, with an average of 57 days on the market.
Single-Family Homes
253 New Listings
2.1 Months of Inventory
120 Sold Listings
$1.6M Median Sale Price
103.9% Median Sale vs List
35 Avg Days on Market
The data, sourced from InfoSparks and Broker Metrics, includes all singlefamily homes, condos and townhomes in the California Area above from August 2022 to August 2023 This may include preliminary data, and may vary from the time the data was gathered All data is deemed reliable but not guaranteed DRE# 01511642 Copyright KW Advisors Palo Alto 2023 Each office is independently owned and operated
SanFranciscoCounty
AUGUST 2022 - AUGUST 2023
Single-Family Homes
Last 12 months, year-over-year.
Condos & Townhomes
Last 12 months, year-over-year
Median SalesPrice
Homes
The median sales price has increased from $1m last August 2022, to $1.1m as of August 2023. The median sales price has remained at $16m since last August 2022
& Townhomes
AVGDays OntheMarket
The average time spent on the market went up from 26 days last August 2022, to 35 days as of August 2023
The average time spent on the market went up from 50 days in August 2022, to 57 days as of August 2023
The overbid percentage has decreased from 1067% last August 2022, to 1039% a year later
The overbid percentage has decreased from 100% last August 2022, to 99.2% a year later.
to Table of Contents
Single-Family Homes
796 New Listings
1.1 Months of Inventory
657 Sold Listings
$850K Median Sale Price
100.9%
Median Sale vs List
22 Avg Days on Market
The data, sourced from InfoSparks and Broker Metrics, includes all singlefamily homes, condos and townhomes in the California Area above from August 2022 to August 2023 This may include preliminary data, and may vary from the time the data was gathered All data is deemed reliable but not guaranteed DRE# 01511642 Copyright KW Advisors Palo Alto 2023 Each office is independently owned and operated
Median SalesPrice
The median sales price has increased from $583k last August 2022, to $600 as of August 2023. The median sales price has increased from $849k last August 2022, to $850k as of August 2023
& Townhomes
The average time spent on the market went down from 30 days last August 2022, to 22 days as of August 2023
The average time spent on the market went up from 26 days in August 2022, to 30 days as of August 2023
The overbid percentage has increased from 97.1% last August 2022, to 1009% a year later
The overbid percentage has increased from 99.2% last August 2022, to 101.6% a year later.
WalnutCreek
What's in the Walnut Creek data?
There were 80 single-family homes for sale, providing 1.1 months of inventory. There were 31 new listings, and 26 homes sold at a median price of $14m The median overbid percentage was 100.7%, with an average of 26 days on the market.
There were 164 condo and townhome units for sale, providing 1 month of inventory. 86 new listings were added and 80 units sold at a median price of $665k. The median overbid percentage was 1028%, with an average of 23 days on the market.
26 Sold Listings Homes
$1.4M
Median Sale Price
26 Avg Days on Market
and Broker Metrics, includes all singlemes in the California Area above from y include preliminary data, and may vary ed All data is deemed reliable but not t KW Advisors Palo Alto 2023 Each office d
AUGUST 2022 - AUGUST 2023
Single-Family Homes
Last 12 months, year-over-year.
Condos & Townhomes
Last 12 months, year-over-year
Median SalesPrice
The median sales price has increased from $623k last August 2022, to $665k as of August 2023. The median sales price has decreased from $15m last August 2022, to $14m as of August 2023
Condos & Townhomes
The average time spent on the market went up from 23 days last August 2022, to 26 days as of August 2023
The average time spent on the market went down from 25 days in August 2022, to 23 days as of August 2023
Overbids
The overbid percentage has increased from 96.8% last August 2022, to 1007% a year later
The overbid percentage has increased from 101.6% last August 2022, to 102.8% a year later.
Lafayette
What's in the Lafayette data?
There were 56 single-family homes for sale, providing 0.9 months of inventory. There were 17 new listings and 22 homes sold at a median price of $17m The median overbid percentage was 100.1%, with an average of 31 days on the market.
There were 9 condo and townhome units for sale, providing 3 months of inventory. There were 2 new listings and 5 units sold at a median price of $941k. The median overbid percentage was 985%, with an average of 95 days on the market.
Single-Family Homes
17 New Listings
0.9 Months of Inventory
22 Sold Listings
$1.7M Median Sale Price
100.1% Median Sale vs List
31 Avg Days on Market
The data, sourced from InfoSparks and Broker Metrics, includes all singlefamily homes, condos and townhomes in the California Area above from August 2022 to August 2023 This may include preliminary data, and may vary from the time the data was gathered All data is deemed reliable but not guaranteed DRE# 01511642 Copyright KW Advisors Palo Alto 2023 Each office is independently owned and operated
Median SalesPrice
The median sales price has increased from $825k last August 2022, to $941k as of August 2023. The median sales price has decreased from $18m last August 2022, to $17m as of August 2023
& Townhomes
The overbid percentage has increased from 95.7% last August 2022, to 1001% a year later
he overbid percentage has decreased from 98.9% last August 2022, to 98.5% a year later.
The average time spent on the market went up from 23 days last August 2022, to 31 days as of August 2023
The average time spent on market went up from 27 days in August 2022, to 95 days as of August 2023
Orinda
What's in the Orinda data?
There were 50 single-family homes for sale, providing 1.3 months of inventory. There were 23 new listings and 11 homes sold at a median price of $2.2m. The median overbid percentage was 99.4%, with an average of 23 days on the market.
There were 1 condo and townhome unit for sale, providing months of inventory. There were 0 new listings and 0 units sold, with an average of 8 days on the market.
Single-Family Homes
23 New Listings
1.3 Months of Inventory
11 Sold Listings
$2.2M Median Sale Price
99.4% Median Sale vs List
23 Avg Days on Market
The data, sourced from InfoSparks and Broker Metrics, includes all singlefamily homes, condos and townhomes in the California Area above from August 2022 to August 2023 This may include preliminary data, and may vary from the time the data was gathered All data is deemed reliable but not guaranteed DRE# 01511642 Copyright KW Advisors Palo Alto 2023 Each office is independently owned and operated
Median SalesPrice
The median sales price has decreased from $223m last August 2022, to $22m as of August 2023
& Townhomes
The median sales price has decreased from $1.6m last August 2022, to $0 as of August 2023.
AVGDays OntheMarket
The average time spent on the market went up from 21 days last August 2022, to 23 days as of August 2023
The average time spent on the market went down from 60 days in August 2022, to 8 days as of August 2023
The overbid percentage has increased from 97.6% last August 2022, to 994% a year later
The overbid percentage has decreased from 93.5% last August 2022, to 0% a year later.