



August 2023 Copyright by KW Advisors 2023
PaloAlto area
PaloAlto
Jump to Palo Alto Report
RedwoodCity
Jump to Redwood City
Report
PortolaValley
Jump to Portola Valley Report
MenloPark
Jump to Menlo Report
Atherton
Jump to Atherton Report
LosAltos
Jump to Los Altos Report
SanJose
Jump to San Jose Report
MountainView
Jump to Mountain View
SanMateoCounty
Jump to San Mateo County
SantaClaraCounty
Jump to Santa Clara County
MontereyCounty
Jump to Monterey County Report
SantaCruzCounty
Jump to Santa Cruz County Report
EastPaloAlto

Jump to East Palo Alto Report
Sunnyvale
Jump to Sunnyvale Report
SantaClaraCity
Jump to Santa Clara City Report
Saratoga
Jump to Saratoga Report
Berkeley
Jump to Berkeley Report
Lafayette
Jump to Lafayette Report
WalnutCreek
Jump to Walnut Creek Report



Icanhelp... Contact me for a confidential, no obligation assessment of your home's value.
the question you should be asking yourself
market is incredibly diverse and rapidly changing. Values vary not just by neighborhood but by street Your home isn't necessarily worth what your neighbors' home is It's the current market that sets the value of your home. So, do you know what your home is worth in today's market? What’syourhome reallyworthin today’smarket? 650.564.HOME MTeymouri@kwcom MTRealEstateGroup.com MT Real Estate Group MichaelTeymouri
That's
Our
Sellers:Don’tLetTheseTwo ThingsHoldYouBack
Many homeowners thinking about selling have two key things holding them back. That’s feeling locked in by today’s higher mortgage rates and worrying they won’t be able to find something to buy while supply is so low. Let’s dive into each challenge and give you some helpful advice on how to overcome these obstacles.
Challenge #1: The Reluctance to Take on a Higher Mortgage Rate

According to the Federal Housing Finance Agency (FHFA), the average interest rate for current homeowners with mortgages is less than 4% (see graph below):
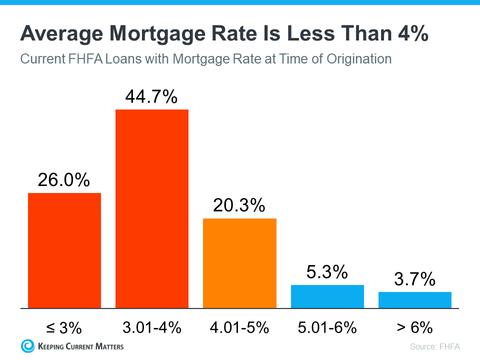
But today, the typical 30-year fixed mortgage rate offered to buyers is closer to 7%. As a result, many homeowners are opting to stay put instead of moving to another home with a higher borrowing cost. This is a situation known as the mortgage rate lock-in effect.
The Advice: Waiting May Not Pay Off
While experts project mortgage rates will gradually fall this year as inflation cools, that doesn’t necessarily mean you should wait to sell. Mortgage rates are notoriously hard to predict. And right now, home prices are back on the rise. If you move now, you’ll at least beat rising home prices when you buy your next home. And, if experts are right and rates fall, you can always refinance later if that happens.
Challenge #2: The Fear of Not Finding Something to Buy
When so many homeowners are reluctant to take on a higher rate, fewer homes are going to come onto the market. That’s going to keep inventory low. As Lawrence Yun, Chief Economist at the National Association of Realtors (NAR), explains:
“Inventory will remain tight in the coming months and even for the next couple of years. Some homeowners are unwilling to trade up or trade down after locking in historically-low mortgage rates in recent years.”
Even though you know this limited housing supply helps your house stand out to eager buyers, it may also make you feel hesitant to sell because you don’t want to struggle to find something to purchase.
The Advice: Broaden Your Search
If fear that you won’t be able to find your next home is the primary thing holding you back, remember to consider all your options. Looking at all housing types, including condos, townhouses, and even newly built homes, can help give you more to choose from. Plus, if you’re able to work fully remote or hybrid, you may be able to consider areas you hadn’t previously searched. If you can look further from your place of work, you may have more affordable options.
Source: Keeping Current Matters

PaloA
What's in th data?
In July, Palo Alto ha providing the mark inventory. There we total of 3 homes so was $3m, and the m 98.3%. The average 38 days.
There are 17 condo sale, providing the of inventory. There and 1 condo sold, w $2.3m and a media average time on th

d Listings

8 Days on Market
Metrics, includes all singlealifornia Area above from July data, and may vary from the reliable but not guaranteed Alto 2023 Each office is
3M ian Sale Price mes
Con
New List
7. Months of Invent
108.9% Median Sale vs

023 Mar2023 Apr2023 May2023 June2023 Jul2023 2023 Mar2023 Apr2023 May2023 June2023 Jul2023 . , y y OLD
LISTINGS
Median SalesPrice
Single-Family Homes
The median sales price has decreased from $32m last July 2022, to $3m as of July 2023
Condos & Townhomes
The median sales price has increased from $1.7m last July 2022, to $2.3m as of July 2023.
AVGDays OntheMarket
Single-Family Homes
The average time spent on the market went up from 20 days last July 2022, to 38 days as of July 2023
Condos & Townhomes
The average time spent on the market went up from 26 days in July 2022, to 170 days as of July 2023
Overbids
Single-Family Homes
The overbid percentage has increased from 96% last July 2022, to 983% a year later
Condos & Townhomes
The overbid percentage has increased from 98.6% last July 2022, to 108.9% a year later.
Back to Table of Contents Jul2022Aug2022Sep2022Oct2022Nov2022Dec2022 Jan2023Feb2023Mar2023Apr2023May2023June2023 Jul2023 $4,000,000 $3,000,000 $2,000,000 $1,000,000 $0 Jul2022Aug2022Sep2022Oct2022Nov2022Dec2022 Jan2023Feb2023Mar2023Apr2023May2023June2023 Jul2023 200 150 100 50 0 Jul2022Aug2022Sep2022Oct2022Nov2022Dec2022 Jan2023Feb2023Mar2023Apr2023May2023June2023 Jul2023 125% 100% 75% 50% 25% 0%

Redwood City
What's in the Redwood City data?
In July, Redwood City had 6 single-family homes sold, with a median sale price of $1.9m. The median overbid was 105.1%, and the average time on the market was 33 days. In terms of inventory, 48 homes for sale provided the market with 5.6 months of inventory.
For condos, there was a total of 1 unit sold. The median sale price to $1.2m, and the median overbid to 112.7%. The average time on the market fell to 24 days. There are currently 18 condos for sale, providing the market with 3.5 months of inventory.


CONDO
Condo & Townhomes
5 New Listings

1 Sold Listing
3.5 Months of Inventory
$1.2M Median Sale Price
112.7% Median Sale vs List
24 Avg Days on Market
Single-Family Homes
Last 12 months, year-over-year.
Condos & Townhomes
Last 12 months, year-over-year

Jul2022 Aug2022 Sep2022 Oct2022 Nov2022 Dec2022 Jan2023 Feb2023 Mar2023 Apr2023 May2023 June2023 Jul2023 200 150 100 50 0 Jul2022 Aug2022 Sep2022 Oct2022 Nov2022 Dec2022 Jan2023 Feb2023 Mar2023 Apr2023 May2023 June2023 Jul2023 60 40 20 0 JULY 2022 - JULY 2023
RedwoodCity
LISTINGS FOR SALE SOLD LISTINGS
Median SalesPrice
Single-Family Homes
The median sales price has decreased from $2m last July 2022, to $19m as of July 2023
Condos & Townhomes
The median sales price has increased from $825k last July 2022, to $1.2m as of July 2023.
AVGDays OntheMarket
Single-Family Homes
The average time spent on the market went up from 26 days last July 2022, to 33 days as of July 2023
Condos & Townhomes
The average time spent on the market went down from 46 days in July 2022, to 24 days as of July 2023
Overbids
Single-Family Homes The overbid percentage has increased from 101.4% last July 2022, to 1051% a year later
Condos & Townhomes
The overbid percentage has increased from 97.2% last July 2022, to 112.7% a year later.
Back to Table of Contents Jul2022Aug2022Sep2022Oct2022Nov2022Dec2022 Jan2023Feb2023Mar2023Apr2023May2023June2023 Jul2023 $2,500,000 $2,000,000 $1,500,000 $1,000,000 $500,000 $0 Jul2022Aug2022Sep2022Oct2022Nov2022Dec2022 Jan2023Feb2023Mar2023Apr2023May2023June2023 Jul2023 60 40 20 0 Jul2022Aug2022Sep2022Oct2022Nov2022Dec2022 Jan2023Feb2023Mar2023Apr2023May2023June2023 Jul2023 125% 100% 75% 50% 25% 0%

PortolaV
What's in the Portola data?
In July, there were 15 single-fam sale, with 0 new listings and 2 ho providing the market with 13 m inventory. The median sale price with an overbid of 93.7%. The ave spent on the market was 52 day
There is no data for condos and this month.

omes
2 Sold Listings
$3.7M edian Sale Price

52 vg Days on Market
oker Metrics, includes all singlee California Area above from July nary data, and may vary from the med reliable but not guaranteed Palo Alto 2023 Each office is
CONDO

Condo & Townhomes
No Data For This Month
PortolaValley
Single-Family Homes
Last 12 months, year-over-year.
No Data For This Month.
Condos & Townhomes
Last 12 months, year-over-year

Jul2022 Aug2022 Sep2022 Oct2022 Nov2022 Dec2022 Jan2023 Feb2023 Mar2023 Apr2023 May2023 June2023 Jul2023 40 30 20 10 0 100 75 50 25 0
JULY 2022 - JULY 2023
FOR SALE SOLD LISTINGS
LISTINGS
Median SalesPrice
Single-Family
Homes The median sales price has increased from $33m last July 2022, to $37m as of July 2023
Condos & Townhomes No Data For This Month.
Overbids
Single-Family
Homes The overbid percentage has decreased from 96.5% last July 2022, to 937% a year later
Condos & Townhomes No Data For This Month
AVGDays OntheMarket
Single-Family
Homes The average time spent on the market went up from 10 days last July 2022, to 52 days as of July 2023
Condos & Townhomes No Data For This Month
Back to Table of Contents Jul2022Aug2022Sep2022Oct2022Nov2022Dec2022 Jan2023Feb2023Mar2023Apr2023May2023June2023 Jul2023 $7,500,000 $5,000,000 $2,500,000 $0 Jul2022Aug2022Sep2022Oct2022Nov2022Dec2022 Jan2023Feb2023Mar2023Apr2023May2023June2023 Jul2023 150 100 50 0 Jul2022Aug2022Sep2022Oct2022Nov2022Dec2022 Jan2023Feb2023Mar2023Apr2023May2023June2023 Jul2023 125% 100% 75% 50% 25% 0%

MenloPark
What's in the Menlo Park data?
The real estate market in Menlo Park saw 6 new listings, and 4 homes were sold for a median price of $2m. This provided the market with 12 months of inventory. The median overbid was 99.6%, and the average time spent on the market was 42 days.
The condo market had 2 new listings, and 1 unit was sold for a median price of $1.6m, providing the market with 15 months of inventory. There was a median overbid of 103.3%. The average time spent on the market was 30 days.

SFH Single-Family Homes

6 New Listings
4 Sold Listings
12 Months of Inventory
$2M Median Sale Price
99.6% Median Sale vs List
42 Avg Days on Market
The data, sourced from InfoSparks and Broker Metrics, includes all singlefamily homes, condos and townhomes in the California Area above from July 2022 to July 2023 This may include preliminary data, and may vary from the time the data was gathered All data is deemed reliable but not guaranteed DRE# 01511642 Copyright KW Advisors Palo Alto 2023 Each office is independently owned and operated
2 New Listings
1 Sold Listing
15 Months of Inventory
$1.6M Median Sale Price
103.3% Median Sale vs List
30 Avg Days on Market

Condo &
CONDO
Townhomes
Single-Family Homes
Last 12 months, year-over-year.
Condos & Townhomes
Last 12 months, year-over-year

MenloPark Jul2022 Aug2022 Sep2022 Oct2022 Nov2022 Dec2022 Jan2023 Feb2023 Mar2023 Apr2023 May2023 June2023 Jul2023 125 100 75 50 25 0 Jul2022 Aug2022 Sep2022 Oct2022 Nov2022 Dec2022 Jan2023 Feb2023 Mar2023 Apr2023 May2023 June2023 Jul2023 40 30 20 10 0 JULY 2022
JULY 2023
-
LISTINGS FOR SALE SOLD LISTINGS
Median SalesPrice
Single-Family Homes
The median sales price has decreased from $39m last July 2022, to $2m as of July 2023
Condos & Townhomes
The median sales price has increased from $1.5m last July 2022, to $1.6m as of July 2023.
AVGDays OntheMarket
Single-Family
Overbids
Single-Family Homes The overbid percentage has decreased from 101.2% last July 2022, to 996% a year later
Condos & Townhomes The overbid percentage has decreased from 103.9% last July 2022, to 103.3% a year later.
Homes
The average time spent on the market went up from 21 days last July 2022, to 42 days as of July 2023
Condos & Townhomes
The average time spent on the market went up from 13 days in July 2022, to 30 days as of July 2023
Back to Table of Contents Jul2022Aug2022Sep2022Oct2022Nov2022Dec2022 Jan2023Feb2023Mar2023Apr2023May2023June2023 Jul2023 $5,000,000 $4,000,000 $3,000,000 $2,000,000 $1,000,000 $0 Jul2022Aug2022Sep2022Oct2022Nov2022Dec2022 Jan2023Feb2023Mar2023Apr2023May2023June2023 Jul2023 200 150 100 50 0 Jul2022Aug2022Sep2022Oct2022Nov2022Dec2022 Jan2023Feb2023Mar2023Apr2023May2023June2023 Jul2023 125% 100% 75% 50% 25% 0%
Ath
What's i data?
In July, Athe for sale, prov months of in added, 1 hom $2.7m, and a average tim days. There is no d this month.
1 Sold Listing

$2.7M Median Sale Price
116 Avg Days on Market
and Broker Metrics, includes all singlemes in the California Area above from July preliminary data, and may vary from the a is deemed reliable but not guaranteed dvisors Palo Alto 2023 Each office is
y Homes
CONDO
Condo & Townhomes
No Data For This Month.
Single-Family Homes

Last 12 months, year-over-year.
Condos & Townhomes
Last 12 months, year-over-year
Atherton Jul2022 Aug2022 Sep2022 Oct2022 Nov2022 Dec2022 Jan2023 Feb2023 Mar2023 Apr2023 May2023 June2023 Jul2023 60 40 20 0 Jul2022 Aug2022 Sep2022 Oct2022 Nov2022 Dec2022 Jan2023 Feb2023 Mar2023 Apr2023 May2023 June2023 Jul2023 2 15 1 05 0 JULY 2022 - JULY 2023
LISTINGS FOR SALE SOLD LISTINGS
Median SalesPrice
Single-Family
Homes The median sales price has decreased from $76m last July 2022, to $27m as of July 2023
Condos & Townhomes No data for this month.
Overbids
Single-Family
Homes The overbid percentage has decreased from 97.6% last July 2022, to 913% a year later
Condos & Townhomes No data for this month
AVGDays OntheMarket
Single-Family
Homes The average time spent on the market went up from 26 days last July 2022, to 116 days as of July 2023
Condos & Townhomes No data for this month
Back to
of Contents Jul2022Aug2022Sep2022Oct2022Nov2022Dec2022 Jan2023Feb2023Mar2023Apr2023May2023June2023 Jul2023 $20,000,000 $15,000,000 $10,000,000 $5,000,000 $0 Jul2022Aug2022Sep2022Oct2022Nov2022Dec2022 Jan2023Feb2023Mar2023Apr2023May2023June2023 Jul2023 125 100 75 50 25 0 Jul2022Aug2022Sep2022Oct2022Nov2022Dec2022 Jan2023Feb2023Mar2023Apr2023May2023June2023 Jul2023 100% 75% 50% 25% 0%
Table

LosAl
What's in the data?
In July, Los Altos had for sale, providing th months of inventory listings added, and 8 median sale price fo was $3.6m, with a m The average time on days.
The condo market in months of inventory sale. In July, 3 new li 2 condos were sold. for condos was $1.5m overbid percentage time spent on the m
mes
8 d Listings

3.6M ian Sale Price
8 Days on Market
Metrics, includes all singlealifornia Area above from July data, and may vary from the reliable but not guaranteed Alto 2023 Each office is
3 New Listings

CONDO
& Townhomes
2 Sold Listings
8 Months of Inventory
$1.5M Median Sale Price
98.5% Median Sale vs List
1 Avg Day on Market
Condo
Single-Family Homes

Last 12 months, year-over-year.
Condos & Townhomes
Last 12 months, year-over-year
LosAltos Jul2022 Aug2022 Sep2022 Oct2022 Nov2022 Dec2022 Jan2023 Feb2023 Mar2023 Apr2023 May2023 June2023 Jul2023 125 100 75 50 25 0 Jul2022 Aug2022 Sep2022 Oct2022 Nov2022 Dec2022 Jan2023 Feb2023 Mar2023 Apr2023 May2023 June2023 Jul2023 25 20 15 10 5 0 JULY 2022 - JULY 2023
LISTINGS FOR SALE SOLD LISTINGS
Median SalesPrice
Single-Family Homes
The median sales price has decreased from $38m last July 2022, to $36m as of July 2023
Condos & Townhomes
The median sales price has decreased from $2.7m last July 2022, to $1.5m as of July 2023.
AVGDays OntheMarket
Single-Family
Overbids
Single-Family Homes The overbid percentage has increased from 100.1% last July 2022, to 1049% a year later
Condos & Townhomes
The overbid percentage has decreased from 100.5% last July 2022, to 98.5% a year later.
Homes
The average time spent on the market went down from 26 days in July 2022, to 18 days as of July 2023
Condos & Townhomes
The average time spent on the market went down from 37 days in July 2022, to 1 day as of July 2023
Back to Table of Contents Jul2022Aug2022Sep2022Oct2022Nov2022Dec2022 Jan2023Feb2023Mar2023Apr2023May2023June2023 Jul2023 $5,000,000 $4,000,000 $3,000,000 $2,000,000 $1,000,000 $0 Jul2022Aug2022Sep2022Oct2022Nov2022Dec2022 Jan2023Feb2023Mar2023Apr2023May2023June2023 Jul2023 200 150 100 50 0 Jul2022Aug2022Sep2022Oct2022Nov2022Dec2022 Jan2023Feb2023Mar2023Apr2023May2023June2023 Jul2023 125% 100% 75% 50% 25% 0%

SanJo
What's in th data?
In July, San Jose ha homes for sale, pro only 5.4 months of new listings, and 44 median sale price f was $1.6m, and the 105.7%. The average single-family home
There are 164 condo providing the mark inventory. There we condos sold. The m condos was $1m, an was 103.2%. The ave for condos was 24 d

mes
44 d Listings
1.6M ian Sale Price

6 Days on Market
Metrics, includes all singlealifornia Area above from July data, and may vary from the reliable but not guaranteed Alto 2023 Each office is
33 New Listings

CONDO
Townhomes
19 Sold Listings
4.3 Months of Inventory
$1M Median Sale Price
103.2% Median Sale vs List
24 Avg Days on Market
Condo &
Single-Family Homes

Last 12 months, year-over-year.
Condos & Townhomes
Last 12 months, year-over-year
SanJose Jul2022 Aug2022 Sep2022 Oct2022 Nov2022 Dec2022 Jan2023 Feb2023 Mar2023 Apr2023 May2023 June2023 Jul2023 1500 1000 500 0 Jul2022 Aug2022 Sep2022 Oct2022 Nov2022 Dec2022 Jan2023 Feb2023 Mar2023 Apr2023 May2023 June2023 Jul2023 750 500 250 0 JULY 2022 - JULY 2023
LISTINGS FOR SALE SOLD LISTINGS
Median SalesPrice
Single-Family
Homes
The median sales price has increased from $14m last July 2022, to $16m as of July 2023
Condos & Townhomes
The median sales price has increased from $841k last July 2022, to $1m as of July 2023
AVGDays OntheMarket
Single-Family
Overbids
Single-Family Homes
The overbid percentage has increased from 985% last July 2022, to 1057% a year later
Condos & Townhomes
The overbid percentage has increased from 100.8% last July 2022, to 103.2% a year later.
Homes
The average time spent on the market went down from 24 days in July 2022, to 16 days as of July 2023.
Condos & Townhomes
The average time spent on the market went down from 27 days in July 2022, to 24 days as of July 2023
Back to Table of Contents Jul2022Aug2022Sep2022Oct2022Nov2022Dec2022 Jan2023Feb2023Mar2023Apr2023May2023June2023 Jul2023 $2,000,000 $1,500,000 $1,000,000 $500,000 $0 Jul2022Aug2022Sep2022Oct2022Nov2022Dec2022 Jan2023Feb2023Mar2023Apr2023May2023June2023 Jul2023 50 40 30 20 10 0 Jul2022Aug2022Sep2022Oct2022Nov2022Dec2022 Jan2023Feb2023Mar2023Apr2023May2023June2023 Jul2023 125% 100% 75% 50% 25% 0%

Mounta View
What's in the Mo View data?
In July, Mountain View had sale, providing the market inventory. There were 7 ne and just 1 home was sold w price of $2.4m. The media 106.7%, and the average tim was 18 days.
There were 32 condo and for sale, providing the mar months of inventory. 10 ne added, and a total of 2 con with a median sale price o median overbid was 101.1% time on the market was 27

1 Sold Listing
$2.4M Median Sale Price
18 Avg Days on Market
and Broker Metrics, includes all singlees in the California Area above from July preliminary data, and may vary from the is deemed reliable but not guaranteed visors Palo Alto 2023 Each office is

Homes
CONDO

Condo & Townhomes
10 New Listings
2 Sold Listings
4.3 Months of Inventory
$1.6M Median Sale Price
101.1% Median Sale vs List
27 Avg Days on Market


, y y
Median SalesPrice
Single-Family Homes
The median sales price has decreased from $25m last July 2022, to $24m as of July 2023
Condos & Townhomes
The median sales price has increased from $1.2m last July 2022, to $1.6m as of July 2023.
AVGDays OntheMarket
Single-Family
Overbids
Single-Family Homes The overbid percentage has increased from 100.5% last July 2022, to 1067% a year later
Condos & Townhomes The overbid percentage has decreased from 101.6% last July 2022, to 101.1% a year later.
Homes
The average time spent on the market went down from 26 days in July 2022, to 18 days as of July 2023
Condos & Townhomes
The average time spent on the market went down from 34 days in July 2022, to 27 days as of July 2023
Back to Table of Contents Jul2022Aug2022Sep2022Oct2022Nov2022Dec2022 Jan2023Feb2023Mar2023Apr2023May2023June2023 Jul2023 $3,000,000 $2,000,000 $1,000,000 $0 Jul2022Aug2022Sep2022Oct2022Nov2022Dec2022 Jan2023Feb2023Mar2023Apr2023May2023June2023 Jul2023 75 50 25 0 Jul2022Aug2022Sep2022Oct2022Nov2022Dec2022 Jan2023Feb2023Mar2023Apr2023May2023June2023 Jul2023 125% 100% 75% 50% 25% 0%

Sa Co
What
Coun In July, S homes f months listings a median was $1.8 family h on the m
There w for sale, the mar sale, and median was 100 was 33 d

rket
all singlefrom July from the uaranteed office is

M e
CONDO
Condo & Townhomes

117 New Listings
88 Sold Listings
1.9 Months of Inventory
$923K Median Sale Price
100.8% Median Sale vs List
33 Avg Days on Market


eo 2 Jan2023 Feb2023 Mar2023 Apr2023 May2023 Jun2023 Jul2023 22 Jan2023 Feb2023 Mar2023 Apr2023 May2023 Jun2023 Jul2023 er-year. , y er-year SOLD LISTINGS
Median SalesPrice
Single-Family
Homes
The median sales price has remained at $18m since July 2022
Condos & Townhomes
The median sales price has increased from $897k last July 2022, to $923k as of July 2023.
AVGDays OntheMarket
Single-Family
Overbids
Single-Family
Homes
The overbid percentage has increased from 101.3% last July 2022, to 1018% a year later
Condos & Townhomes
The overbid percentage has increased from 100.2% last July 2022, to 100.8% a year later.
Homes
The average time spent on the market has remained at 20 days since July 2022
Condos & Townhomes
The average time spent on the market went up from 26 days in July 2022, to 33 days as of July 2023
Back to Table of Contents Jul2022Aug2022Sep2022Oct2022Nov2022Dec2022 Jan2023Feb2023Mar2023Apr2023May2023Jun2023 Jul2023 $2,000,000 $1,500,000 $1,000,000 $500,000 $0 Jul2022Aug2022Sep2022Oct2022Nov2022Dec2022 Jan2023Feb2023Mar2023Apr2023May2023 Jun2023 Jul2023 60 40 20 0 Jul2022Aug2022Sep2022Oct2022Nov2022Dec2022 Jan2023Feb2023Mar2023Apr2023May2023 Jun2023 Jul2023 125% 100% 75% 50% 25% 0%
SantaClara County
What's in the Santa Clara County data?
Santa Clara had 620 single-family homes for sale in July, providing the market with 1 month of inventory. In July, there were 688 new listings and a total of 606 homes sold, with a median sale price of $1.7m. The median overbid was 104.4%, and the average time on the market was 17 days.
There are currently a total of 290 condo and townhouse units for sale, providing the market with 1.1 months of inventory. There were 359 new listings for sale and a total of 314 units sold with a median sale price of $961k. The median overbid was 101.7%, and the average time on the market was 24 days.
mily Homes

606 Sold Listings
tory
4% List
$1.7M Median Sale Price
17 Avg Days on Market
InfoSparks and Broker Metrics, includes all singled townhomes in the California Area above from July ay include preliminary data, and may vary from the red All data is deemed reliable but not guaranteed ht KW Advisors Palo Alto 2023 Each office is d operated

Co
35 New Li Months of Inv 101.7 Median Sale


raCounty Feb2023 Mar2023 Apr2023 May2023 Jun2023 Jul2023 Feb2023 Mar2023 Apr2023 May2023 Jun2023 Jul2023 ar. , y y ar SOLD LISTINGS
Median SalesPrice
Single-Family
Homes
The median sales price has remained at $17m since July 2022
Condos & Townhomes
The median sales price has increased from $950k last July 2022, to $961k as of July 2023.
AVGDays OntheMarket
Single-Family
Overbids
Single-Family
Homes The overbid percentage has increased from 100% last July 2022, to 1044% a year later
Condos & Townhomes
The overbid percentage has increased from 100.3% last July 2022, to 101.7% a year later.
Homes
The average time spent on the market went down from 22 days last July 2022, to 17 days as of July 2023
Condos & Townhomes
The average time spent on the market went up from 21 days in July 2022, to 24 days as of July 2023
Back to Table of Contents Jul2022Aug2022Sep2022Oct2022Nov2022Dec2022 Jan2023Feb2023Mar2023Apr2023May2023Jun2023 Jul2023 $2,000,000 $1,500,000 $1,000,000 $500,000 $0 Jul2022Aug2022Sep2022Oct2022Nov2022Dec2022 Jan2023Feb2023Mar2023Apr2023May2023 Jun2023 Jul2023 40 30 20 10 0 Jul2022Aug2022Sep2022Oct2022Nov2022Dec2022 Jan2023Feb2023Mar2023Apr2023May2023 Jun2023 Jul2023 125% 100% 75% 50% 25% 0%

Monterey County
What's in the Monterey County data?
In July, Monterey had 370 single-family homes on the market, providing 6 months of inventory. There were 57 new listings and 22 homes sold, with a median sale price of $912k and a median overbid of 95.9%, and the average time on the market decreased to 56 days.
There were 41 condo and townhome units available for sale, providing the market with 3.1 months of inventory. There were 5 new listings and 4 condos sold, with a median sale price of $1.1m and a median overbid of 98.4%. The average time on the market remained relatively stable at 45 days.

SFH Single-Family Homes
57 New Listings
22 Sold Listings
6 Months of Inventory
$912K Median Sale Price
95.9% Median Sale vs List

56 Avg Days on Market
The data, sourced from InfoSparks and Broker Metrics, includes all singlefamily homes, condos and townhomes in the California Area above from July 2022 to July 2023 This may include preliminary data, and may vary from the time the data was gathered All data is deemed reliable but not guaranteed DRE# 01511642 Copyright KW Advisors Palo Alto 2023 Each office is independently owned and operated
5 New Listings
CONDO
& Townhomes
4 Sold Listings
3.1 Months of Inventory
$1.1M Median Sale Price
98.4% Median Sale vs List
45 Avg Days on Market

Condo

, y y
Median SalesPrice
Single-Family
Homes
The median sales price has decreased from $916k last July 2022, to $912k as of July 2023
Condos & Townhomes
The median sales price has increased from $750k last July 2022, to $1.1m as of July 2023.
AVGDays OntheMarket
Single-Family
Overbids
Single-Family
Homes
The overbid percentage has decreased from 98.1% last July 2022, to 959% a year later
Condos & Townhomes
The overbid percentage has decreased from 100.1% last July 2022, to 98.4% a year later.
Homes
The average time spent on the market went up from 34 days last July 2022, to 56 days as of July 2023
Condos & Townhomes
The average time spent on the market went up from 22 days in July 2022, to 45 days as of July 2023
Back to Table of Contents Jul2022Aug2022Sep2022Oct2022Nov2022Dec2022 Jan2023Feb2023Mar2023Apr2023May2023June2023 Jul2023 $1,250,000 $1,000,000 $750,000 $500,000 $250,000 $0 Jul2022Aug2022Sep2022Oct2022Nov2022Dec2022 Jan2023Feb2023Mar2023Apr2023May2023June2023 Jul2023 75 50 25 0 Jul2022Aug2022Sep2022Oct2022Nov2022Dec2022 Jan2023Feb2023Mar2023Apr2023May2023June2023 Jul2023 125% 100% 75% 50% 25% 0%

SantaCruz County
What's in the Santa Cruz County data?
In July, Santa Cruz had 303 single-family homes for sale, providing the market with 8.9 months of inventory. There were 37 new listings added, and a total of 21 homes sold. The median sale price was $1.2m, and the median overbid was 96.4%. The average time on the market was 40 days.
There were 48 condo and townhome units for sale, providing 3.6 months of inventory for the market. There were 7 new listings for sale, and a total of 4 condos were sold. The median sale price for condos was $930k, with a median overbid of 99.4%. The average time on the market was 16 days.

SFH Single-Family Homes
37 New Listings

21 Sold Listings
8.9 Months of Inventory
$1.2M Median Sale Price
96.4% Median Sale vs List
40 Avg Days on Market
The data, sourced from InfoSparks and Broker Metrics, includes all singlefamily homes, condos and townhomes in the California Area above from July 2022 to July 2023 This may include preliminary data, and may vary from the time the data was gathered All data is deemed reliable but not guaranteed DRE# 01511642 Copyright KW Advisors Palo Alto 2023 Each office is independently owned and operated
7 New Listings
16
CONDO Condo & Townhomes
3.6 Months of Inventory $930K Median Sale Price 99.4% Median Sale vs List
Avg Days on Market 4 Sold Listings
Last
Last 12 months, year-over-year

SantaCruzCounty Jul2022 Aug2022 Sep2022 Oct2022 Nov2022 Dec2022 Jan2023 Feb2023 Mar2023 Apr2023 May2023 June2023 Jul2023 600 400 200 0 Jul2022 Aug2022 Sep2022 Oct2022 Nov2022 Dec2022 Jan2023 Feb2023 Mar2023 Apr2023 May2023 June2023 Jul2023 150 100 50 0 JULY 2022 - JULY 2023
Homes
Single-Family
12
year-over-year.
& Townhomes
months,
Condos
LISTINGS FOR SALE SOLD LISTINGS
Median SalesPrice
Single-Family Homes
The median sales price has remained at $12m since July 2022
Condos & Townhomes
The median sales price has increased from $745k last July 2022, to $930k as of July 2023.
AVGDays OntheMarket
Single-Family
Overbids
Single-Family
Homes
The overbid percentage has decreased from 99.1% last July 2022, to 964% a year later
Condos & Townhomes
The overbid percentage has decreased from 104.4% last July 2022, to 99.4% a year later.
Homes
The average time spent on the market went up from 32 days last July 2022, to 40 days as of July 2023
Condos & Townhomes
The average time spent on the market went down from 27 days in July 2022, to 16 days as of July 2023
Back to Table of Contents Jul2022Aug2022Sep2022Oct2022Nov2022Dec2022 Jan2023Feb2023Mar2023Apr2023May2023June2023 Jul2023 $1,500,000 $1,000,000 $500,000 $0 Jul2022Aug2022Sep2022Oct2022Nov2022Dec2022 Jan2023Feb2023Mar2023Apr2023May2023June2023 Jul2023 80 60 40 20 0 Jul2022Aug2022Sep2022Oct2022Nov2022Dec2022 Jan2023Feb2023Mar2023Apr2023May2023June2023 Jul2023 125% 100% 75% 50% 25% 0%

East PaloAlto
What's in the East Palo Alto data?
In July, East Palo Alto had 9 single-family homes for sale, providing the market with 8 months of inventory. 2 new listings were added, and 1 home was sold for a median of $1.6m. The average time on the market was 11 days, with a median overbid of 103.2%.
There were only 3 condo and townhouse units for sale, providing the market with no inventory, and no new listings were added or sold in July. The average time spent on the market was 0 days.

SFH Single-Family Homes

2 New Listings
1 Sold Listing
8 Months of Inventory
$1.6M Median Sale Price
103.2% Median Sale vs List
11 Avg Days on Market
The data, sourced from InfoSparks and Broker Metrics, includes all singlefamily homes, condos and townhomes in the California Area above from July 2022 to July 2023 This may include preliminary data, and may vary from the time the data was gathered All data is deemed reliable but not guaranteed DRE# 01511642 Copyright KW Advisors Palo Alto 2023 Each office is independently owned and operated
CONDO
Condo & Townhomes
No Data For This Month.
Single-Family Homes
Last 12 months, year-over-year.
Condos & Townhomes
Last 12 months, year-over-year

Jul2022 Aug2022 Sep2022 Oct2022 Nov2022 Dec2022 Jan2023 Feb2023 Mar2023 Apr2023 May2023 June2023 Jul2023 40 30 20 10 0 Jul2022 Aug2022 Sep2022 Oct2022 Nov2022 Dec2022 Jan2023 Feb2023 Mar2023 Apr2023 May2023 June2023 Jul2023 8 6 4 2 0 JULY 2022 - JULY 2023
EastPaloAlto
LISTINGS FOR SALE SOLD LISTINGS
Median SalesPrice
Single-Family
Homes
The median sales price has increased from $12m last July 2022, to $16m as of July 2023
Condos & Townhomes
The median sales price has decreased from $947k last July 2022, to $0 as of July 2023.
AVGDays OntheMarket
Single-Family
Overbids
Single-Family
Homes
The overbid percentage has increased from 94.5% last July 2022, to 1032% a year later
Condos & Townhomes
The overbid percentage has decreased from 106.7% last July 2022, to 0% a year later.
Homes
The average time spent on the market went down from 29 days last July 2022, to 11 days as of July 2023
Condos & Townhomes
The average time spent on the market went down from 12 days in July 2022, to 0 days as of July 2023
Back to Table of Contents Jul2022Aug2022Sep2022Oct2022Nov2022Dec2022 Jan2023Feb2023Mar2023Apr2023May2023June2023 Jul2023 $2,000,000 $1,500,000 $1,000,000 $500,000 $0 Jul2022Aug2022Sep2022Oct2022Nov2022Dec2022 Jan2023Feb2023Mar2023Apr2023May2023June2023 Jul2023 100 75 50 25 0 Jul2022Aug2022Sep2022Oct2022Nov2022Dec2022 Jan2023Feb2023Mar2023Apr2023May2023June2023 Jul2023 125% 100% 75% 50% 25% 0%
Sunnyvale
What's in the Sunnyvale data?
Sunnyvale had 39 single-family homes for sale in July, with 13 new listings, resulting in 4.6 months of inventory. The median sale price was $2.2m, and 10 homes were sold with a median overbid of 108.8% and an average of 14 days spent on the market.
There were 16 condo and townhouse units for sale, with 5 new listings, providing the market with 6.5 months of inventory. The median sale price for condos was $1.5m, and 5 condos were sold with a median overbid percentage of 103.7%. The average time spent on the market was 25 days.

SFH Single-Family Homes

13 New Listings
10 Sold Listings
4.6 Months of Inventory
$2.2M Median Sale Price
108.8% Median Sale vs List
14 Avg Days on Market
The data, sourced from InfoSparks and Broker Metrics, includes all singlefamily homes, condos and townhomes in the California Area above from July 2022 to July 2023 This may include preliminary data, and may vary from the time the data was gathered All data is deemed reliable but not guaranteed DRE# 01511642 Copyright KW Advisors Palo Alto 2023 Each office is independently owned and operated
CONDO

Condo & Townhomes
5 New Listings
5 Sold Listings
6.5 Months of Inventory
$1.5M Median Sale Price
103.7% Median Sale vs List
25 Avg Days on Market
2 months,

unnyvale Aug2022 Sep2022 Oct2022 Nov2022 Dec2022 Jan2023 Feb2023 Mar2023 Apr2023 May2023 June2023 Jul2023 Aug2022 Sep2022 Oct2022 Nov2022 Dec2022 Jan2023 Feb2023 Mar2023 Apr2023 May2023 June2023 Jul2023 2022 - JULY 2023
e-Family Homes
& Townhomes
2 months, year-over-year. os
year-over-year TINGS FOR LE SOLD LISTINGS
Median SalesPrice
Single-Family Homes The median sales price has decreased from $23m last July 2022, to $22m as of July 2023
Condos & Townhomes
The median sales price has increased from $1.2m last July 2022, to $1.5m as of July 2023.
AVGDays OntheMarket
Single-Family Homes
The average time spent on the market went down from 28 days in July 2022, to 14 days as of July 2023
Condos & Townhomes
The average time spent on the market went down from 34 days in July 2022, to 25 days as of July 2023
Overbids
Single-Family Homes The overbid percentage has increased from 101% last July 2022, to 1088% a year later
Condos & Townhomes The overbid percentage has increased from 101.5% last July 2022, to 103.7% a year later.
Back to Table of Contents Jul2022Aug2022Sep2022Oct2022Nov2022Dec2022 Jan2023Feb2023Mar2023Apr2023May2023June2023 Jul2023 $2,500,000 $2,000,000 $1,500,000 $1,000,000 $500,000 $0 Jul2022Aug2022Sep2022Oct2022Nov2022Dec2022 Jan2023Feb2023Mar2023Apr2023May2023June2023 Jul2023 40 30 20 10 0 Jul2022Aug2022Sep2022Oct2022Nov2022Dec2022 Jan2023Feb2023Mar2023Apr2023May2023June2023 Jul2023 125% 100% 75% 50% 25% 0%

SantaClara City
What's in the Santa Clara City data?
In July, Santa Clara had a total number of 27 single-family homes for sale, providing 11.5 months of inventory. There were 10 new listings and 10 homes sold, with a median sale price of $1.7m and a median overbid of 108.7%. There was an average of 32 days spent on the market.
There were 17 units for sale, providing 7 months of inventory. There were 4 new listings and 2 condo units sold, with a median price of $735k and a median overbid of 104%. The average time spent on the market decreased to 12 days.


4 New Listings 7 Months of Inventory $735 Median Sa 104% Median Sale vs List Avg Days on Sold COND Condo & Townho

City Apr2023 May2023 June2023 Jul2023 Apr2023 May2023 June2023 Jul2023 , y y LISTINGS
Median SalesPrice
Single-Family
Homes
The median sales price has increased from $16m last July 2022, to $17m as of July 2023
Condos & Townhomes
The median sales price has decreased from $760k last July 2022, to $735k as of July 2023.
AVGDays OntheMarket
Single-Family
Overbids
Single-Family
Homes
The overbid percentage has increased from 100% last July 2022, to 1087% a year later
Condos & Townhomes
The overbid percentage has increased from 101% last July 2022, to 104% a year later.
Homes
The average time spent on the market went up from 20 days last July 2022, to 32 days as of July 2023
Condos & Townhomes
The average time spent on the market went down from 24 days in July 2022, to 12 days as of July 2023
Back to Table of Contents Jul2022Aug2022Sep2022Oct2022Nov2022Dec2022 Jan2023Feb2023Mar2023Apr2023May2023June2023 Jul2023 $2,000,000 $1,500,000 $1,000,000 $500,000 $0 Jul2022Aug2022Sep2022Oct2022Nov2022Dec2022 Jan2023Feb2023Mar2023Apr2023May2023June2023 Jul2023 60 40 20 0 Jul2022Aug2022Sep2022Oct2022Nov2022Dec2022 Jan2023Feb2023Mar2023Apr2023May2023June2023 Jul2023 125% 100% 75% 50% 25% 0%

Saratoga
What's in the Saratoga data?
In July, Saratoga had 30 single-family homes for sale, providing the market with 29 months of inventory. There were 5 new listings, and a total of 1 home was sold for a sale price of $4m. The median overbid was 82.5%, and the average time spent on the market was 19 days.
There were 3 condo and townhome units for sale, providing 0 months of inventory to the market. There was 1 new listing for sale and a total of 0 condos sold, with a median sale price of $0. The median overbid was 0%, and the average time on the market was 0 days.

1 Sold Listing

$4M Median Sale Price
19 Avg Days on Market
arks and Broker Metrics, includes all singlehomes in the California Area above from July ude preliminary data, and may vary from the data is deemed reliable but not guaranteed W Advisors Palo Alto 2023 Each office is ated
y
ly Homes

M M
ULY 2022 - JULY 2023
ingle-Family Homes ast 12 months, year-over-year.
ondos & Townhomes ast 12 months, year-over-year

Jul2022 Aug2022 Sep2022 Oct2022 Nov2022 Dec2022 Jan2023 Feb2023 Mar2023 Apr2023 May2023 June2023 Jul2023 Jul2022 Aug2022 Sep2022 Oct2022 Nov2022 Dec2022 Jan2023 Feb2023 Mar2023 Apr2023 May2023 June2023 Jul2023
Saratoga
SALE
LISTINGS FOR
SOLD LISTINGS
Median SalesPrice
Single-Family Homes
The median sales price has increased from $31m last July 2022, to $4m as of July 2023
Condos & Townhomes
The median sales price has decreased from $1.4m last July 2022, to $0 as of July 2023.
AVGDays OntheMarket
Single-Family
Overbids
Single-Family
Homes The overbid percentage has decreased from 96.6% last July 2022, to 825% a year later
Condos & Townhomes
The overbid percentage has decreased from 85.4% last July 2022, to 0% a year later.
Homes
The average time spent on the market went down from 32 days last July 2022, to 19 days as of July 2023
Condos & Townhomes
The average time spent on the market went down from 52 days in July 2022, to 0 days as of July 2023
Back to Table of Contents Jul2022Aug2022Sep2022Oct2022Nov2022Dec2022 Jan2023Feb2023Mar2023Apr2023May2023June2023 Jul2023 $5,000,000 $4,000,000 $3,000,000 $2,000,000 $1,000,000 $0 Jul2022Aug2022Sep2022Oct2022Nov2022Dec2022 Jan2023Feb2023Mar2023Apr2023May2023June2023 Jul2023 125 100 75 50 25 0 Jul2022Aug2022Sep2022Oct2022Nov2022Dec2022 Jan2023Feb2023Mar2023Apr2023May2023June2023 Jul2023 125% 100% 75% 50% 25% 0%
Berkeley ALAMEDA
COUNTY
What's in the Berkeley data?
There were 95 single-family homes for sale, providing 1 month of inventory. There were 54 new listings and 54 homes sold for a median sale price of $14m The median overbid percentage was 111.1%, with an average of 31 days on the market.
There were 26 condo and townhome units for sale, providing 1.4 months of inventory. There were 9 new listings, and 7 units sold for a median sale price of $1m. The median overbid percentage was 100.6%, with an average of 26 days on the market.


ce ly homes, 22 to July e the data # 01511642 tly owned rket
M

Months 100 Media

3 May2023 Jun2023 Jul2023 023 May2023 Jun2023 Jul2023 , y y LISTINGS FOR SALE SOLD LISTINGS
Median SalesPrice
Single-Family Homes
The median sales price has decreased from $17m last July 2022, to $14m as of July 2023
Condos & Townhomes
The median sales price has increased from $739k last July 2022, to $1m as of July 2023.
AVGDays OntheMarket
Single-Family
Overbids
Single-Family
Homes
The overbid percentage has decreased from 121.6% last July 2022, to 1111% a year later
Condos & Townhomes
The overbid percentage has decreased from 103.9% last July 2022, to 100.6% a year later.
Homes
The average time spent on the market went up from 18 days last July 2022, to 31 days as of July 2023
Condos & Townhomes
The average time spent on the market went up from 24 days in July 2022, to 26 days as of July 2023
Jul2022Aug2022Sep2022Oct2022Nov2022Dec2022 Jan2023Feb2023Mar2023Apr2023May2023Jun2023 Jul2023 $2,000,000 $1,500,000 $1,000,000 $500,000 $0 Jul2022Aug2022Sep2022Oct2022Nov2022Dec2022 Jan2023Feb2023Mar2023Apr2023May2023 Jun2023 Jul2023 50 40 30 20 10 0 Jul2022Aug2022Sep2022Oct2022Nov2022Dec2022 Jan2023Feb2023Mar2023Apr2023May2023 Jun2023 Jul2023 125% 100% 75% 50% 25% 0%
Back to Table of Contents

Lafayette
CONTRA COSTA COUNTY
What's in the Lafayette data?
There were 72 single-family homes for sale, providing 1.4 months of inventory. There were 39 new listings and 20 homes sold at a median sale price of $18m The median overbid percentage was 101%, with an average of 22 days on the market.
There were 12 condo and townhome units for sale, providing 1.4 months of inventory. There were 5 new listings, and 2 units sold for a median sale price of $1.3m. The median overbid percentage was 89.3%, with an average of 22 days on the market.
SFH Single-Family Homes

39 New Listings
20 Sold Listings
1.4 Months of Inventory
$1.8M Median Sale Price
101% Median Sale vs List
22 Avg Days on Market
The data, sourced from Broker Metrics, includes all single-family homes, condos and townhomes in the California Area above from July 2022 to July 2023 This may include preliminary data, and may vary from the time the data was gathered All data is deemed reliable but not guaranteed DRE# 01511642
Copyright KW Advisors Palo Alto 2023 Each office is independently owned and operated
CONDO

Condo & Townhomes
5 New Listings
2 Sold Listings
1.4 Months of Inventory
$1.3M Median Sale Price
89.3% Median Sale vs List
22 Avg Days on Market
Single-Family Homes
Last 12 months, year-over-year.
Condos & Townhomes
Last 12 months, year-over-year

Jul2022 Aug2022 Sep2022 Oct2022 Nov2022 Dec2022 Jan2023 Feb2023 Mar2023 Apr2023 May2023 Jun2023 Jul2023 125 100 75 50 25 0 Jul2022 Aug2022 Sep2022 Oct2022 Nov2022 Dec2022 Jan2023 Feb2023 Mar2023 Apr2023 May2023 Jun2023 Jul2023 20 15 10 5 0 Lafayette JULY 2022 - JULY 2023
LISTINGS FOR SALE SOLD LISTINGS
Median SalesPrice
Single-Family Homes
The median sales price has decreased from $19m last July 2022, to $18m as of July 2023
Condos & Townhomes
The median sales price has increased from $1.1m last July 2022, to $1.3m as of July 2023.
AVGDays OntheMarket
Single-Family Homes
The average time spent on the market went up from 20 days last July 2022, to 22 days as of July 2023
Condos & Townhomes
The average time spent on the market went up from 11 days in July 2022, to 22 days as of July 2023
Overbids
Single-Family Homes The overbid percentage has decreased from 101.1% last July 2022, to 101% a year later
Condos & Townhomes
The overbid percentage has decreased from 101.9% last July 2022, to 89.3% a year later.
Jul2022Aug2022Sep2022Oct2022Nov2022Dec2022 Jan2023Feb2023Mar2023Apr2023May2023Jun2023 Jul2023 $2,500,000 $2,000,000 $1,500,000 $1,000,000 $500,000 $0 Jul2022Aug2022Sep2022Oct2022Nov2022Dec2022 Jan2023Feb2023Mar2023Apr2023May2023 Jun2023 Jul2023 80 60 40 20 0 Jul2022Aug2022Sep2022Oct2022Nov2022Dec2022 Jan2023Feb2023Mar2023Apr2023May2023 Jun2023 Jul2023 125% 100% 75% 50% 25% 0%
Back to Table of Contents

Walnut Creek
CONTRA COSTA COUNTY
What's in the Walnut Creek data?
There were 81 single-family homes for sale, providing 1.8 months of inventory. There were 45 new listings, and 42 homes sold at a median price of $1.5m. The median overbid percentage was 102.5%, with an average of 14 days on the market.
There were 168 condo and townhome units for sale, providing 0.9 months of inventory. There were 84 new listings and 83 units sold at a median price of $615k. The median overbid percentage was 99.9%, with an average of 25 days on the market.

Homes
42 Sold Listings
$1.5M Median Sale Price
14 Avg Days on Market
etrics, includes all single-family homes, ornia Area above from July 2022 to July ata, and may vary from the time the data able but not guaranteed DRE# 01511642 23 Each office is independently owned


Single-Family Homes
Last 12 months, year-over-year.
Condos & Townhomes
Last 12 months, year-over-year

Jul2022 Aug2022 Sep2022 Oct2022 Nov2022 Dec2022 Jan2023 Feb2023 Mar2023 Apr2023 May2023 Jun2023 Jul2023 250 200 150 100 50 0 Jul2022 Aug2022 Sep2022 Oct2022 Nov2022 Dec2022 Jan2023 Feb2023 Mar2023 Apr2023 May2023 Jun2023 Jul2023 400 300 200 100 0 WalnutCreek JULY 2022 - JULY 2023
LISTINGS FOR SALE SOLD LISTINGS
Median SalesPrice
Single-Family
Homes
The median sales price has decreased from $16m last July 2022, to $15m as of July 2023
Condos & Townhomes
The median sales price has remained at $615k since July 2022.
Overbids
Single-Family
Single-Family
Homes
The average time spent on the market went down from 23 days in July 2022, to 14 days as of July 2023
Condos & Townhomes
The average time spent on the market went up from 20 days in July 2022, to 25 days as of July 2023
Homes
The overbid percentage has increased from 101.4% last July 2022, to 1025% a year later
Condos & Townhomes
The overbid percentage has decreased from 101.9% last July 2022, to 99.9% a year later.
Jul2022Aug2022Sep2022Oct2022Nov2022Dec2022 Jan2023Feb2023Mar2023Apr2023May2023Jun2023 Jul2023 $2,000,000 $1,500,000 $1,000,000 $500,000 $0 Jul2022Aug2022Sep2022Oct2022Nov2022Dec2022 Jan2023Feb2023Mar2023Apr2023May2023 Jun2023 Jul2023 40 30 20 10 0 Jul2022Aug2022Sep2022Oct2022Nov2022Dec2022 Jan2023Feb2023Mar2023Apr2023May2023 Jun2023 Jul2023 125% 100% 75% 50% 25% 0%
AVGDays OntheMarket
Back to Table of Contents




: 505 Hamilton Ave Suite #100, Palo Alto, CA 94301 PaloAlto 650564HOME MTeymouri@kw.com MTRealEstateGroupcom MT Real Estate Group MichaelTeymouri


