


San Francisco Bay Area and 10 Districts Data


Jump to Alameda Report
Jump to Contra Costa Report
Jump to Napa County Report
San Francisco County
Jump to San Francisco County Report
San Francisco County
Jump to San Francisco County Report
Jump to San Mateo Report
Jump to Santa Clara Report
Jump to Solano County Report
Jump to Sonoma County Report
Southern/Central Marin
Jump to Southern/Central Marin
Sea
Jump to District 1 - Northwest
Jump to District 6 - Central North
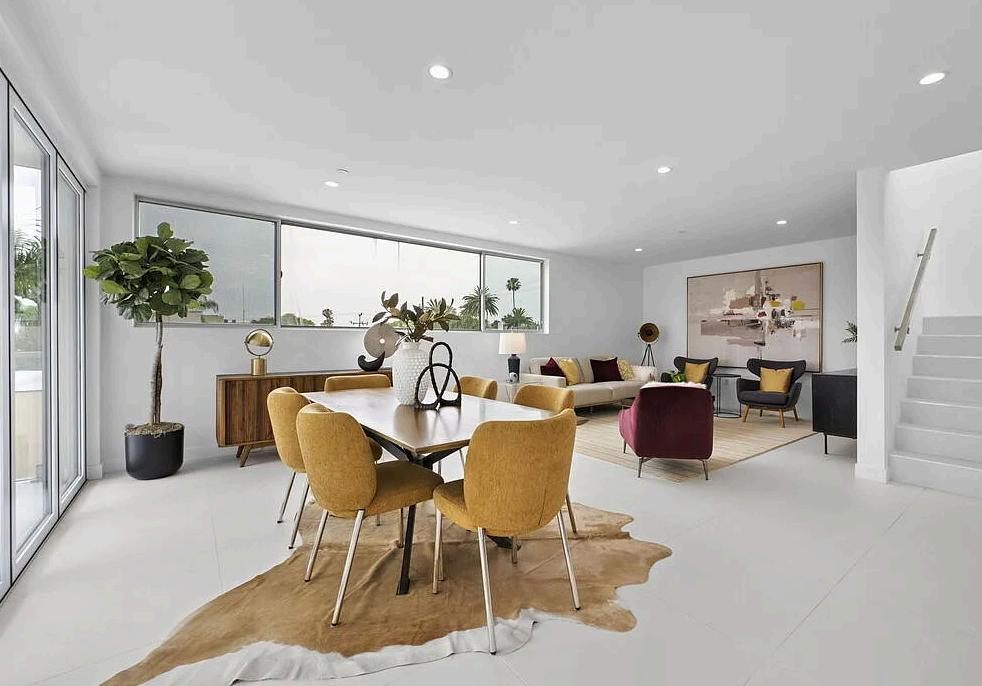
That's the question you should be asking yourself.
Our market is incredibly diverse and rapidly changing. Values vary not just by neighborhood but by street. Your home isn't necessarily worth what your neighbors' home is. It's the current market that sets the value of your home.
So, do you know what your home is worth in today's market?
Icanhelp...
Contact me for a confidential, no obligation assessment of your home's value.

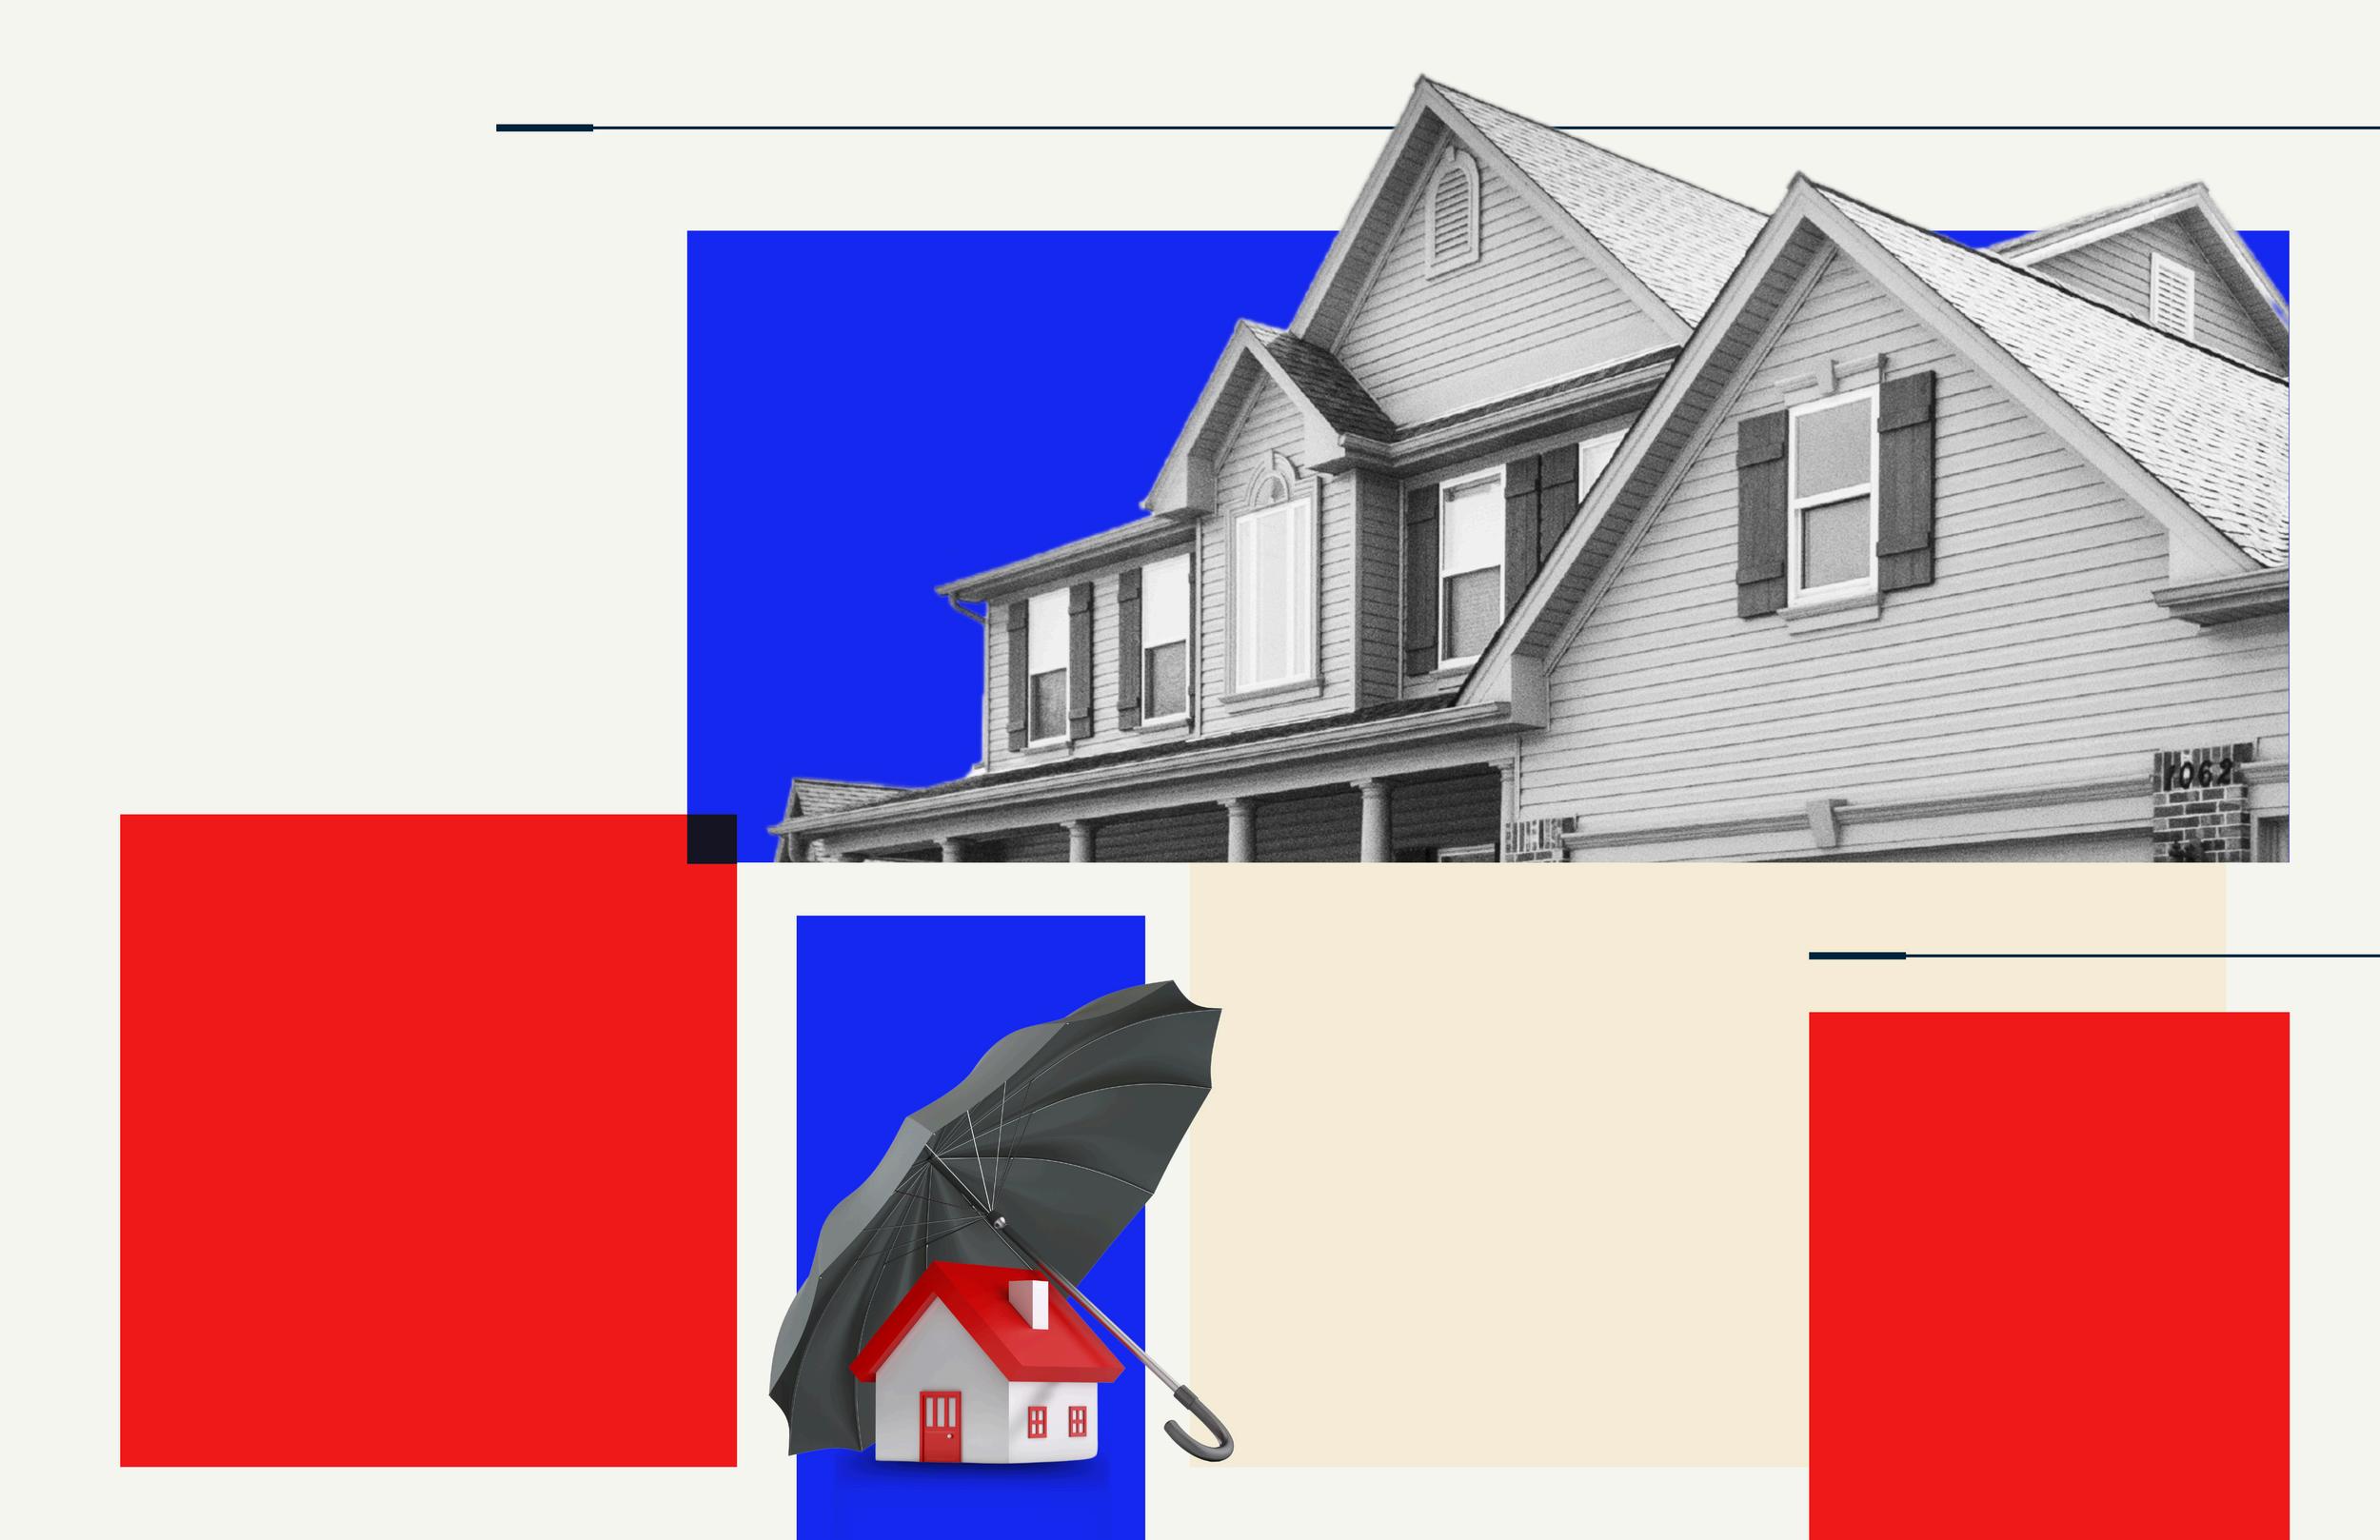
Buying a home is one of the biggest purchases you’ll ever make. And homeowner’s insurance is what protects that investment. Think of it as your safety net. NerdWallet explains it:
Covers Repairs and Rebuilding Costs: If your home is damaged by fire, storms, or other covered events, it helps pay for repairs and possibly even a full rebuild, if that’s deemed necessary. Protects Your Belongings: It can also cover personal items like furniture, electronics, jewelry, and clothing if they’re stolen or damaged.
Provides Liability Coverage: And, if someone gets injured on your property, your policy can help cover medical bills or legal expenses.
But that peace of mind does come with a cost, and lately those costs have been rising.


Secure Your Dream Home Today

Navigating the mortgage application process can be a breeze with a little preparation. To ensure a successful application and closing, consider these helpful tips for what to avoid.


3
4 5 6 1 2
Avoid major purchases like furniture, cars, or vacations to keep your credit profile stable. Maintain your current employment to show financial stability. Always consult your mortgage professional before making large financial moves.
Avoid paying off debts or collections without professional advice.
Use verified funds for deposits to prevent closing delays.
Don't have your credit report pulled too many times - this can hurt your credit score.


In2024,thehomebuyingmarketfacessignificantchallenges highprices, steepinterestrates,andlimitedhousinginventory Formany,renovatingtheir currenthomeisamoreattractiveoptionthanpurchasinganewone.Whilethe LIRAreportpredictsadeclineinrenovationspending,expertsemphasizethat small-scaleupdatesortargetedlargerprojectscanstilldelivermajorbenefits.
Beforedivingintoarenovation,it’sessentialtoplan carefullyandbudgetwisely.Workingwithreputable professionalsiskey,especiallythoseoffering financingoptionsandtransferablewarranties.Sharing yourbudgetwithcontractorsupfrontandinvolving designersearlyensuresthatyourrenovationruns smoothlyandachievesbothfinancialandfunctional success Adetailedplanwillkeeptheprojectontrack andhelpavoidcostlysurprises


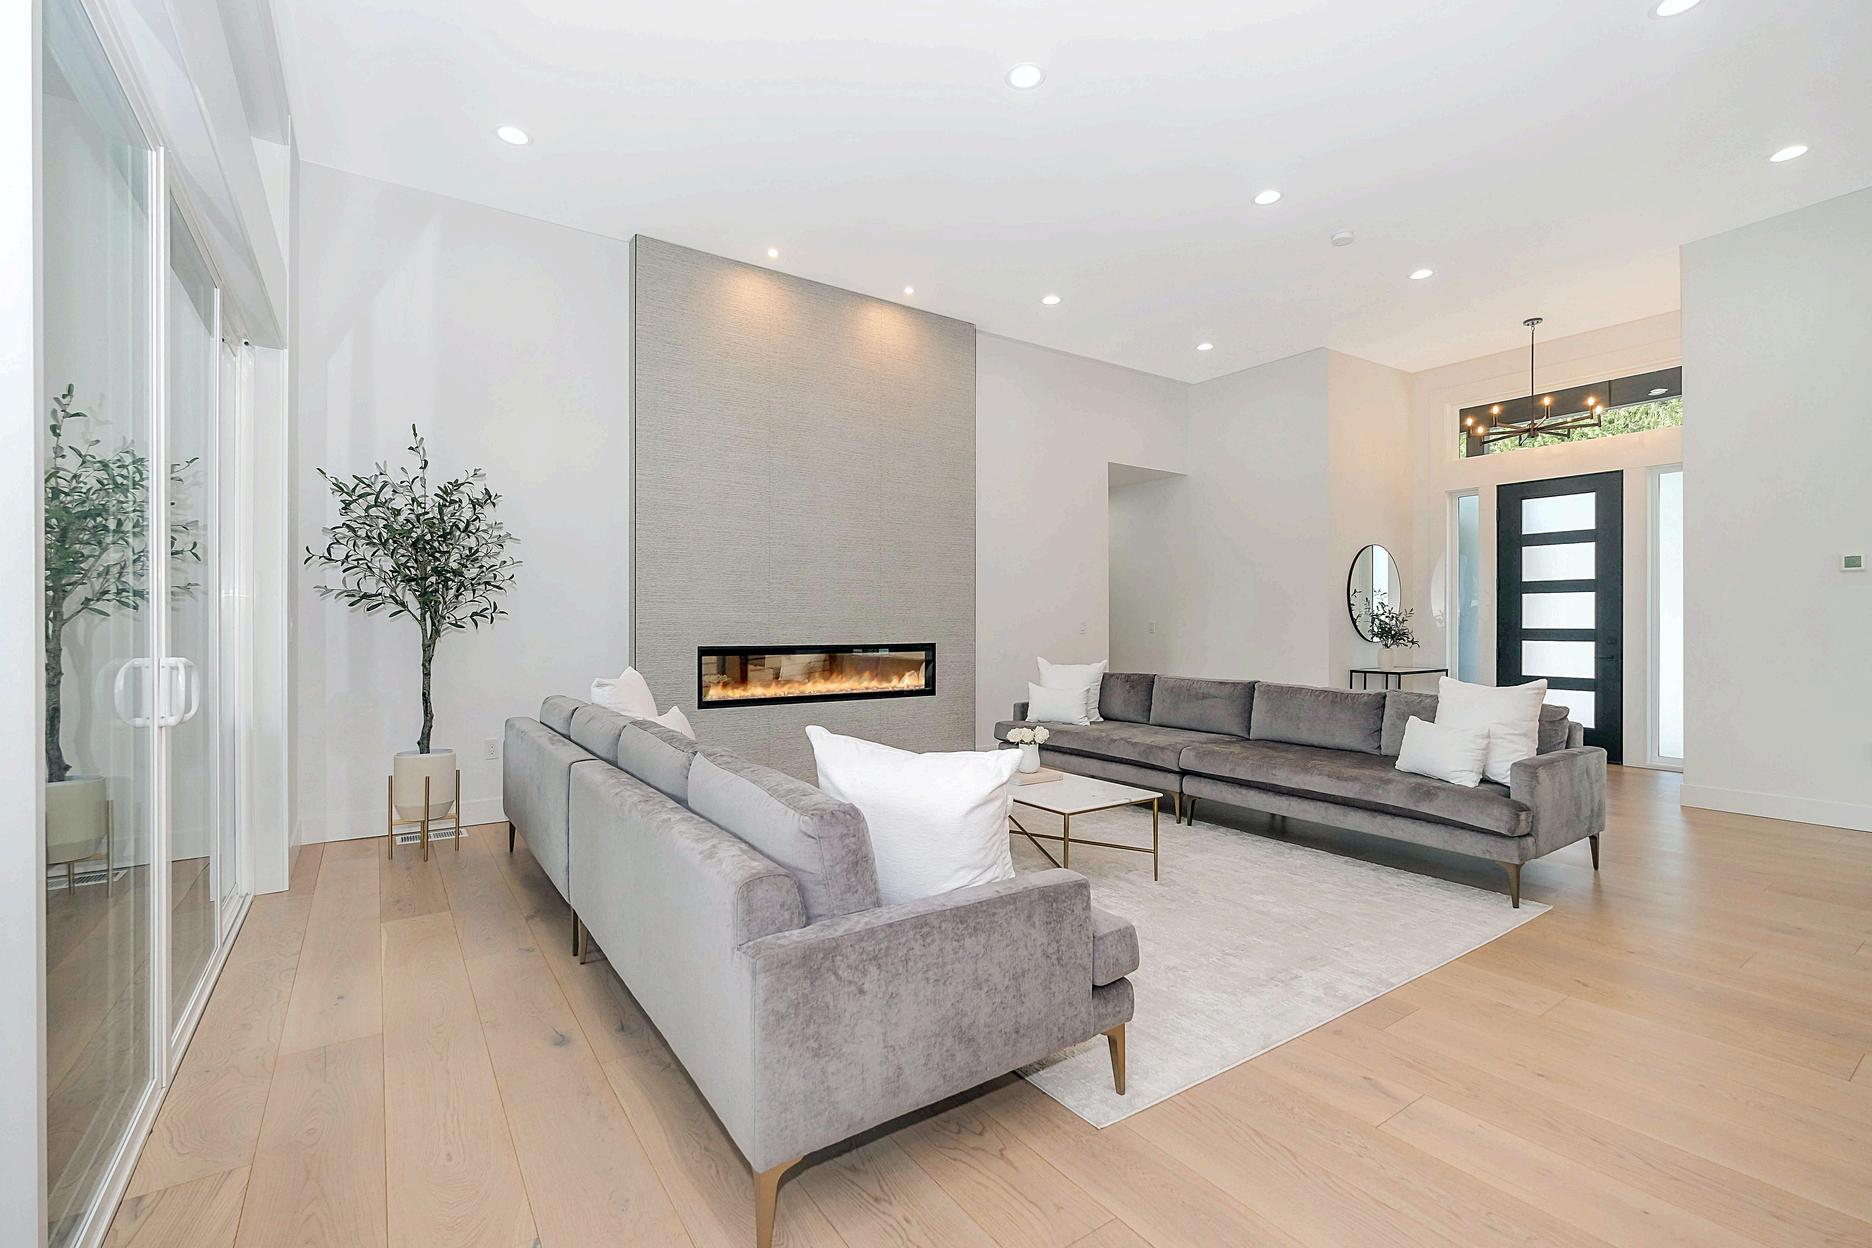
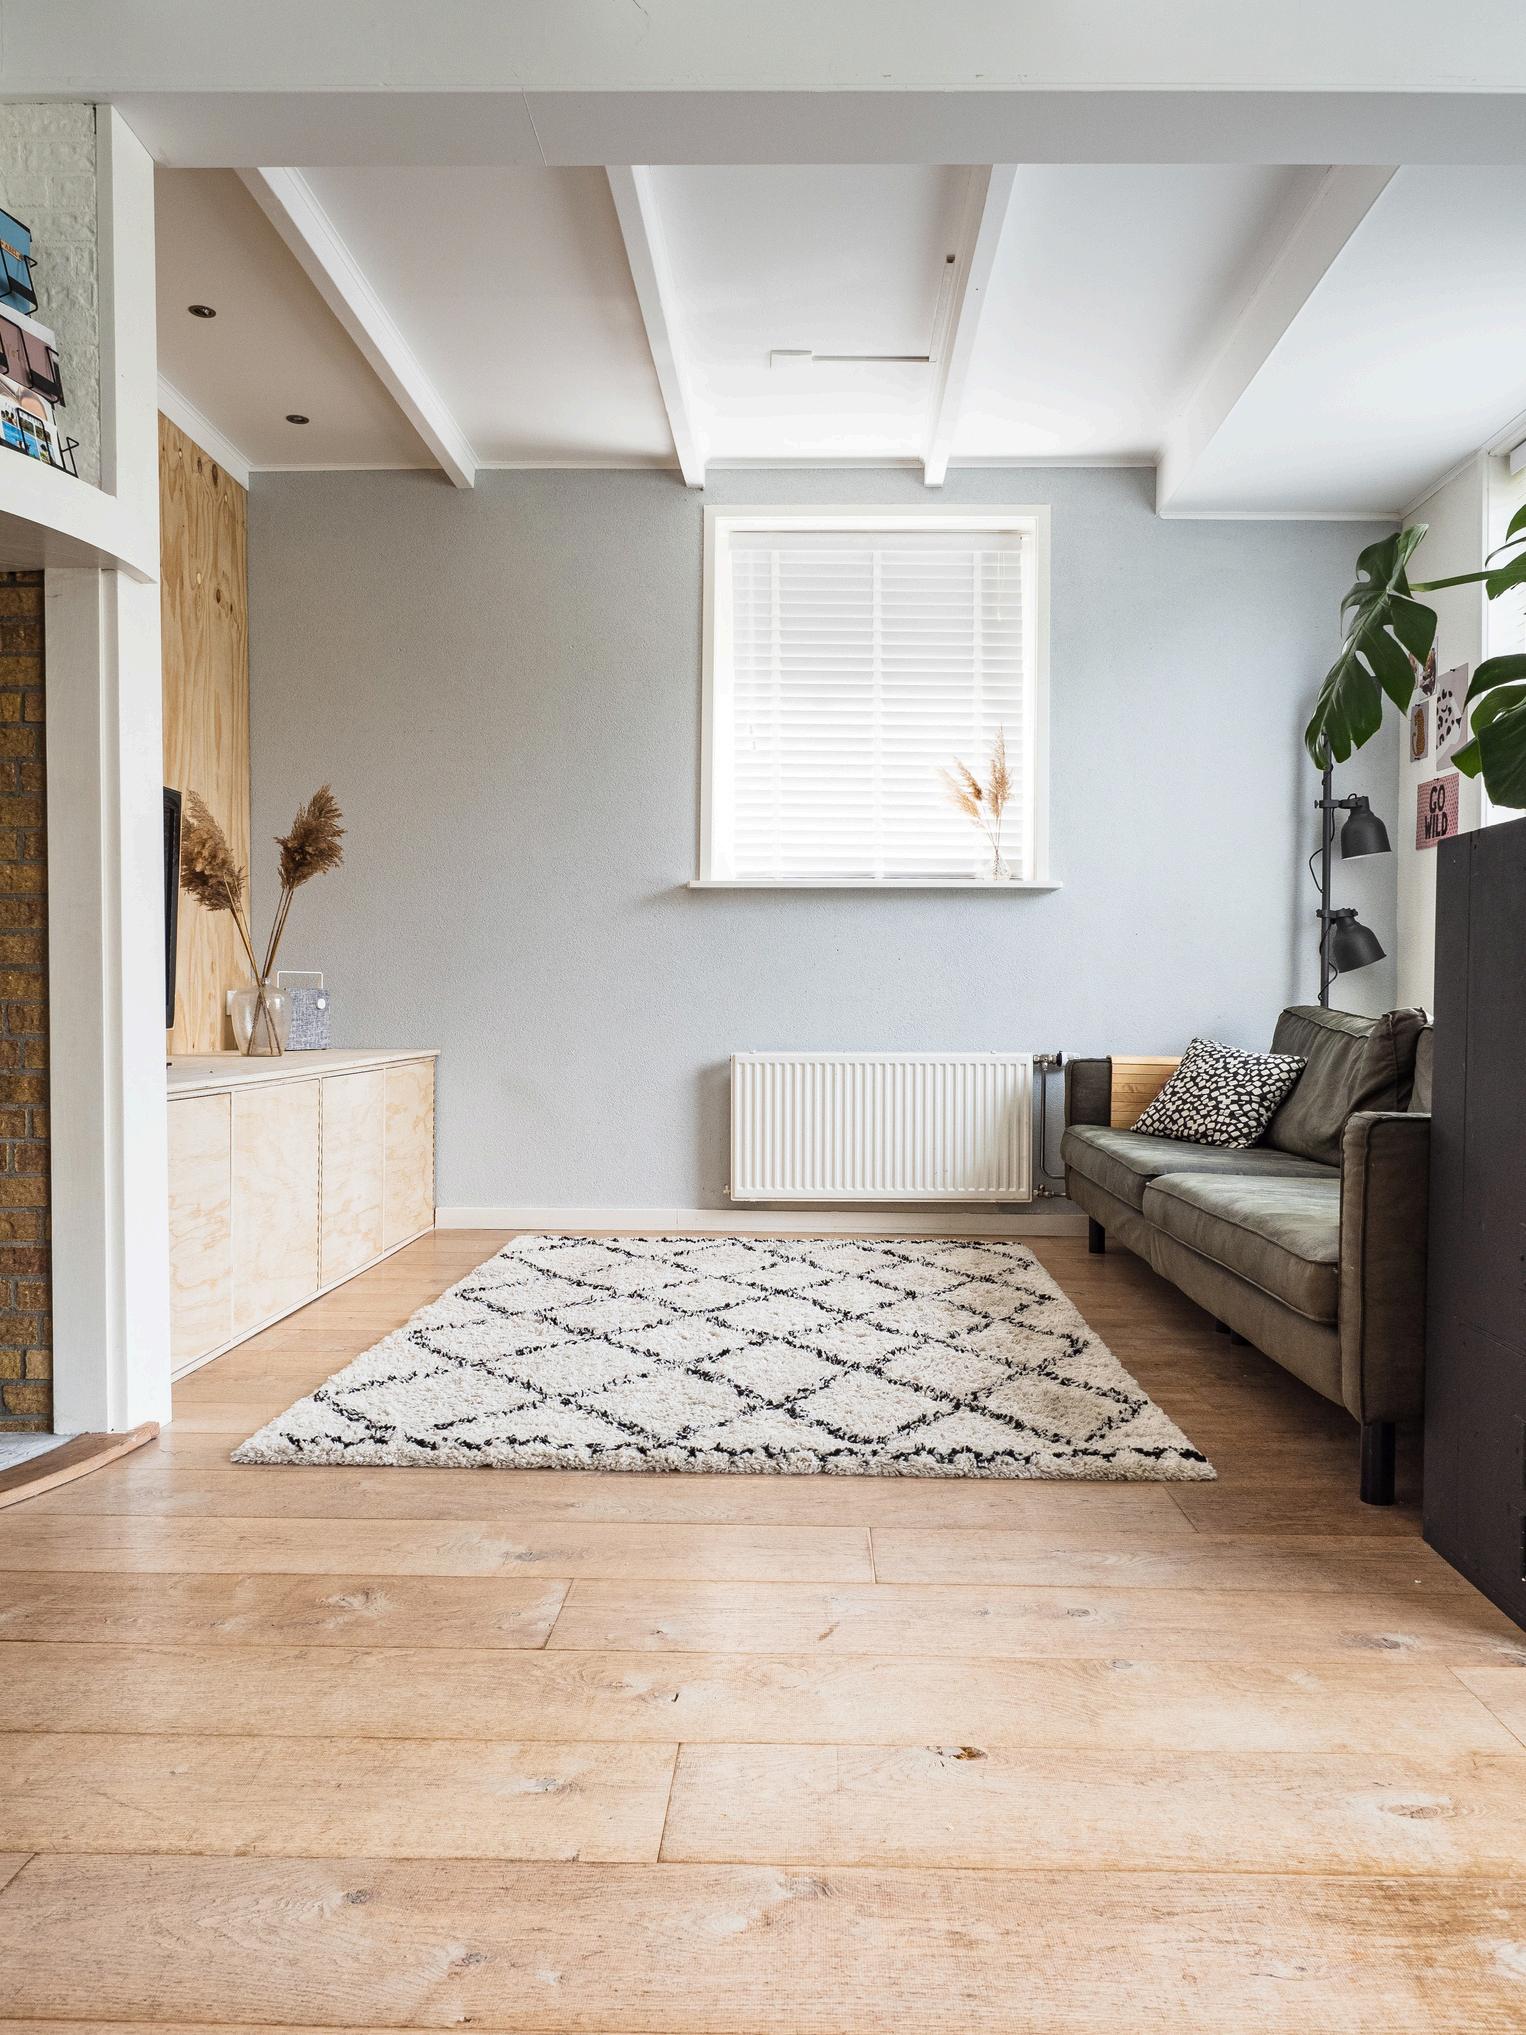
Bathrooms are a safe investment. Simple changes like a new vanity, upgraded flooring, or fresh lighting can completely transform the space. For a luxurious touch, consider adding a freestanding tub for a spa-like experience


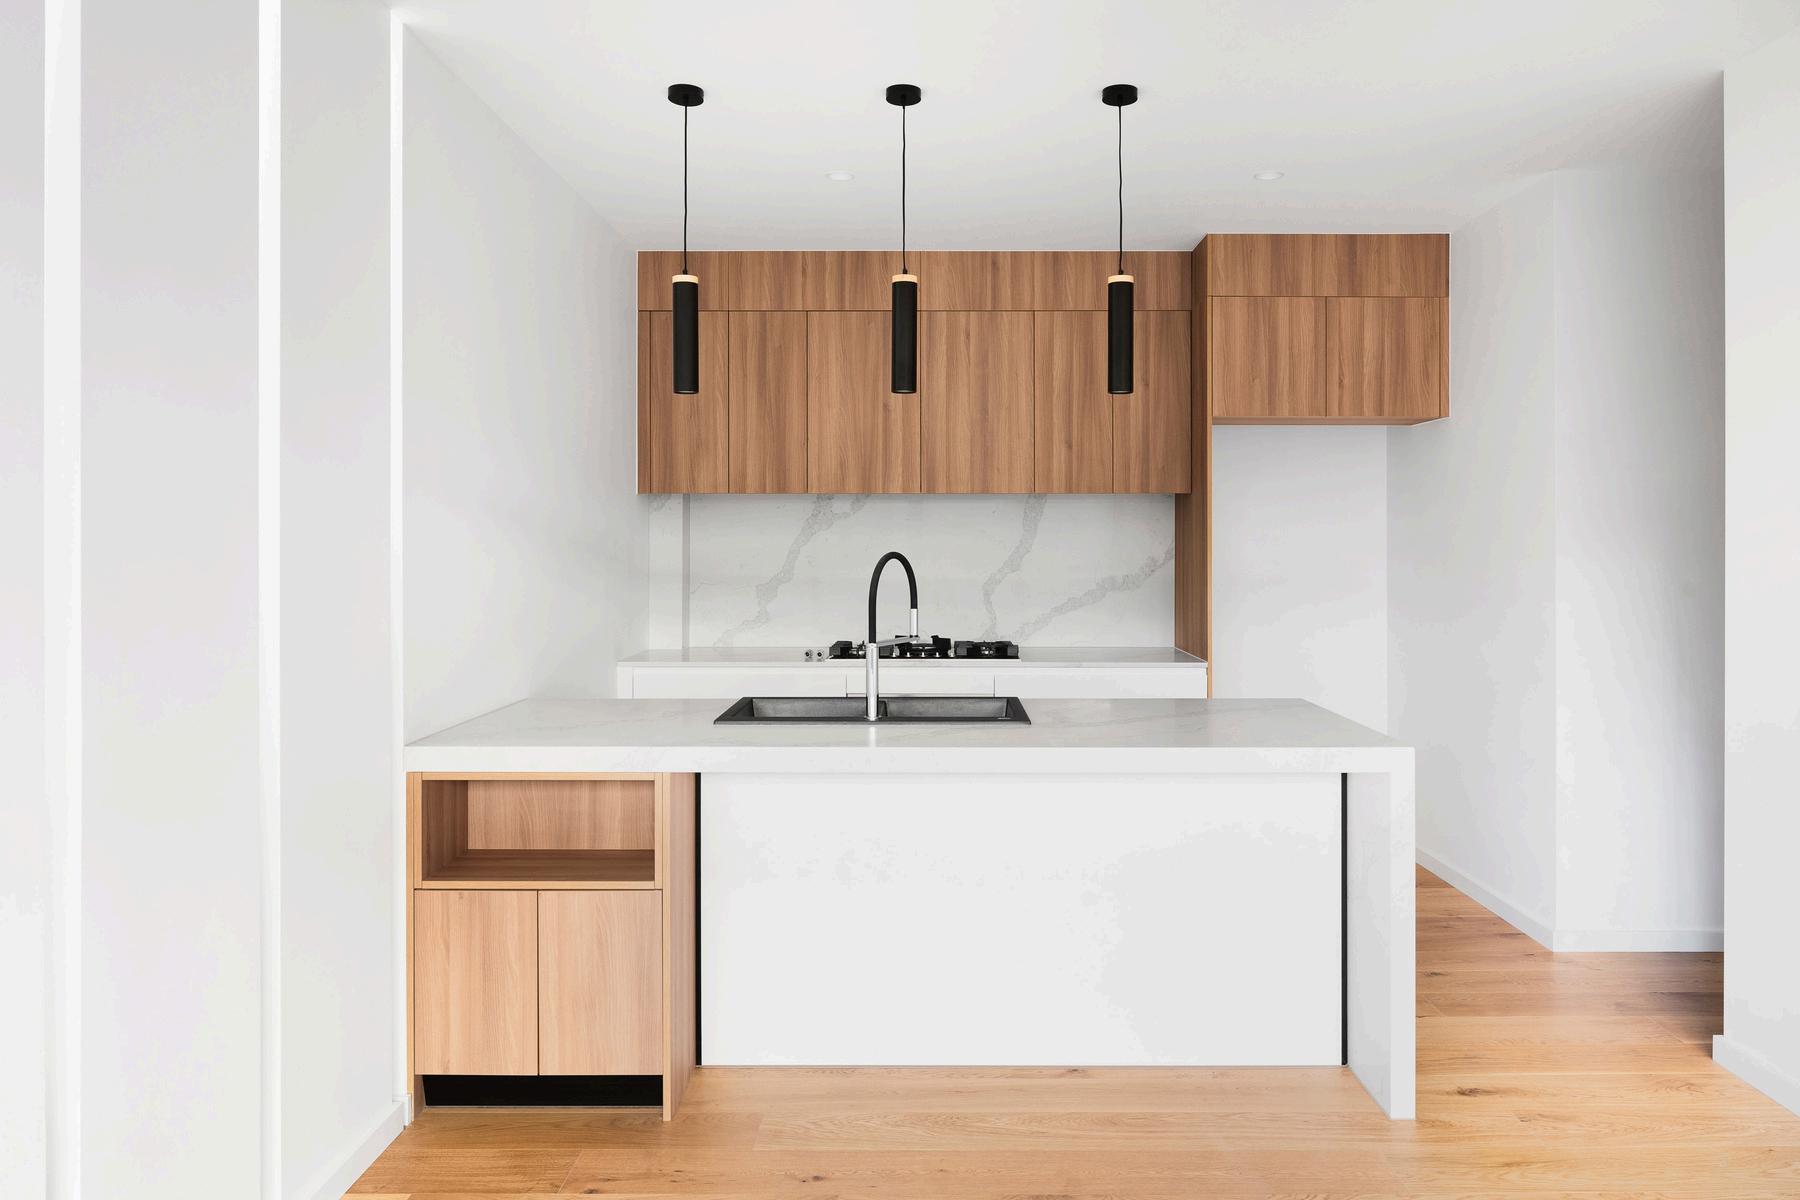
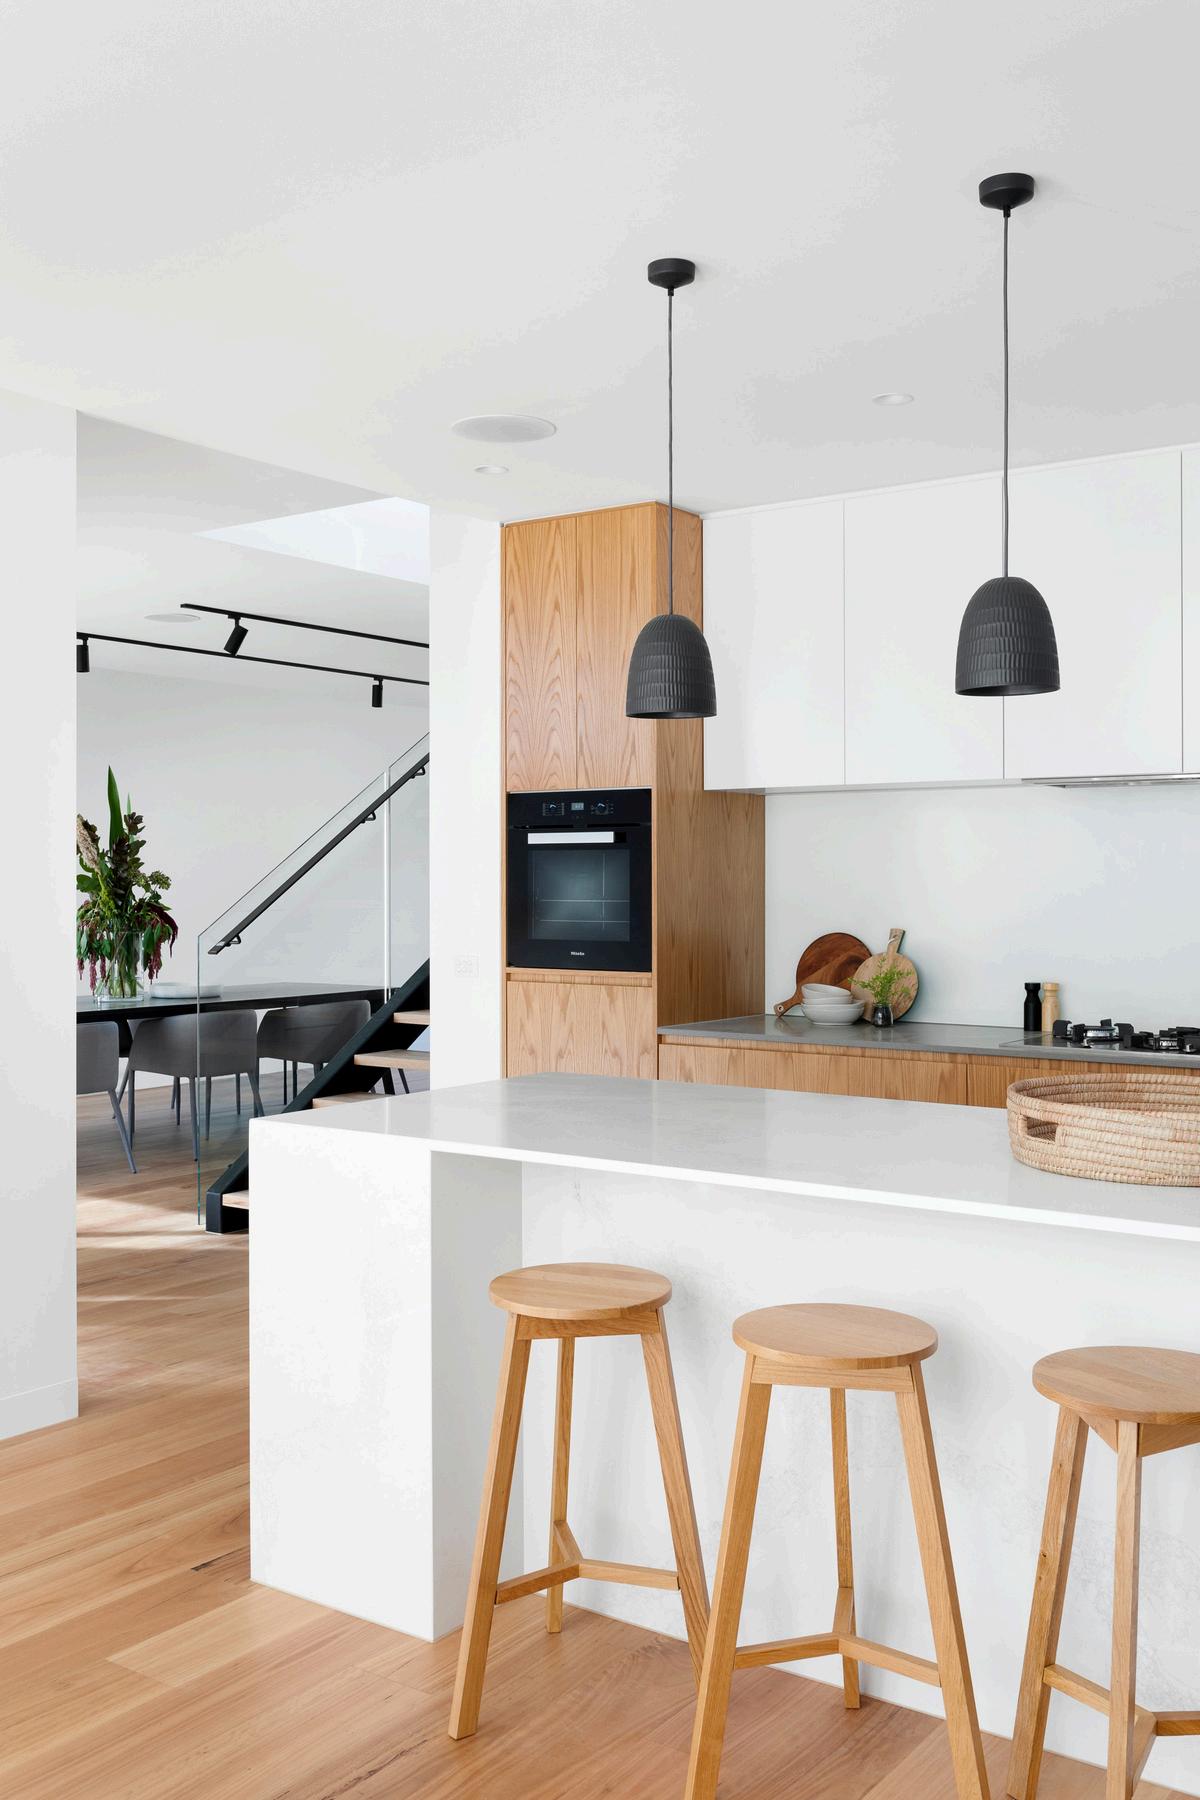
The kitchen is a crucial space for resale value. Opening up the space or adding functional features can make a big difference Smaller updates, like upgrading appliances, cabinets, or flooring, can give your kitchen a fresh, modern feel


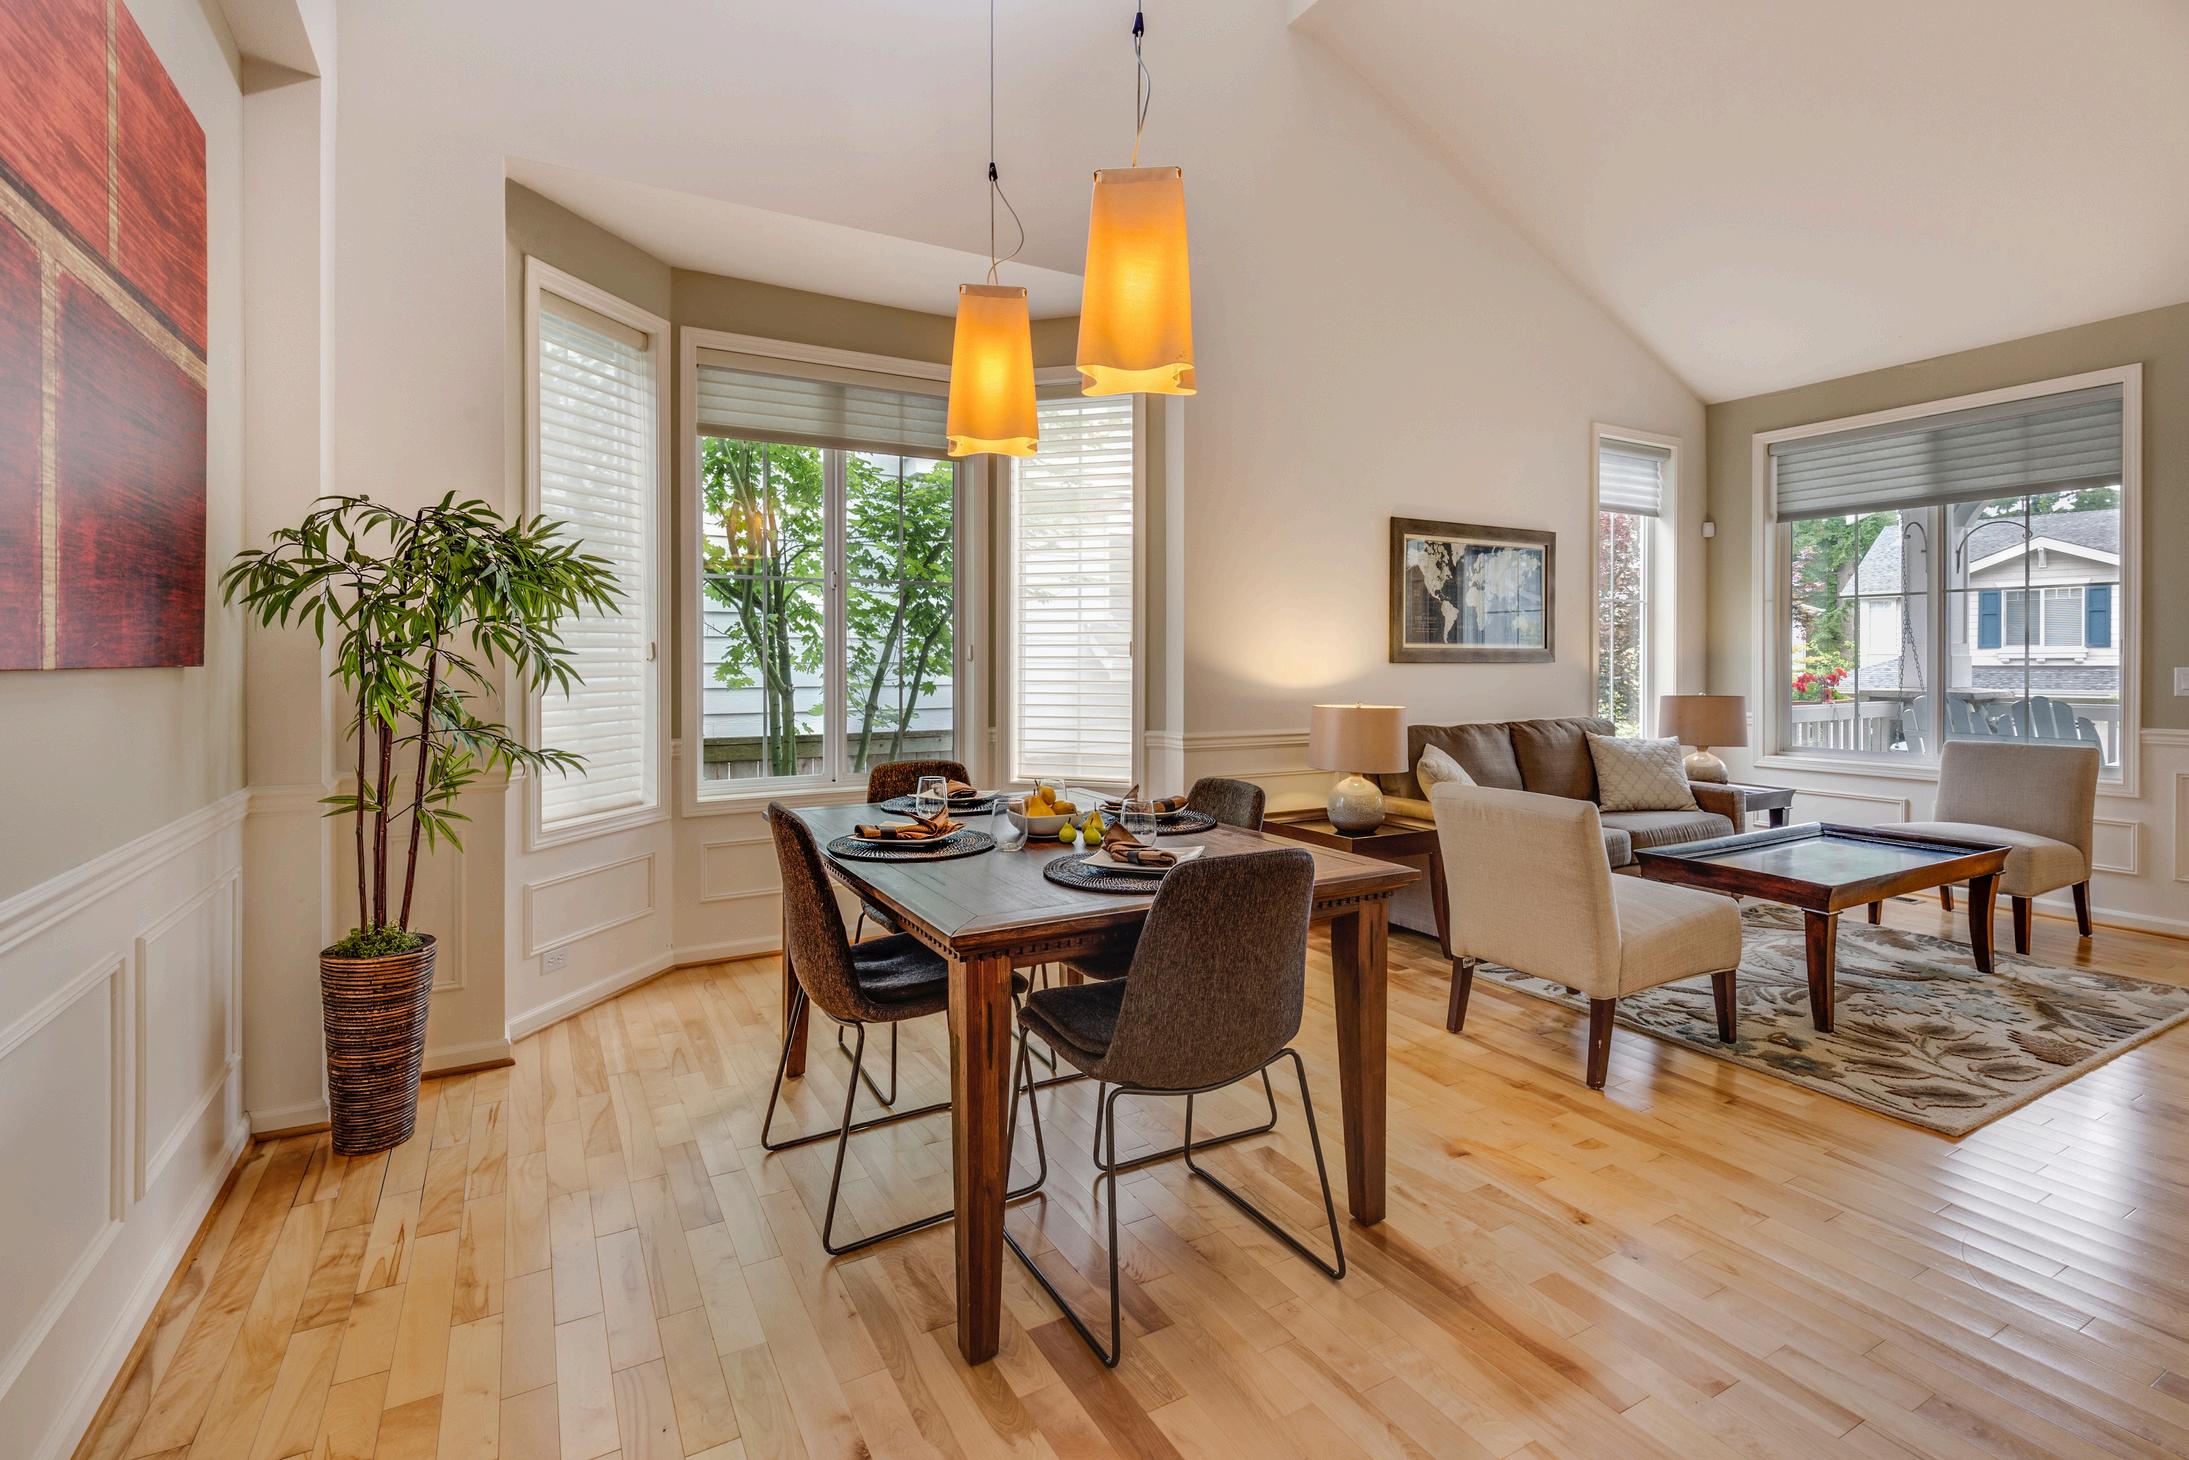
Bold design choices, such as statement wallpaper, unique lighting, or striking color palettes, can refresh any room. Layering textiles or mixing traditional and modern styles creates a space that feels cohesive and impactful


Renovations focusing on health are becoming increasingly popular. Use non-toxic materials free from Red List chemicals like BPA and VOCs. Consider adding air purifiers, water filtration systems, and better ventilation to create a healthier living environment


First impressions matter, and curb appeal can greatly impact your home's value. Exterior upgrades like siding, roofing, and landscaping enhance both aesthetics and security. Adding outdoor living spaces, such as a garden or entertainment area, boosts appeal even more.


Tailor renovations to your family’s lifestyle. Flexible spaces that accommodate workfrom-home needs, growing children, or future buyers will add lasting value. Think about both how your family uses the space and how it will appeal to future buyers.

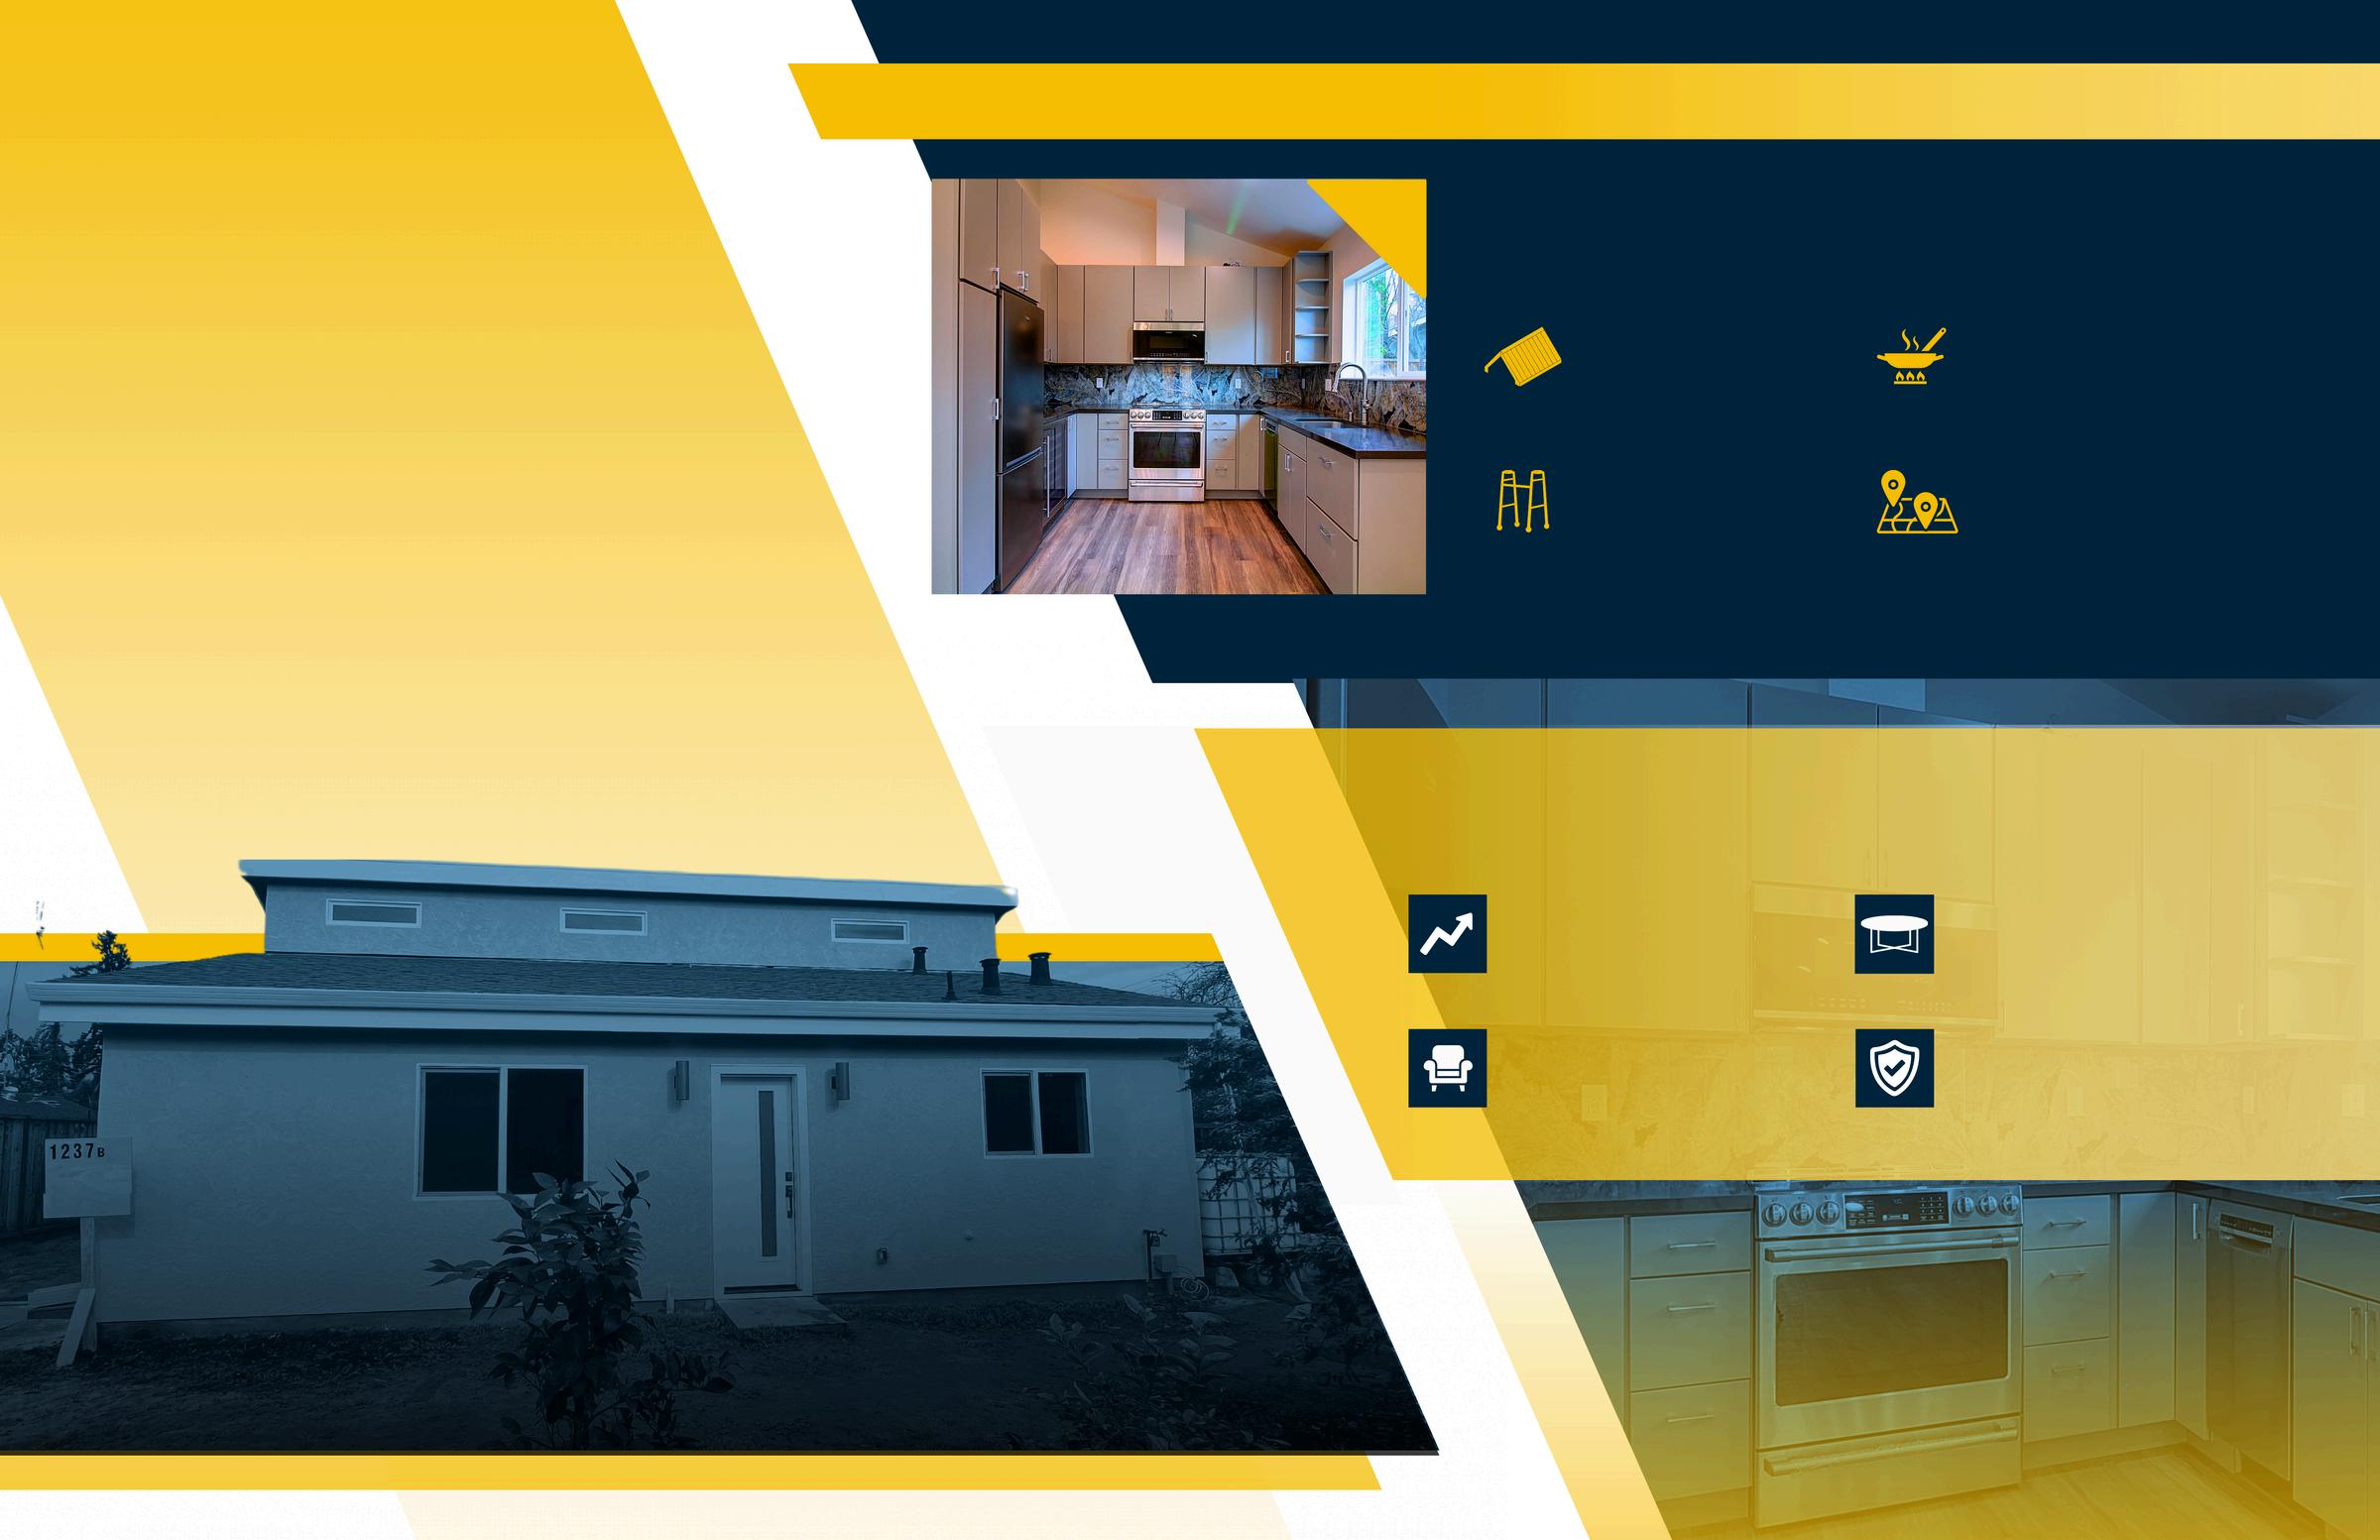

The Anenberg-Essert family in Campbell collaborated with Acton ADU to create a versatile, comfortable, and valuable addition to their property. This ADU project is a shining example of how a well-designed accessory dwelling unit can increase property value and serve a family’s unique needs.
The family envisioned an ADU that would function as an independent living space for family members, enhance their property’s worth, and provide seamless integration with the main home They wanted a space that balanced privacy with connectivity, feeling like a natural extension of their residence
Constructed at 747 square feet, this ADU was designed with modern, high-quality finishes to serve both aesthetic and practical needs. Key features include:
Vaulted Ceilings
Creates a spacious, open atmosphere
Senior-Friendly Living
Safe, independent space for elderly family members
Fully Equipped Kitchen
Modern amenities for everyday convenience
Open Living Area
Multipurpose area for relaxation and entertainment
The completion of the Anenberg-Essert ADU led to several valuable outcomes:
Increased Property Value
The ADU addition significantly boosted property value
Flexible Living Space
A versatile space for family, guests, or as a rental
Modern Comforts
High-end finishes and amenities enhance both function and style.
Enhanced Family Living
The ADU enriches the AnenbergEssert family’s home with both privacy and connection

Thinking about how an ADU could fit into your family’s lifestyle or property investment strategy?
Trust Acton ADU to guide you every step of the way.

When it comes to home ownership, knowing who you can trust is crucial. That's why we've curated a select list of trusted vendors who are ready to help with your home goals.


There were 719 single-family homes for sale, providing 1.1 months of inventory. There were 704 new listings, and 324 homes sold at a median price of $1.1m. The median overbid percentage was at 100.1%, with an average of 37 days on the market.
There were 474 condo and townhome units for sale, providing 2 4 months of inventory There were 355 new listings and 121 units sold at a median sale price of $650k. The median overbid percentage was at 98.8%, with an average of 70 days on the market.

704 New Listings
324 Sold Listings
1.1 Months of Inventory
$1.1M Median Sale Price
100.1%
Median Sale vs List
37 Avg Days on Market
The data, sourced from InfoSparks, includes all single-family homes, condos and townhomes in the California Area above from January 2025 to January 2026. This may include preliminary data, and may vary from the time the data was gathered. All data is deemed reliable but not guaranteed. DRE# 01995149. Copyright KW Advisors San Francisco | Napa Valley 2026. Each office is independently owned and operated.
New Listings
2.4
Months of Inventory 98.8%
Median Sale vs List
The median sale price has increased from $1 1m last January 2025, to $1 13m as of January 2026
The median sale price has decreased from $675k last January 2025, to $650k as of January 2026
The average time spent on the market remained the same from 37 days last January 2025, to 37 days as of January 2026
The average time spent on the market went up from 53 days in January 2025, to 70 days as of January 2026.
The
year
The overbid percentage has decreased from 99.4% last January 2025, to 98.8% a year later.
There were 924 single-family homes for sale, providing 1.5 months of inventory. There were 701 new listings, and 342 homes sold at a median price of $800k. The median overbid percentage was at 100%, with an average of 47 days on the market.
There were 393 condo and townhome units for sale, providing 2.5 months of inventory. There were 245 new listings and 99 units sold at a median sale price of $630k. The median overbid percentage was at 98.7%, with an average of 57 days on the market

701 New Listings
342 Sold Listings
1.5 Months of Inventory
$800K
Median Sale Price
100%
Median Sale vs List
47
Avg Days on Market
The data, sourced from InfoSparks, includes all single-family homes, condos and townhomes in the California Area above from January 2025 to January 2026. This may include preliminary data, and may vary from the time the data was gathered. All data is deemed reliable but not guaranteed. DRE# 01995149. Copyright KW Advisors San Francisco | Napa Valley 2026. Each office is independently owned and operated.
245
New Listings
99 Sold Listings
2.5
Months of Inventory
$630K
Median Sale Price 98.7%
Median Sale vs List 57 Avg Days on Market

JANUARY 2025 - JANUARY 2026
Single-Family Homes
Last 12 months, year-over-year.
Condos & Townhomes
Last 12 months, year-over-year
The median sale price has increased from $784k last January 2025, to $800k as of January 2026
Condos & Townhomes
The median sale price has decreased from $650k last January 2025, to $630k as of January 2026
The average time spent on the market went up from 42 days last January 2025, to 47 days as of January 2026
The average time spent on the market went up from 42 days in January 2025, to 57 days as of January 2026.
The overbid percentage has remained the same from 100% last January 2025, to 100% a year later
Condos & Townhomes
The overbid percentage has decreased from 100% last January 2025, to 98.7% a year later.

What's in the Napa County data?
There were 273 single-family homes for sale, providing 3.8 months of inventory. There were 69 new listings, and 39 homes sold at a median price of $1m. The median overbid percentage was at 95 8%, with an average of 87 days on the market
There were 39 condo and townhome units for sale, providing 3.7 months of inventory. There were 14 new listings and 6 units sold at a median sale price of $884k. The median overbid percentage was at 99%, with an average of 96 days on the market.

69 New Listings
39 Sold Listings
3.8 Months of Inventory
$1M Median Sale Price
95.8%
Median Sale vs List
87 Avg Days on Market
The data, sourced from InfoSparks, includes all single-family homes, condos and townhomes in the California Area above from January 2025 to January 2026. This may include preliminary data, and may vary from the time the data was gathered. All data is deemed reliable but not guaranteed. DRE# 01995149. Copyright KW Advisors San Francisco | Napa Valley 2026. Each office is independently owned and operated.
New Listings
6
Sold Listings
3.7
Months of Inventory $884K
Median Sale Price 99%
Median Sale vs List 96 Avg Days on Market

JANUARY 2025 - JANUARY 2026
Single-Family Homes
Last 12 months, year-over-year.
Condos & Townhomes
Last 12 months, year-over-year
The median sale price has increased from $880k last January 2025, to $1m as of January 2026
Condos & Townhomes
The median sale price has decreased from $910k last January 2025, to $884k as of January 2026
The average time spent on the market remained the same from 87 days last January 2025, to 87 days as of January 2026
The average time spent on the market went down from 111 days in January 2025, to 96 days as of January 2026.
The overbid percentage has decreased from 98 7% last January 2025, to 95 8% a year later
Condos & Townhomes
The overbid percentage has increased from 98.9% last January 2025, to 99% a year later.

There were 148 single-family homes for sale, providing 0.8 months of inventory. There were 169 new listings, and 75 homes sold at a median price of $1.6m. The median overbid percentage was at 113.2%, with an average of 34 days on the market.
There were 342 condo and townhome units for sale, providing 1 8 months of inventory There were 276 new listings and 95 units sold at a median sale price of $1m. The median overbid percentage was at 99.1%, with an average of 99 days on the market.

169 New Listings
75 Sold Listings
0.8 Months of Inventory
$1.6M Median Sale Price
113.2%
Median Sale vs List
34 Avg Days on Market
The data, sourced from InfoSparks, includes all single-family homes, condos and townhomes in the California Area above from January 2025 to January 2026. This may include preliminary data, and may vary from the time the data was gathered. All data is deemed reliable but not guaranteed. DRE# 01995149. Copyright KW Advisors San Francisco | Napa Valley 2026. Each office is independently owned and operated.
276
New Listings
95 Sold Listings
1.8
Months of Inventory
$1M
Median Sale Price 99.1%
Median Sale vs List 99 Avg Days on Market

JANUARY 2025 - JANUARY 2026
ngle-Family Homes st 12 months, year-over-year.
ondos & Townhomes st 12 months, year-over-year
The median sale price has increased from $1 4m last January 2025, to $1 6m as of January 2026
Condos & Townhomes
The median sale price has increased from $995k last January 2025, to $1m as of January 2026
The average time spent on the market went down from 48 days last January 2025, to 34 days as of January 2026
Condos & Townhomes
The average time spent on the market remained the same from 99 days in January 2025, to 99 days as of January 2026.
Single-Family Homes
The overbid percentage has increased from 101 6% last January 2025, to 113 2% a year later
Condos & Townhomes
The overbid percentage has increased from 98.6% last January 2025, to 99.1% a year later.

There were 299 single-family homes for sa providing 0.9 months of inventory. There w new listings, and 152 homes sold at a med price of $1.8m. The median overbid percen was at 100 3%, with an average of 40 days market.
There were 175 condo and townhome unit sale, providing 1.8 months of inventory. Th were 134 new listings and 54 units sold at median sale price of $842k. The median o percentage was at 97.9%, with an average days on the market

152 Sold Listings
$1.8M
Median Sale Price
40 Avg Days on Market
includes all single-family homes, condos and from January 2025 to January 2026. This may from the time the data was gathered. All data is DRE# 01995149. Copyright KW Advisors San Francisco | Napa Valley 2026. Each office is independently owned and operated.
134
New Listings
54
Sold Listings
1.8
Months of Inventory
$842K
Median Sale Price 97.9%
Median Sale vs List
67
Avg Days on Market

JANUARY 2025 - JANUARY 2026
y Homes ths, year-over-year.
ownhomes ths, year-over-year
The median sale price has increased from $1 7m last January 2025, to $1 8m as of January 2026
Condos & Townhomes
The median sale price has decreased from $919k last January 2025, to $842k as of January 2026
The average time spent on the market went down from 41 days last January 2025, to 40 days as of January 2026
Condos & Townhomes
The average time spent on the market went up from 55 days in January 2025, to 67 days as of January 2026.
Single-Family Homes
The overbid percentage has decreased from 100 4% last January 2025, to 100 3% a year later
Condos & Townhomes
The overbid percentage has decreased from 98.9% last January 2025, to 97.9% a year later.


ntory
308 Sold Listings
$1.7M Median Sale Price
1% List
34 Avg Days on Market
from InfoSparks, includes all single-family homes, condos and California Area above from January 2025 to January 2026. This may and may vary from the time the data was gathered. All data is not guaranteed. DRE# 01995149. Copyright KW Advisors San Francisco | Napa Valley 2026. Each office is independently owned and operated.
New Listings
2 Months of Inventory 100%
Median Sale vs List
The median sale price has decreased from $1 8m last January 2025, to $1 7m as of January 2026
Condos & Townhomes
The median sale price has decreased from $915k last January 2025, to $882k as of January 2026
The average time spent on the market went up from 28 days last January 2025, to 34 days as of January 2026
Condos & Townhomes
The average time spent on the market went up from 46 days in January 2025, to 65 days as of January 2026.
Single-Family Homes
The overbid percentage has decreased from 101 4% last January 2025, to 101 1% a year later
Condos & Townhomes
The overbid percentage has remained the same from 100% last January 2025, to 100% a year later.
There were 550 single-family providing 1.9 months of inve new listings, and 162 homes price of $565k. The median o was at 100%, with an average market.
There were 76 condo and tow sale, providing 3.1 months of were 31 new listings and 18 sale price of $302k. The med percentage was at 98.8%, wi days on the market
homes, condos and January 2026. This may was gathered. All data is Copyright KW Advisors San Francisco | Napa Valley 2026. Each office is independently owned and operated.

The median sale price has decreased from $566k last January 2025, to $565k as of January 2026
Condos & Townhomes
The median sale price has decreased from $395k last January 2025, to $302k as of January 2026
The average time spent on the market went up from 60 days last January 2025, to 67 days as of January 2026
The average time spent on the market went up from 84 days in January 2025, to 99 days as of January 2026.
The overbid percentage has remained the same from 100% last January 2025, to 100% a year later
Condos & Townhomes
The overbid percentage has decreased from 100% last January 2025, to 98.8% a year later.

There were 507 single-family providing 1.6 months of inve new listings, and 163 homes price of $800k. The median o was at 98.6%, with an averag market.
There were 90 condo and tow sale, providing 2.2 months of were 42 new listings and 23 sale price of $470k. The med percentage was at 98 2%, wi days on the market.

homes, condos and January 2026. This may was gathered. All data is Copyright KW Advisors San Francisco | Napa Valley 2026. Each office is independently owned and operated.
42
New Listings
23 Sold Listings
2.2
Months of Inventory
$470K
Median Sale Price 98.2%
Median Sale vs List 67 Avg Days on Market

JANUARY 2025 - JANUARY 2026
Family Homes
2 months, year-over-year.
s & Townhomes
2 months, year-over-year
The median sale price has decreased from $818k last January 2025, to $800k as of January 2026
The median sale price has increased from $441k last January 2025, to $470k as of January 2026
The average time spent on the market went up from 64 days last January 2025, to 88 days as of January 2026
The average time spent on the market went up from 57 days in January 2025, to 67 days as of January 2026.
The overbid percentage has decreased from 100% last January 2025, to 98 6% a year later
The overbid percentage has decreased from 100% last January 2025, to 98.2% a year later.

There were 164 single-family homes for sale, providing 1 month of inventory. There were 8 new listings, and 71 homes sold at a median of $1.7m. The median overbid percentage wa 98.3%, with an average of 67 days on the ma
There were 78 condo and townhome units fo sale, providing 1 8 months of inventory Ther were 41 new listings and 24 units sold at a m sale price of $665k. The median overbid percentage was at 97.8%, with an average of days on the market.

41
New Listings
24 Sold Listings
1.8
Months of Inventory $665K
Median Sale Price 97.8%
Median Sale vs List 85 Avg Days on Market

JANUARY 2025 - JANUARY 2026
Single-Family Homes
Last 12 months, year-over-year.
Condos & Townhomes
Last 12 months, year-over-year
The median sale price has increased from $1 4m last January 2025, to $1 7m as of January 2026
The median sale price has decreased from $720k last January 2025, to $665k as of January 2026
The average time spent on the market went down from 81 days last January 2025, to 67 days as of January 2026
The average time spent on the market went up from 75 days in January 2025, to 85 days as of January 2026.
The overbid percentage has decreased from 99% last January 2025, to 98 3% a year later
Condos & Townhomes
The overbid percentage has decreased from 98.5% last January 2025, to 97.8% a year later.

Sea Cliff, Lake Street, Richmond (Inner, Central, Outer), Jordan Park/Laurel Heights, Lone Mountain
There were 11 single-family homes for sale, providing 0.7 months of inventory. There were 11 new listings, and 3 homes sold at a median price of $3.1m. The median overbid percentage was at 100%, with an average of 29 days on the market
There were 5 condo and townhome units for sale, providing 0.6 months of inventory. There were 4 new listings and 2 units sold at a median sale price of $1.5m. The median overbid percentage was at 100%, with an average of 52 days on the market.

11 New Listings
3 Sold Listings
0.7 Months of Inventory
$3.1M Median Sale Price
100%
Median Sale vs List
29 Avg Days on Market
The data, sourced from InfoSparks, includes all single-family homes, condos and townhomes in the California Area above from January 2025 to January 2026. This may include preliminary data, and may vary from the time the data was gathered. All data is deemed reliable but not guaranteed. DRE# 01995149. Copyright KW Advisors San Francisco | Napa Valley 2026. Each office is independently owned and operated.
JANUARY 2025 - JANUARY 2026
amily Homes months, year-over-year.
& Townhomes months, year-over-year
The median sale price has increased from $2 4m last January 2025, to $3 1m as of January 2026
The median sale price has decreased from $1 6m last January 2025, to $1 5m as of January 2026
The average time spent on the market went down from 49 days last January 2025, to 29 days as of January 2026
The average time spent on the market went up from 48 days in January 2025, to 52 days as of January 2026.
The overbid percentage has remained the same from 100% last January 2025, to 100% a year later
The overbid percentage has remained the same from 100% last January 2025, to 100% a year later.

Sunset & Parkside (Inner, Central, Outer), Golden Gate Heights
There were 19 single-family homes for sale, providing 0.5 months of inventory. There were 38 new listings, and 21 homes sold at a median price of $1.6m. The median overbid percentage was at 124.1%, with an average of 24 days on the market.
There were 3 condo and townhome units for sale, providing 1 month of inventory. There were 3 new listings and 4 units sold at a median sale price of $1m. The median overbid percentage was at 101.2%, with an average of 108 days on the market.

38 ew Listings
21 Sold Listings
0.5 Months of Inventory
$1.6M Median Sale Price
124.1%
Median Sale vs List
24 Avg Days on Market
The data, sourced from InfoSparks, includes all single-family homes, condos and townhomes in the California Area above from January 2025 to January 2026. This may include preliminary data, and may vary from the time the data was gathered. All data is deemed reliable but not guaranteed. DRE# 01995149. Copyright KW Advisors San Francisco | Napa Valley 2026. Each office is independently owned and operated.
3 New Listings
4 Sold Listings
1 Month of Inventory $1M
Median Sale Price 101.2%
Median Sale vs List 108 Avg Days on Market

JANUARY 2025 - JANUARY 2026
Single-Family Homes
Last 12 months, year-over-year.
Condos & Townhomes
Last 12 months, year-over-year
The median sale price has increased from $1 5m last January 2025, to $1 6m as of January 2026
Condos & Townhomes
The median sale price has decreased from $1 2m last January 2025, to $1m as of January 2026
The average time spent on the market went down from 29 days last January 2025, to 24 days as of January 2026
Condos & Townhomes
The average time spent on the market went down from 118 days in January 2025, to 108 days as of January 2026.
Single-Family Homes
The overbid percentage has increased from 106 9% last January 2025, to 124 1% a year later
Condos & Townhomes
The overbid percentage has increased from 99.7% last January 2025, to 101.2% a year later.

Lake Shore, Lakeside, Merced Manor, Merced Heights, Ingleside, Ingleside Heights, Oceanview
There were 13 single-family homes for sale, providing 1.1 months of inventory. There were 16 new listings, and 10 homes sold at a median price of $1.4m. The median overbid percentage was at 114 4%, with an average of 15 days on the market
There were 3 condo and townhome units for sale, providing 1.2 months of inventory. There were 4 new listings and 2 units sold at a median sale price of $1.3m. The median overbid percentage was at 105.1%, with an average of 68 days on the market.

16 New Listings
10 Sold Listings
1.1 Months of Inventory
$1.4M Median Sale Price
114.4%
Median Sale vs List
15 Avg Days on Market
The data, sourced from InfoSparks, includes all single-family homes, condos and townhomes in the California Area above from January 2025 to January 2026. This may include preliminary data, and may vary from the time the data was gathered. All data is deemed reliable but not guaranteed. DRE# 01995149. Copyright KW Advisors San Francisco | Napa Valley 2026. Each office is independently owned and operated.
4
New Listings
2 Sold Listings
1.2
Months of Inventory
$1.3M
Median Sale Price
105.1%
Median Sale vs List
68 Avg Days on Market

JANUARY 2025 - JANUARY 2026
Single-Family Homes
Last 12 months, year-over-year.
Condos & Townhomes
Last 12 months, year-over-year
The median sale price has increased from $1 1m last January 2025, to $1 4m as of January 2026
Condos & Townhomes
The median sale price has increased from $612k last January 2025, to $1 3m as of January 2026
The average time spent on the market went down from 27 days last January 2025, to 15 days as of January 2026
Condos & Townhomes
The average time spent on the market went up from 14 days in January 2025, to 68 days as of January 2026.
Single-Family Homes
The overbid percentage has increased from 113 3% last January 2025, to 114 4% a year later
Condos & Townhomes
The overbid percentage has increased from 101.1% last January 2025, to 105.1% a year later.

St. Francis Wood, Forest Hill, West Portal, Forest Knolls, Diamond Heights, Midtown Terrace, Miraloma Park, Sunnyside, Balboa Terrace, Ingleside Terrace, Mt Davidson Manor, Sherwood Forest, Monterey Heights, Westwood Highlands
There were 18 single-family homes for sale, providing 0.7 months of inventory. There were 22 new listings, and 4 homes sold at a median price of $1.7m. The median overbid percentage was at 109.2%, with an average of 31 days on the market.
There were 10 condo and townhome units for sale, providing 2.6 months of inventory. There were 8 new listings and 4 units sold at a median sale price of $634k. The median overbid percentage was at 97.3%, with an average of 169 days on the market.

22 New Listings
4 Sold Listings
0.7 Months of Inventory
$1.7M Median Sale Price
109.2%
Median Sale vs List
31 Avg Days on Market
The data, sourced from InfoSparks, includes all single-family homes, condos and townhomes in the California Area above from January 2025 to January 2026. This may include preliminary data, and may vary from the time the data was gathered. All data is deemed reliable but not guaranteed. DRE# 01995149. Copyright KW Advisors San Francisco | Napa Valley 2026. Each office is independently owned and operated.
8
New Listings
4 Sold Listings
2.6
Months of Inventory
$634K
Median Sale Price
97.3%
Median Sale vs List
169 Avg Days on Market

JANUARY 2025 - JANUARY 2026
Family Homes
2 months, year-over-year.
s & Townhomes
2 months, year-over-year
The median sale price has decreased from $2m last January 2025, to $1 7m as of January 2026
Condos & Townhomes
The median sale price has increased from $0 last January 2025, to $634k as of January 2026
The average time spent on the market went down from 55 days last January 2025, to 31 days as of January 2026
Condos & Townhomes
The average time spent on the market went up from 0 days in January 2025, to 169 days as of January 2026.
Single-Family Homes
The overbid percentage has increased from 102 8% last January 2025, to 109 2% a year later
Condos & Townhomes
The overbid percentage has increased from 0% last January 2025, to 97.3% a year later.
Noe Valley, Eureka Valley/Dolores Heights (Castro, Liberty Hill), Cole Valley, Glen Park, Corona Heights, Clarendon Heights, Ashbury Heights, Buena Vista Park, Haight Ashbury, Duboce Triangle, Twin Peaks, Mission Dolores, Parnassus Heights
There were 14 single-family homes for sale, providing 0.5 months of inventory. There were 19 new listings, and 10 homes sold at a median price of $4m. The median overbid percentage was at 108.8%, with an average of 100 days on the market.
There were 24 condo and townhome units for sale, providing 0 9 months of inventory There were 21 new listings and 5 units sold at a median sale price of $1.2m. The median overbid percentage was at 100%, with an average of 67 days on the market.
19 New Listings
10 Sold Listings
0.5 Months of Inventory
$4M Median Sale Price
108.8%
Median Sale vs List
100 Avg Days on Market
The data, sourced from InfoSparks, includes all single-family homes, condos and townhomes in the California Area above from January 2025 to January 2026. This may include preliminary data, and may vary from the time the data was gathered. All data is deemed reliable but not guaranteed. DRE# 01995149. Copyright KW Advisors San Francisco | Napa Valley 2026. Each office is independently owned and operated.
New Listings 0.9
Months of Inventory 100%
Median Sale vs List
Single-Family Homes
The median sale price has increased from $2 6m last January 2025, to $4m as of January 2026
Condos & Townhomes
The median sale price has increased from $1 2m last January 2025, to $1 26m as of January 2026
Single-Family Homes
The average time spent on the market went up from 50 days last January 2025, to 100 days as of January 2026
Condos & Townhomes
The average time spent on the market went down from 68 days in January 2025, to 67 days as of January 2026.
Single-Family Homes
The overbid percentage has increased from 103 9% last January 2025, to 108 8% a year later
Condos & Townhomes
The overbid percentage has remained the same from 100% last January 2025, to 100% a year later.

Hayes Valley, North of Pan Alamo Square, Western Ad Vista, Lower Pacific Heigh
There were 2 single-family ho providing 0.7 months of inve new listings, and 1 home sol $5.6m. The median overbid p 128 5%, with an average of 5
There were 20 condo and tow sale, providing 1 month of in 32 new listings and 10 units price of $1.1m. The median o was at 100%, with an average market.

homes, condos and January 2026. This may was gathered. All data is Copyright KW Advisors San Francisco | Napa Valley 2026. Each office is independently owned and operated.
32
New Listings
1 Month of Inventory
$1.1M
Median Sale Price 100%
Median Sale vs List 66 Avg Days on Market 10 Sold Listings

JANUARY 2025 - JANUARY 2026
Single-Family Homes
Last 12 months, year-over-year.
Condos & Townhomes
Last 12 months, year-over-year
The median sale price has increased from $2 5m last January 2025, to $5 6m as of January 2026
The median sale price has increased from $750k last January 2025, to $1 1m as of January 2026
The average time spent on the market went down from 68 days last January 2025, to 5 days as of January 2026
The average time spent on the market went down from 97 days in January 2025, to 66 days as of January 2026.
The overbid percentage has increased from 95% last January 2025, to 128 5% a year later
The overbid percentage has remained the same from 100% last January 2025, to 100% a year later.

Pacific Heights Hollow, Marina
There were 11 s providing 1.1 mo new listings, and of $4.9m. The m 97.9%, with an a
There were 25 c sale, providing 1 were 31 new list sale price of $1. percentage was days on the mar


Single-Family Homes
The median sale price has decreased from $5 6m last January 2025, to $4 9m as of January 2026
Condos & Townhomes
The median sale price has decreased from $1 6m last January 2025, to $1 3m as of January 2026
The average time spent on the market went down from 189 days last January 2025, to 61 days as of January 2026
Condos & Townhomes
The average time spent on the market went up from 60 days in January 2025, to 70 days as of January 2026.
Single-Family Homes
The overbid percentage has increased from 94 8% last January 2025, to 97 9% a year later
Condos & Townhomes
The overbid percentage has increased from 99.6% last January 2025, to 100% a year later.

0 Sold Listings
8 of Inventory
$0 Median Sale Price
% Sale vs List
0 Avg Days on Market
sourced from InfoSparks, includes all single-family homes, condos and in the California Area above from January 2025 to January 2026. This may preliminary data, and may vary from the time the data was gathered. All data is reliable but not guaranteed. DRE# 01995149. Copyright KW Advisors San Francisco | Napa Valley 2026. Each office is independently owned and operated.

JANUARY 2025 - JANUARY 2026
amily Homes months, year-over-year. & Townhomes
months, year-over-year
The median sale price has decreased from $3m last January 2025, to $0 as of January 2026
The median sale price has increased from $917k last January 2025, to $1m as of January 2026
The average time spent on the market went down from 6 days last January 2025, to 0 days as of January 2026
The average time spent on the market went down from 112 days in January 2025, to 91 days as of January 2026.
The overbid percentage has decreased from 103 6% last January 2025, to 0% a year later
Condos & Townhomes
The overbid percentage has increased from 98.8% last January 2025, to 100% a year later.

SoMa, South Beach, Mission Bay Hill, Dogpatch, Bernal Heights, In Mission, Yerba Buena
What's in the District 9 data?
There were 17 single-family homes f providing 0.8 months of inventory. T new listings, and 12 homes sold at a of $1.6m. The median overbid perce 109.1%, with an average of 48 days o
There were 158 condo and townhom sale, providing 2.3 months of invento were 107 new listings and 39 units s median sale price of $910k. The med percentage was at 98.5%, with an av days on the market.

2 Listings
1.6M ian Sale Price
8 Days on Market
single-family homes, condos and nuary 2025 to January 2026. This may the data was gathered. All data is 01995149. Copyright KW Advisors San Francisco | Napa Valley 2026. Each office is independently owned and operated.
2.3 Months of Inventory $ M 98.5%
Median Sale vs List Av

The median sale price has increased from $1 5m last January 2025, to $1 6m as of January 2026
Condos & Townhomes
The median sale price has increased from $845k last January 2025, to $910k as of January 2026
The average time spent on the market went down from 50 days last January 2025, to 48 days as of January 2026
Condos & Townhomes
The average time spent on the market went up from 112 days in January 2025, to 121 days as of January 2026.
Single-Family Homes
The overbid percentage has increased from 100 2% last January 2025, to 109 1% a year later
Condos & Townhomes
The overbid percentage has increased from 98.1% last January 2025, to 98.5% a year later.

Bayview, Bayview Heights
Portola, Visitacion Valley,
Mission Terrace, Crocker
Mission
There were 42 single-family h providing 1.2 months of inve new listings, and 12 homes s of $1m. The median overbid 111 7%, with an average of 1
There were 22 condo and tow sale, providing 4.3 months of were 15 new listings and 4 u sale price of $645k. The med percentage was at 99.4%, wi days on the market.
homes, condos and January 2026. This may was gathered. All data is Copyright KW Advisors San Francisco | Napa Valley 2026. Each office is independently owned and operated.
New Listings
4.3
Months of Inventory 99.4%
Median Sale vs List

The median sale price has increased from $1m last January 2025, to $1 09m as of January 2026
Condos & Townhomes
The median sale price has decreased from $702k last January 2025, to $645k as of January 2026
The average time spent on the market went down from 40 days last January 2025, to 10 days as of January 2026
Condos & Townhomes
The average time spent on the market went up from 74 days in January 2025, to 85 days as of January 2026.
Single-Family Homes
The overbid percentage has increased from 102 6% last January 2025, to 111 7% a year later
Condos & Townhomes
The overbid percentage has increased from 98.3% last January 2025, to 99.4% a year later.