


Jump to Milpitas Report
Jump to Fremont City Report
Jump to Newark Report
Jump to Union City Report
Jump to Hayward Report

Jump to Castro Valley Report
Jump to San Leandro Report
(Fremont, Newark & Union City)
Jump to Tri-Cities Report
Jump to Pleasanton Report
Jump to San Ramon Report
Jump to Livermore Report
Jump to Cupertino Report
Jump to Oakland Report
That's the question you should be asking yourself.
Our market is incredibly diverse and rapidly changing. Values vary not just by neighborhood but by street. Your home isn't necessarily worth what your neighbors' home is. It's the current market that sets the value of your home.
So, do you know what your home is worth in today's market?
Icanhelp...
Contact me for a confidential, no obligation assessment of your home's value.

Buying a home is one of the biggest purchases you’ll ever make. And homeowner’s insurance is what protects that investment. Think of it as your safety net. NerdWallet explains it:
Covers Repairs and Rebuilding Costs: If your home is damaged by fire, storms, or other covered events, it helps pay for repairs and possibly even a full rebuild, if that’s deemed necessary. Protects Your Belongings: It can also cover personal items like furniture, electronics, jewelry, and clothing if they’re stolen or damaged.
Provides Liability Coverage: And, if someone gets injured on your property, your policy can help cover medical bills or legal expenses.
But that peace of mind does come with a cost, and lately those costs have been rising.


Secure Your Dream Home Today

Navigating the mortgage application process can be a breeze with a little preparation. To ensure a successful application and closing, consider these helpful tips for what to avoid.


3
4 5 6 1 2
Avoid major purchases like furniture, cars, or vacations to keep your credit profile stable. Maintain your current employment to show financial stability. Always consult your mortgage professional before making large financial moves.
Avoid paying off debts or collections without professional advice.
Use verified funds for deposits to prevent closing delays.
Don't have your credit report pulled too many times - this can hurt your credit score.


In2024,thehomebuyingmarketfacessignificantchallenges highprices, steepinterestrates,andlimitedhousinginventory Formany,renovatingtheir currenthomeisamoreattractiveoptionthanpurchasinganewone.Whilethe LIRAreportpredictsadeclineinrenovationspending,expertsemphasizethat small-scaleupdatesortargetedlargerprojectscanstilldelivermajorbenefits.
Beforedivingintoarenovation,it’sessentialtoplan carefullyandbudgetwisely.Workingwithreputable professionalsiskey,especiallythoseoffering financingoptionsandtransferablewarranties.Sharing yourbudgetwithcontractorsupfrontandinvolving designersearlyensuresthatyourrenovationruns smoothlyandachievesbothfinancialandfunctional success Adetailedplanwillkeeptheprojectontrack andhelpavoidcostlysurprises


Bathrooms are a safe investment. Simple changes like a new vanity, upgraded flooring, or fresh lighting can completely transform the space. For a luxurious touch, consider adding a freestanding tub for a spa-like experience


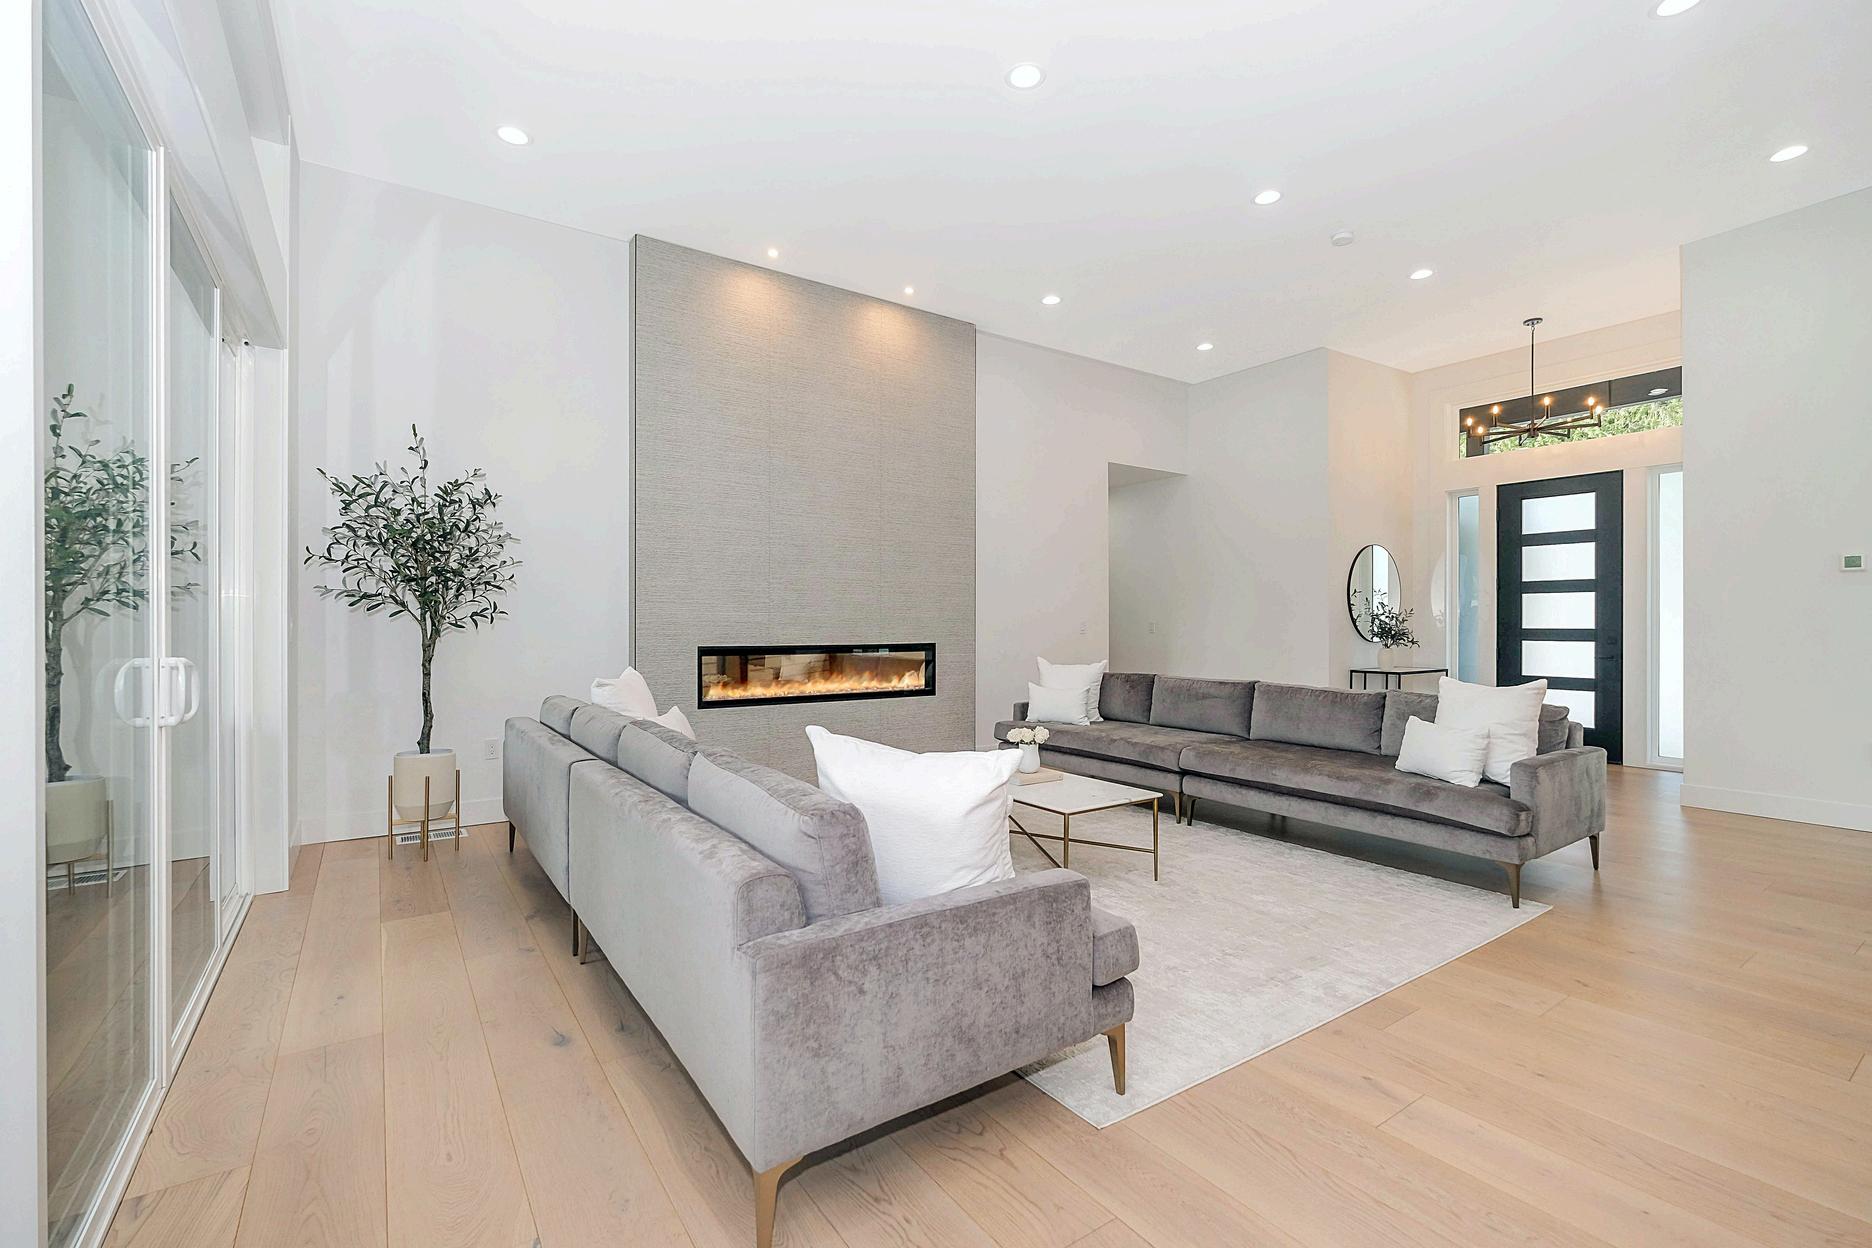
The kitchen is a crucial space for resale value. Opening up the space or adding functional features can make a big difference Smaller updates, like upgrading appliances, cabinets, or flooring, can give your kitchen a fresh, modern feel


Bold design choices, such as statement wallpaper, unique lighting, or striking color palettes, can refresh any room. Layering textiles or mixing traditional and modern styles creates a space that feels cohesive and impactful


Renovations focusing on health are becoming increasingly popular. Use non-toxic materials free from Red List chemicals like BPA and VOCs. Consider adding air purifiers, water filtration systems, and better ventilation to create a healthier living environment


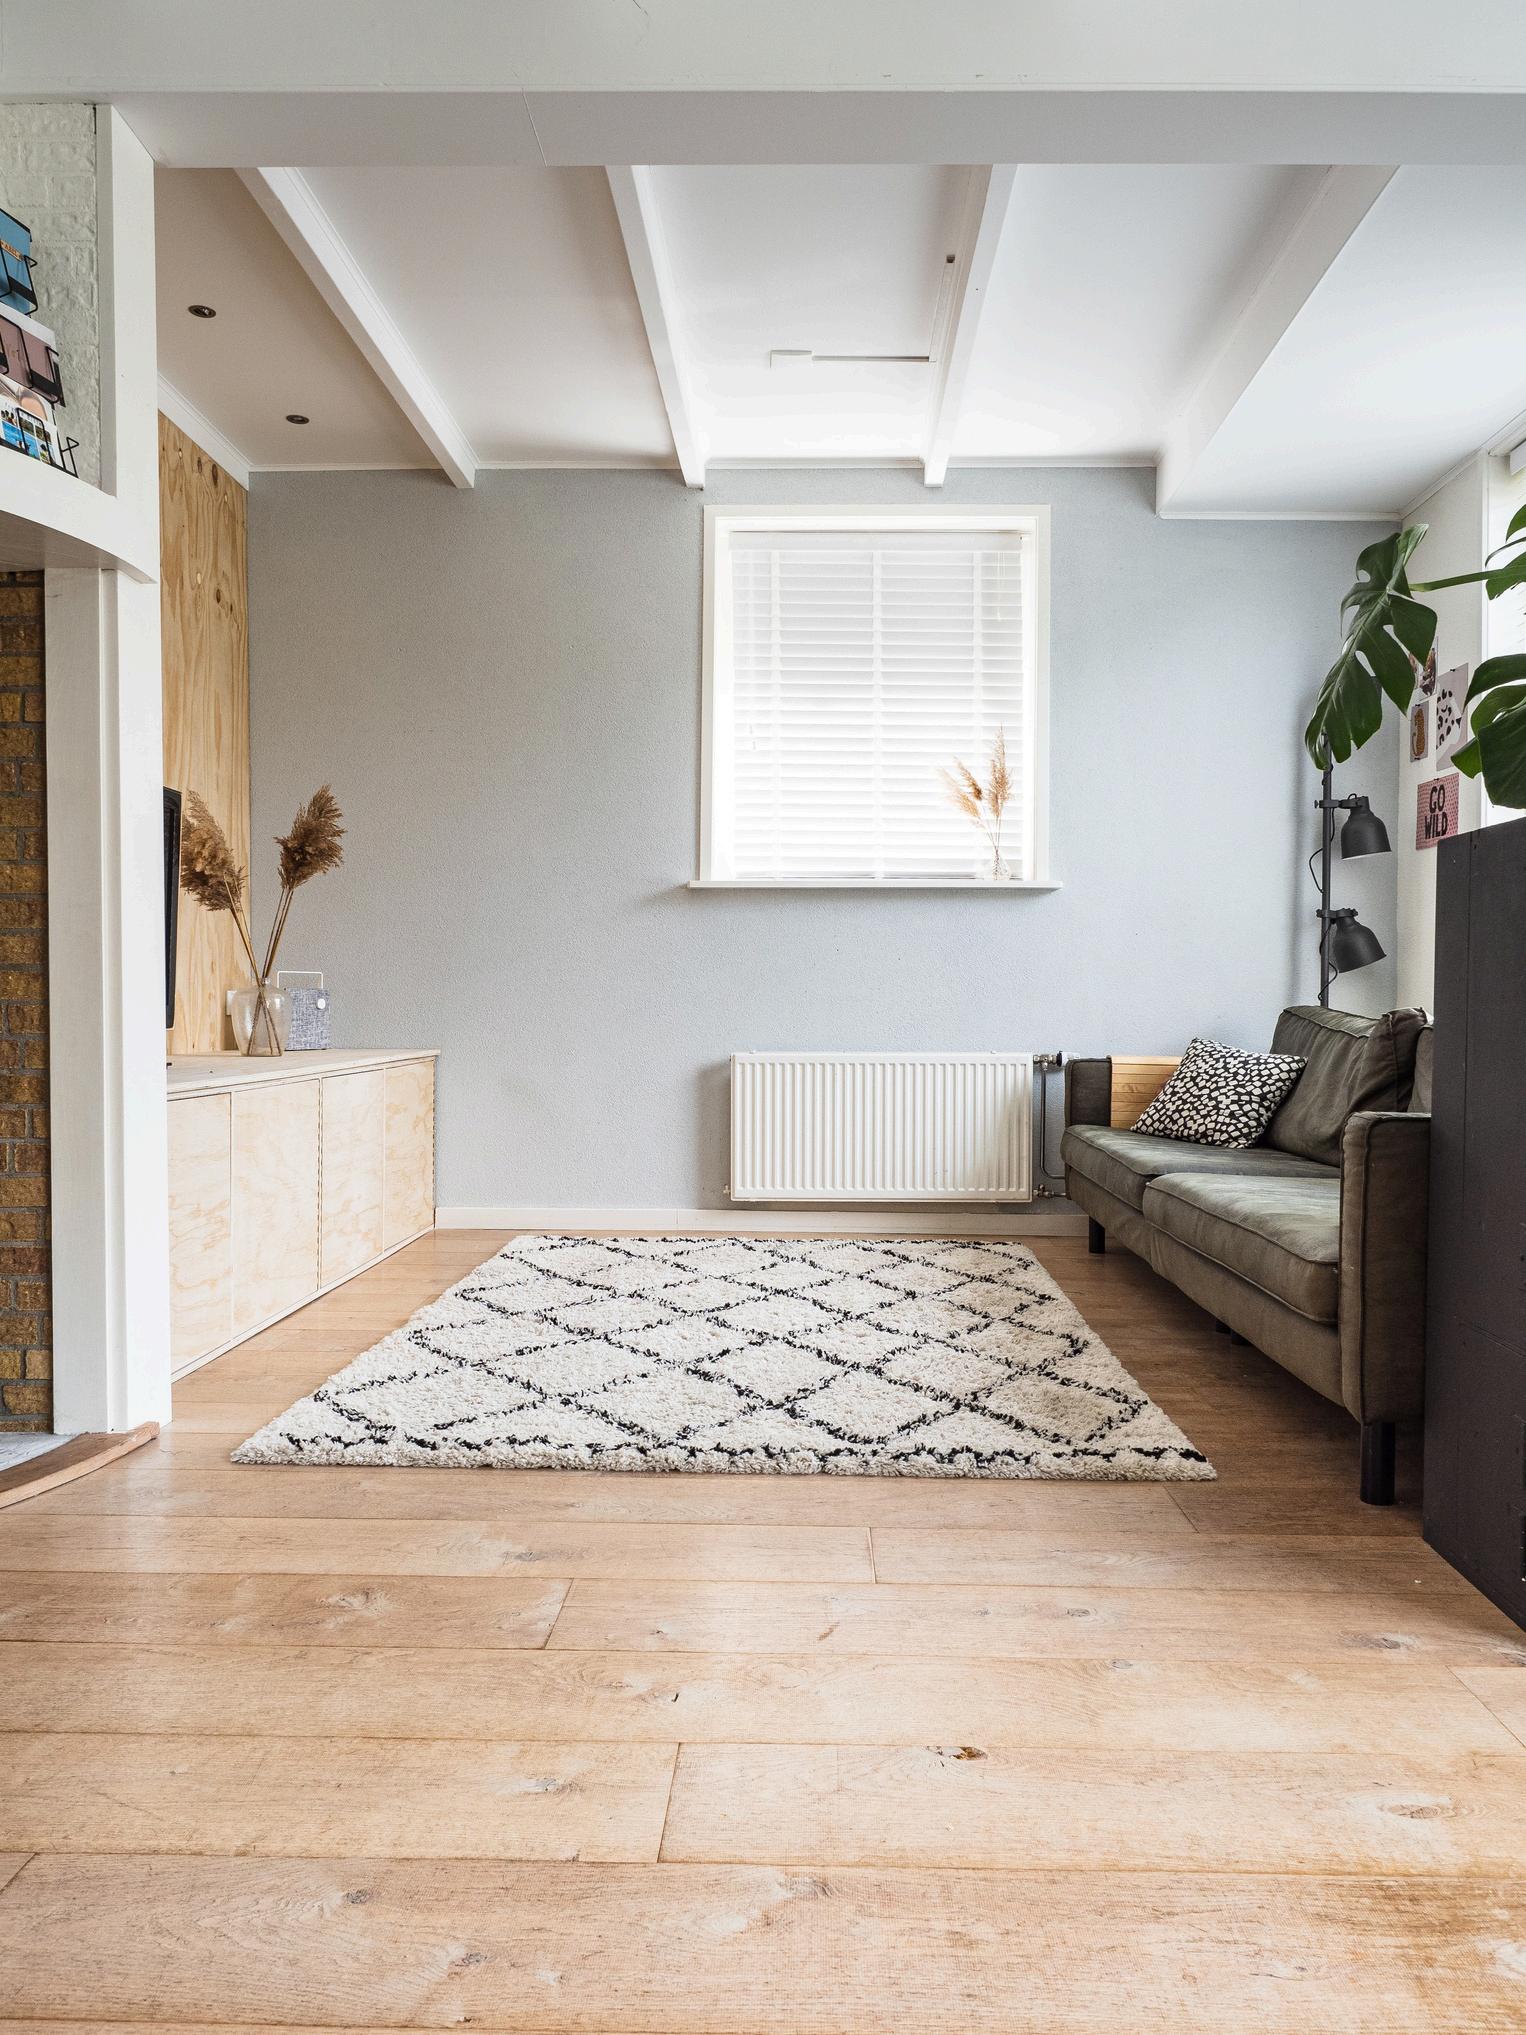
First impressions matter, and curb appeal can greatly impact your home's value. Exterior upgrades like siding, roofing, and landscaping enhance both aesthetics and security. Adding outdoor living spaces, such as a garden or entertainment area, boosts appeal even more.


Tailor renovations to your family’s lifestyle. Flexible spaces that accommodate workfrom-home needs, growing children, or future buyers will add lasting value. Think about both how your family uses the space and how it will appeal to future buyers.

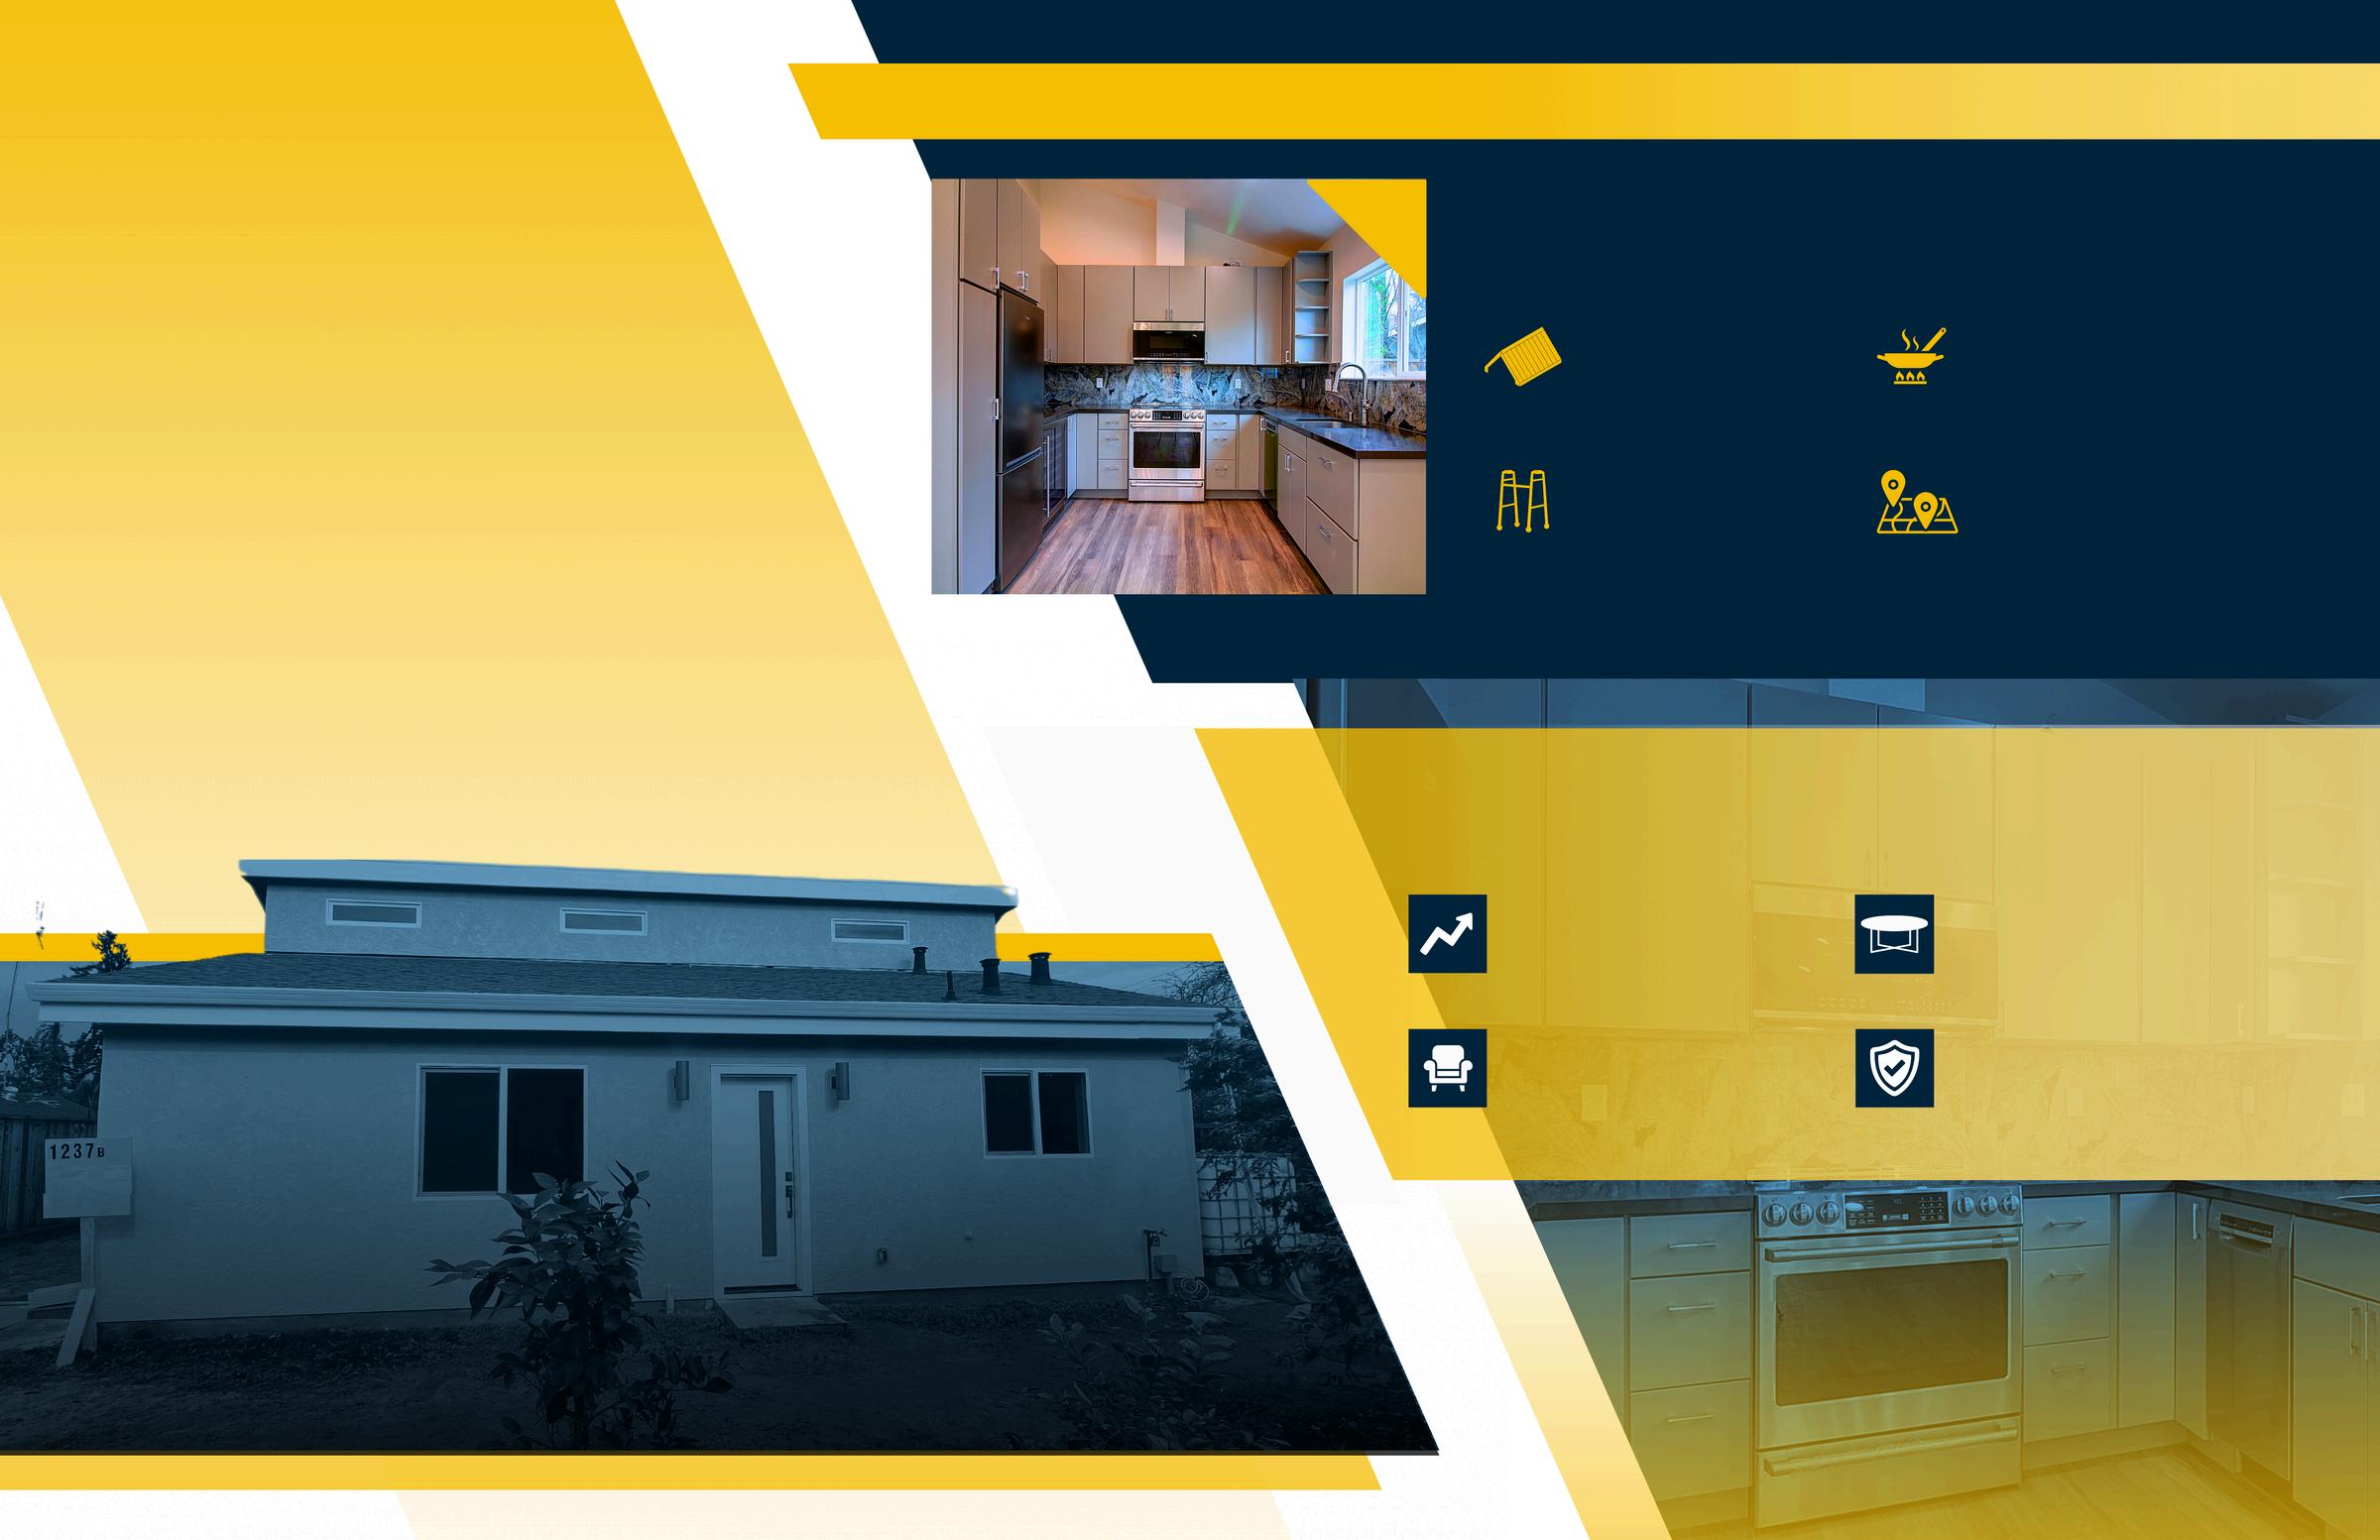

The Anenberg-Essert family in Campbell collaborated with Acton ADU to create a versatile, comfortable, and valuable addition to their property. This ADU project is a shining example of how a well-designed accessory dwelling unit can increase property value and serve a family’s unique needs.
The family envisioned an ADU that would function as an independent living space for family members, enhance their property’s worth, and provide seamless integration with the main home They wanted a space that balanced privacy with connectivity, feeling like a natural extension of their residence
Constructed at 747 square feet, this ADU was designed with modern, high-quality finishes to serve both aesthetic and practical needs. Key features include:
Vaulted Ceilings
Creates a spacious, open atmosphere
Senior-Friendly Living
Safe, independent space for elderly family members
Fully Equipped Kitchen
Modern amenities for everyday convenience
Open Living Area
Multipurpose area for relaxation and entertainment
The completion of the Anenberg-Essert ADU led to several valuable outcomes:
Increased Property Value
The ADU addition significantly boosted property value
Flexible Living Space
A versatile space for family, guests, or as a rental
Modern Comforts
High-end finishes and amenities enhance both function and style.
Enhanced Family Living
The ADU enriches the AnenbergEssert family’s home with both privacy and connection

Thinking about how an ADU could fit into your family’s lifestyle or property investment strategy?
Trust Acton ADU to guide you every step of the way.

When it comes to home ownership, knowing who you can trust is crucial. That's why we've curated a select list of trusted vendors who are ready to help with your home goals.


There were 12 single-family homes for sale, providing 2.4 months of inventory. There were 20 new listings, and 5 homes sold at a median price of $1 4m The median overbid percentage was at 99.2%, with an average of 31 days on the market.
There were 16 condo and townhome units for sale, providing 2.3 months of inventory. There were 23 new listings and 7 units sold at a median sale price of $1m. The median overbid percentage was at 98.5%, with an average of 81 days on the market

20 New Listings
5 Sold Listings
2.4 Months of Inventory
$1.4M Median Sale Price
99.2%
Median Sale vs List
31 Avg Days on Market
The data, sourced from Courted.io, includes all single-family homes, condos and townhomes in the California Area from January 2025 to January 2026. This may include preliminary data, and may vary from the time the data was gathered. All data is deemed reliable but not guaranteed. DRE# 01345026. Copyright KW Advisors Fremont 2026. Each office is independently owned and operated.
New Listings
2.3
Months of Inventory 98.5%
Median Sale vs List
Single-Family Homes
The median sale price has decreased from $1 6m last January 2025, to $1 4m as of January 2026
Condos & Townhomes
The median sale price has decreased from $1 06m last January 2025, to $1 03m as of January 2026
The average time spent on the market went up from 13 days last January 2025, to 31 days as of January 2026
Condos & Townhomes
The average time spent on the market went up from 20 days in January 2025, to 81 days as of January 2026.
Single-Family Homes
The overbid percentage has decreased from 105 1% last January 2025, to 99 2% a year later
Condos & Townhomes
The overbid percentage has decreased from 104% last January 2025, to 98.5% a year later.
There were 151 single-family homes for sale, providing 9.1 months of inventory. There were 46 new listings, and 17 homes sold at a median price of $1.4m. The median overbid percentage was at 103.9%, with an average of 27 days on the market.
There were 152 condo and townhome units for sale, providing 7.2 months of inventory. There were 44 new listings and 21 units sold at a median sale price of $661k. The median overbid percentage was at 98.6%, with an average of 53 days on the market.

46 New Listings
17 Sold Listings
9.1 Months of Inventory
$1.4M Median Sale Price
103.9%
Median Sale vs List
27 Avg Days on Market
The data, sourced from Courted.io, includes all single-family homes, condos and townhomes in the California Area from January 2025 to January 2026. This may include preliminary data, and may vary from the time the data was gathered. All data is deemed reliable but not guaranteed. DRE# 01345026. Copyright KW Advisors Fremont 2026. Each office is independently owned and operated.
44
New Listings 7.2
21 Sold Listings
Months of Inventory $661K
Median Sale Price 98.6%
Median Sale vs List 53 Avg Days on Market

JANUARY 2025 - JANUARY 2026
Single-Family Homes
Last 12 months, year-over-year.
Condos & Townhomes
Last 12 months, year-over-year
The median sale price has decreased from $1 7m last January 2025, to $1 4m as of January 2026
Condos & Townhomes
The median sale price has decreased from $712k last January 2025, to $661k as of January 2026
The average time spent on the market went up from 16 days last January 2025, to 27 days as of January 2026
Condos & Townhomes
The average time spent on the market went up from 34 days in January 2025, to 53 days as of January 2026.
Single-Family Homes
The overbid percentage has decreased from 107 6% last January 2025, to 103 9% a year later
Condos & Townhomes
The overbid percentage has decreased from 99.9% last January 2025, to 98.6% a year later.

There were 54 single-family h providing 10.8 months of inv new listings, and 5 homes so of $1.4m. The median overbi 101.7%, with an average of 4
There were 21 condo and tow sale, providing 7 months of in 3 new listings and 3 units so price of $685k. The median o was at 100.4%, with an avera market.
homes, condos and 2026. This may include gathered. All data is deemed Advisors Fremont 2026.

The median sale price has decreased from $1 48m last January 2025, to $1 4m as of January 2026
Condos & Townhomes
The median sale price has increased from $437k last January 2025, to $685k as of January 2026
The average time spent on the market went up from 17 days last January 2025, to 47 days as of January 2026
Condos & Townhomes
The average time spent on the market went down from 50 days in January 2025, to 9 days as of January 2026.
Single-Family Homes
The overbid percentage has decreased from 106 3% last January 2025, to 101 7% a year later
Condos & Townhomes
The overbid percentage has increased from 97.2% last January 2025, to 100.4% a year later.

There were 42 single-family h providing 6 months of invent new listings, and 7 homes so of $1.3m. The median overbi 100.1%, with an average of 2
There were 31 condo and tow sale, providing 15.5 months o were 11 new listings and 2 u sale price of $660k. The med percentage was at 103.4%, w days on the market.

homes, condos and 2026. This may include gathered. All data is deemed Advisors Fremont 2026.
New Listings
2
Sold Listings
15.5
Months of Inventory
103.4%
Median Sale vs List
$660K
Median Sale Price
39
Avg Days on Market

JANUARY 2025 - JANUARY 2026
Family Homes
2 months, year-over-year.
s & Townhomes
2 months, year-over-year
The median sale price has decreased from $1 4m last January 2025, to $1 3m as of January 2026
Condos & Townhomes
The median sale price has increased from $600k last January 2025, to $660k as of January 2026
The average time spent on the market went up from 7 days last January 2025, to 25 days as of January 2026
Condos & Townhomes
The average time spent on the market went up from 28 days in January 2025, to 39 days as of January 2026.
Single-Family Homes
The overbid percentage has decreased from 104 2% last January 2025, to 100 1% a year later
Condos & Townhomes
The overbid percentage has increased from 97.9% last January 2025, to 103.4% a year later.

There were 145 single-family homes for sale, providing 6 months of inventory. There were new listings, and 24 homes sold at a median of $890k. The median overbid percentage wa 103.1%, with an average of 30 days on the m
There were 112 condo and townhome units f sale, providing 14 months of inventory. There 20 new listings and 8 units sold at a median price of $692k. The median overbid percenta was at 100.6%, with an average of 72 days on market.


JANUARY 2025 - JANUARY 2026
Single-Family Homes
Last 12 months, year-over-year.
Condos & Townhomes
Last 12 months, year-over-year
The median sale price has decreased from $916k last January 2025, to $890k as of January 2026
Condos & Townhomes
The median sale price has decreased from $722k last January 2025, to $692k as of January 2026
The average time spent on the market went up from 28 days last January 2025, to 30 days as of January 2026
Condos & Townhomes
The average time spent on the market went up from 68 days in January 2025, to 72 days as of January 2026.
The overbid percentage has decreased from 104 8% last January 2025, to 103 1% a year later
Condos & Townhomes
The overbid percentage has increased from 100.2% last January 2025, to 100.6% a year later.

There were 64 single-family homes for sale, providing 6.4 months of inventory. There were 17 new listings, and 10 homes sold at a median price of $1m. The median overbid percentage was at 100 7%, with an average of 35 days on the market
There were 21 condo and townhome units for sale, providing 21 months of inventory. There were 5 new listings and 1 unit sold at a median sale price of $699k. The median overbid percentage was at 100%, with an average of 96 days on the market.

17 New Listings
10 Sold Listings
6.4 Months of Inventory
$1M Median Sale Price
100.7%
Median Sale vs List
35 Avg Days on Market
The data, sourced from Courted.io, includes all single-family homes, condos and townhomes in the California Area from January 2025 to January 2026. This may include preliminary data, and may vary from the time the data was gathered. All data is deemed reliable but not guaranteed. DRE# 01345026. Copyright KW Advisors Fremont 2026. Each office is independently owned and operated.

JANUARY 2025 - JANUARY 2026
Single-Family Homes
Last 12 months, year-over-year.
Condos & Townhomes
Last 12 months, year-over-year
Single-Family Homes
The median sale price has decreased from $1 2m last January 2025, to $1m as of January 2026
Condos & Townhomes
The median sale price has increased from $588k last January 2025, to $699k as of January 2026
Single-Family Homes
The average time spent on the market went up from 30 days last January 2025, to 35 days as of January 2026
The average time spent on the market went up from 36 days in January 2025, to 96 days as of January 2026.
Single-Family Homes
The overbid percentage has decreased from 102 9% last January 2025, to 100 7% a year later
Condos & Townhomes
The overbid percentage has increased from 97.6% last January 2025, to 100% a year later.

There were 79 single-family homes for sale, providing 4.2 months of inventory. There were 27 new listings, and 19 homes sold at a median price of $895k. The median overbid percentage was at 102 7%, with an average of 32 days on the market
There were 37 condo and townhome units for sale, providing 5.3 months of inventory. There were 5 new listings and 7 units sold at a median sale price of $434k. The median overbid percentage was at 100.9%, with an average of 86 days on the market.

27 New Listings
19 Sold Listings
4.2 Months of Inventory
$895K Median Sale Price
102.7%
Median Sale vs List
32 Avg Days on Market
The data, sourced from Courted.io, includes all single-family homes, condos and townhomes in the California Area from January 2025 to January 2026. This may include preliminary data, and may vary from the time the data was gathered. All data is deemed reliable but not guaranteed. DRE# 01345026. Copyright KW Advisors Fremont 2026. Each office is independently owned and operated.
5
New Listings
7 Sold Listings
5.3
Months of Inventory
$434K
Median Sale Price
100.9%
Median Sale vs List 86
Avg Days on Market

JANUARY 2025 - JANUARY 2026
Single-Family Homes
Last 12 months, year-over-year.
Condos & Townhomes
Last 12 months, year-over-year
The median sale price has increased from $82k last January 2025, to $895k as of January 2026
The median sale price has decreased from $525k last January 2025, to $434k as of January 2026
The average time spent on the market went up from 29 days last January 2025, to 32 days as of January 2026
The average time spent on the market went up from 64 days in January 2025, to 86 days as of January 2026.
The overbid percentage has increased from 98 1% last January 2025, to 102 7% a year later
The overbid percentage has increased from 99.7% last January 2025, to 100.9% a year later.

There were 250 single-family homes for sale, providing 8 6 months of inventory There were 73 new listings, and 29 homes sold at a median price of $1.4m. The median overbid percentage was at 102.6%, with an average of 30 days on the market.
There were 204 condo and townhome units for sale, providing 7.8 months of inventory. There were 58 new listings and 26 units sold at a median sale price of $704k The median overbid percentage was at 99.2%, with an average of 47 days on the market.

73 New Listings
29 Sold Listings
8.6 Months of Inventory
$1.4M Median Sale Price
102.6%
Median Sale vs List
30 Avg Days on Market
The data, sourced from Courted.io, includes all single-family homes, condos and townhomes in the California Area from January 2025 to January 2026. This may include preliminary data, and may vary from the time the data was gathered. All data is deemed reliable but not guaranteed. DRE# 01345026. Copyright KW Advisors Fremont 2026. Each office is independently owned and operated.
58 New Listings
26 Sold Listings
7.8
Months of Inventory $704K
Median Sale Price 99.2%
Median Sale vs List 47 Avg Days on Market

JANUARY 2025 - JANUARY 2026
Family Homes
2 months, year-over-year.
s & Townhomes
2 months, year-over-year
The median sale price has decreased from $1 5m last January 2025, to $1 4m as of January 2026
The median sale price has increased from $630k last January 2025, to $704k as of January 2026
The average time spent on the market went up from 14 days last January 2025, to 30 days as of January 2026
The average time spent on the market went up from 35 days in January 2025, to 47 days as of January 2026.
The overbid percentage has decreased from 106 5% last January 2025, to 102 6% a year later
Condos & Townhomes
The overbid percentage has remained the same from 99.2% last January 2025, to 99.2% a year later.

There were 151 single-family providing 7.2 months of inve new listings, and 21 homes s of $1.6m. The median overbi 99%, with an average of 32 d
There were 50 condo and tow sale, providing 10 months of 10 new listings and 5 units s price of $757k. The median o was at 98.4%, with an averag market.

homes, condos and 2026. This may include gathered. All data is deemed Advisors Fremont 2026.
New Listings 10 Months of Inventory 98.4%
Median Sale vs List

The median sale price has decreased from $2m last January 2025, to $1 6m as of January 2026
Condos & Townhomes
The median sale price has increased from $705k last January 2025, to $757k as of January 2026
The average time spent on the market went up from 23 days last January 2025, to 32 days as of January 2026
Condos & Townhomes
The average time spent on the market went up from 27 days in January 2025, to 68 days as of January 2026.
Single-Family Homes
The overbid percentage has decreased from 99 4% last January 2025, to 99% a year later
Condos & Townhomes
The overbid percentage has decreased from 100.1% last January 2025, to 98.4% a year later.

There were 124 single-family homes for sale, providing 10.3 months of inventory. There were 30 new listings, and 12 homes sold at a median price of $1.5m. The median overbid percentage was at 98.2%, with an average of 28 days on the market.
There were 128 condo and townhome units for sale, providing 9.8 months of inventory. There were 21 new listings and 13 units sold at a median sale price of $681k. The median overbid percentage was at 98.2%, with an average of 65 days on the market.

30 New Listings
12 Sold Listings
10.3 Months of Inventory
$1.5M Median Sale Price
98.2%
Median Sale vs List
28 Avg Days on Market
The data, sourced from Courted.io, includes all single-family homes, condos and townhomes in the California Area from January 2025 to January 2026. This may include preliminary data, and may vary from the time the data was gathered. All data is deemed reliable but not guaranteed. DRE# 01345026. Copyright KW Advisors Fremont 2026. Each office is independently owned and operated.

The median sale price has decreased from $1 8m last January 2025, to $1 5m as of January 2026
Condos & Townhomes
The median sale price has decreased from $986k last January 2025, to $681k as of January 2026
The average time spent on the market went up from 23 days last January 2025, to 28 days as of January 2026
Condos & Townhomes
The average time spent on the market went up from 26 days in January 2025, to 65 days as of January 2026.
Single-Family Homes
The overbid percentage has decreased from 100 4% last January 2025, to 98 2% a year later
Condos & Townhomes
The overbid percentage has increased from 97.8% last January 2025, to 98.2% a year later.

There were 160 single-family providing 6.7 months of inve new listings, and 24 homes s of $1.3m. The median overbi 99.4%, with an average of 33
There were 92 condo and tow sale, providing 13.1 months o were 27 new listings and 7 u sale price of $637k. The med percentage was at 98.4%, wi days on the market.
homes, condos and 2026. This may include gathered. All data is deemed Advisors Fremont 2026.
JANUARY 2025 - JANUARY 2026
mes year-over-year.
omes year-over-year
Single-Family Homes
The median sale price has increased from $1 1m last January 2025, to $1 3m as of January 2026
Condos & Townhomes
The median sale price has decreased from $889k last January 2025, to $637k as of January 2026
The average time spent on the market went up from 26 days last January 2025, to 33 days as of January 2026
Condos & Townhomes
The average time spent on the market went down from 98 days in January 2025, to 28 days as of January 2026.
Single-Family Homes
The overbid percentage has decreased from 102 8% last January 2025, to 99 4% a year later
Condos & Townhomes
The overbid percentage has increased from 96.4% last January 2025, to 98.4% a year later.

There were 14 single-family h providing 1.4 months of inve new listings, and 10 homes s of $3.7m. The median overbi 105.6%, with an average of 4
There were 5 condo and tow providing 5 months of invent new listings and 1 unit sold a of $975k. The median overbi 98.6%, with an average of 14
homes, condos and 2026. This may include gathered. All data is deemed Advisors Fremont 2026.
3 New Listings 5 Months of Inventory 98.6%
Median Sale vs List

The median sale price has increased from $3 1m last January 2025, to $3 7m as of January 2026
Condos & Townhomes
The median sale price has decreased from $1 1m last January 2025, to $975k as of January 2026
The average time spent on the market went up from 26 days last January 2025, to 44 days as of January 2026
Condos & Townhomes
The average time spent on the market went up from 55 days in January 2025, to 147 days as of January 2026.
Single-Family Homes
The overbid percentage has decreased from 108 1% last January 2025, to 105 6% a year later
Condos & Townhomes
The overbid percentage has decreased from 99.9% last January 2025, to 98.6% a year later.

There were 666 single-family homes for sale, providing 8.5 months of inventory. There were 179 new listings, and 78 homes sold at a median price of $766k. The median overbid percentage was at 105.5%, with an average of 46 days on the market.
There were 365 condo and townhome units for sale, providing 15.9 months of inventory. There were 70 new listings and 23 units sold at a median sale price of $477k. The median overbid percentage was at 98.3%, with an average of 96 days on the market.
New Listings
15.9
Months of Inventory 98.3%
Median Sale vs List

The median sale price has decreased from $800k last January 2025, to $766k as of January 2026
Condos & Townhomes
The median sale price has decreased from $511k last January 2025, to $477k as of January 2026
The average time spent on the market went down from 51 days last January 2025, to 46 days as of January 2026
Condos & Townhomes
The average time spent on the market went up from 55 days in January 2025, to 96 days as of January 2026.
Single-Family Homes
The overbid percentage has increased from 104 3% last January 2025, to 105 5% a year later
Condos & Townhomes
The overbid percentage has increased from 97.1% last January 2025, to 98.3% a year later.