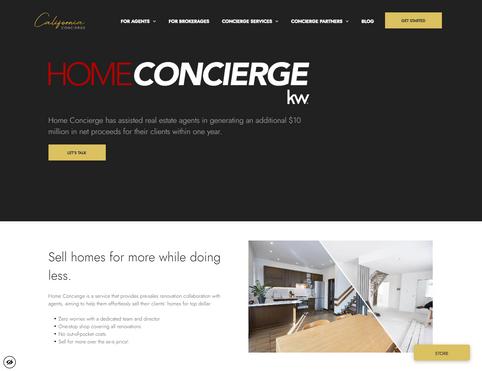
That's the question you should be asking yourself.
Our market is incredibly diverse and rapidly changing. Values vary not just by neighborhood but by street. Your home isn't necessarily worth what your neighbors' home is. It's the current market that sets the value of your home.
So, do you know what your home is worth in today's market?
Icanhelp...
Contact me for a confidential, no obligation assessment of your home's value.
Finding the right home is one of the biggest challenges for potential buyers today. Right now, the supply of homes for sale is still low. But there is a bright spot. Newly built homes make up a larger percent of the total homes available for sale than normal. That’s why, if you’re craving more options, it makes sense to see if a newly built home is right for you.
But it’s important to remember the process of working with a builder is different than buying from a homeowner. And, while builders typically have sales agents on-site, having your own agent helps make sure you have proper representation throughout your homebuying journey. As Realtor.com says:
“Keep in mind that the on-site agent you meet at a new-construction office works for the builder. So, as the homebuyer, it’s a smart idea to bring in your own agent, as well, to help you negotiate and stay protected in the transaction.”
Here’s how having your own agent is key when you build or buy a new construction home.
WHAT ARE PREPAID COSTS
WHEN BUYING A HOME?
Embarking on the journey of homeownership brings both excitement and unexpected costs. Closing fees, down payments, and more can catch you off guard. American Home Shield is here to break down the upfront expenses and help you navigate the homebuying process confidently.
Unraveling the mystery of prepaid costs in home buying! These serve as a safety net for lenders, covering taxes, interest, and insurance. Here's a breakdown:
1
2
Prepaid interest on a mortgage:
Pay interest from closing to month-end. Opt for a month-end closing to minimize this cost.
Prepaid property taxes at closing:
Sellers settle their owed taxes at closing, and you prepay from your escrow account.
3
4
Prepaid homeowners insurance at closing:
Cover one year in advance, ensuring your lender that potential damages will be addressed.
Initial escrow payment at closing:
Acts as a deposit (earnest money) for future insurance or tax payments, showing commitment to the purchase.
While it might seem complex, prepaid costs are expenses you'd pay anyhow. They ease the burden on buyers by handling crucial payments, streamlining the process and leaving you with fewer tasks on your homeowner checklist
What are prepaid costs when buying a home? READY TO GET STARTED?
Contact me, your Real Estate Expert, for support and to learn more about AHS.
Looking to lighten the mood in your laundry room?
EIGHTEYECATCHING
Laundry Room Colors
To Look Out For
These refreshing colors make the wash-and-dry chore a little more pleasant.
Tranquil Blue
View it here
Eight Colrs fo Laundry
Sage Green
View it here
White
View it here
Yellow
View it here
Gray
View it here
Dusty Pink
View it here
View it here
Navy Blue Purple
View it here
Create a tranquil laundry space with Benjamin Moore's Beach Glass Its light blue shade, coupled with a subtle gray undertone, offers a clean and versatile aesthetic that avoids any baby nursery associations.
Transform your space with earthy tones like October Mist and Gloucester Sage from Benjamin Moore Test out the trendy sage in your laundry room for a lowcommitment update easy to change and customize, ensuring lasting satisfaction with your design choice.
Create an elegant laundry room with Chantilly Lace by Benjamin Moore The classic white choice adds sophistication, opens up the space, and simplifies stain detection
Elevate your laundry space with the energizing touch of yellow. Behr's Roasted Corn or Upbeat bring warmth and optimism, while Pearly White offers a mellow option a yellow-based white that brings a perfect harmony of vibrancy and calmness.
Gray remains a top choice for laundry room walls, providing a timeless and serene backdrop A soft gray for a whisper of sophistication, easily personalized with printed patterned tile flooring or Behr's bold 2024 Color of the Year, Cracked Pepper
Sherwin-Williams' Rosebud for a touch of romance in laundry rooms. The dusty pink hue, paired with gold accents, adds a luxurious and warm atmosphere.
Navy as the key to a striking laundry room Beyond lighter blues, navy paired with lighter accents or white fixtures, especially Benjamin Moore's Hale Navy, creates a bold choice that makes the laundry room stand out.
Dare to take a style risk in your laundry room with a pop of color. Opt for the subtle smoky lavender of Farrow & Ball's Peignoir for a neutral touch or go all-out glam with Backdrop's dark and vampy McQueen, drawing inspiration from the famous fashion designer.
When it comes to homeownership, knowing who you can trust is crucial. That's why we've curated a select list of trusted vendors who are ready to help with your home goals.
Milpitas
What's in the Milpitas data?
There were 26 single-family homes for sale, providing 2.2 months of inventory. There were 12 new listings, and 10 homes sold at a median price of $1.4m. The median overbid percentage was at 100.2%, with an average of 15 days on the market.
There were 35 condo and townhome units for sale, providing 1.7 months of inventory. There were 15 new listings and 8 units sold at a median sale price of $1m. The median overbid percentage was at 102.8%, with an average of 15 days on the market.
SFH
Single-Family Homes
12 New Listings
10 Sold Listings
2.2 Months of Inventory
$1.4M
Median Sale Price
100.2%
Median Sale vs List
15 Avg Days on Market
The data, sourced from Broker Metrics, includes all single-family homes, condos and townhomes in the California Area from January 2023 to January 2024. This may include preliminary data, and may vary from the time the data was gathered. All data is deemed reliable but not guaranteed. DRE# 01345026. Copyright KW Advisors Fremont 2024. Each office is independently owned and operated.
New Listings
1.7
Months of Inventory
102.8%
Median Sale vs List
Median SalesPrice
Single-Family Homes
The median sales price has increased from $1 3m last January 2023, to $1 4m as of January 2024
Condos & Townhomes
The median sales price has increased from $930k last January 2023, to $1m as of January 2024
AVGDays OntheMarket
Single-Family Homes
The average time spent on the market went up from 14 days last January 2023, to 15 days as of January 2024
Condos & Townhomes
The average time spent on the market went down from 59 days in January 2023, to 15 days as of January 2024.
Overbids
Single-Family Homes
The overbid percentage has decreased from 100 4% last January 2023, to 100 2% a year later
Condos & Townhomes
The overbid percentage has increased from 95.3% last January 2023, to 102.8% a year later.
Fremont
What's in the Fremont data?
There were 103 single-family homes for sale, providing 0.7 months of inventory. There were 75 new listings, and 42 homes sold at a median price of $1.6m. The median overbid percentage was at 104.6%, with an average of 13 days on the market.
There were 83 condo and townhome units for sale, providing 1.7 months of inventory. There were 43 new listings and 21 units sold at a median sale price of $720k. The median overbid percentage was at 99.4%, with an average of 21 days on the market.
SFH
Single-Family Homes
75 New Listings
42 Sold Listings
0.7 Months of Inventory
$1.6M
Median Sale Price
104.6%
Median Sale vs List
13 Avg Days on Market
The data, sourced from Broker Metrics, includes all single-family homes, condos and townhomes in the California Area from January 2023 to January 2024. This may include preliminary data, and may vary from the time the data was gathered. All data is deemed reliable but not guaranteed. DRE# 01345026. Copyright KW Advisors Fremont 2024. Each office is independently owned and operated.
43
New Listings
21 Sold Listings
1.7
Months of Inventory
$720K
Median Sale Price 99.4%
Median Sale vs List 21 Avg Days on Market
JANUARY 2023 - JANUARY 2024
Single-Family Homes
Last 12 months, year-over-year.
Condos & Townhomes
Last 12 months, year-over-year
Median SalesPrice
Single-Family Homes
The median sales price has increased from $1 3m last January 2023, to $1 6m as of January 2024
Condos & Townhomes
The median sales price has decreased from $1m last January 2023, to $720k as of January 2024
AVGDays OntheMarket
Single-Family Homes
The average time spent on the market went down from 36 days last January 2023, to 13 days as of January 2024
Condos & Townhomes
The average time spent on the market went down from 34 days in January 2023, to 21 days as of January 2024.
Overbids
Single-Family Homes
The overbid percentage has increased from 96 8% last January 2023, to 104 6% a year later
Condos & Townhomes
The overbid percentage has increased from 95.5% last January 2023, to 99.4% a year later.
Newark
What's in the New
There were 28 single-family h providing 0.3 months of inve new listings, and 7 homes so of $1.7m. The median overbi 100.4%, with an average of 1
There were 18 condo and tow sale, providing 1.5 months of were 13 new listings and 2 u sale price of $997k. The med percentage was at 109%, wit days on the market.
SFH
Single-Family Homes
17 New Listings
0.3 Months of Inventory
100.4%
Median Sale vs List
7 Sold Listings
$1.7M
Median Sale Price
15 Avg Days on Market
The data, sourced from Broker Metrics, includes all single-family homes, condos and townhomes in the California Area from January 2023 to January 2024. This may include preliminary data, and may vary from the time the data was gathered. All data is deemed reliable but not guaranteed. DRE# 01345026. Copyright KW Advisors Fremont 2024. Each office is independently owned and operated.
New Listings
2
Sold Listings
1.5
Months of Inventory
$997K
Median Sale Price 109%
Median Sale vs List
9 Avg Days on Market
Median SalesPrice
Single-Family Homes
The median sales price has increased from $1m last January 2023, to $1 7m as of January 2024
Condos & Townhomes
The median sales price has increased from $643k last January 2023, to $997k as of January 2024
AVGDays OntheMarket
Single-Family Homes
The average time spent on the market went down from 18 days last January 2023, to 15 days as of January 2024
Condos & Townhomes
The average time spent on the market went down from 22 days in January 2023, to 9 days as of January 2024.
Overbids
Single-Family Homes
The overbid percentage has increased from 92 1% last January 2023, to 99 9% a year later
Condos & Townhomes
The overbid percentage has increased from 99.6% last January 2023, to 109.4% a year later.
Union
What's in the Unio
There were 29 single-family h providing 0.5 months of inve new listings, and 7 homes so of $1.2m. The median overbi 98.3%, with an average of 14
There were 8 condo and tow providing 1.3 months of inve new listings and 1 unit sold a of $524k. The median overbi 89.7%, with an average of 30
SFH
Single-Family Homes
20 New Listings
0.5 Months of Inventory
98.3%
Median Sale vs List
7 Sold Listings
$1.2M Median Sale Price
14 Avg Days on Market
The data, sourced from Broker Metrics, includes all single-family homes, condos and townhomes in the California Area from January 2023 to January 2024. This may include preliminary data, and may vary from the time the data was gathered. All data is deemed reliable but not guaranteed. DRE# 01345026. Copyright KW Advisors Fremont 2024. Each office is independently owned and operated.
2
New Listings
1 Sold Listing
1.3
Months of Inventory
$524K
Median Sale Price 89.7%
Median Sale vs List
30 Avg Days on Market
JANUARY 2023 - JANUARY 2024
Single-Family Homes
Last 12 months, year-over-year.
Condos & Townhomes
Last 12 months, year-over-year
Median SalesPrice
Single-Family Homes
The median sales price has decreased from $1 3m last January 2023, to $1 2m as of January 2024
Condos & Townhomes
The median sales price has increased from $475k last January 2023, to $524k as of January 2024
AVGDays OntheMarket
Single-Family Homes
The average time spent on the market went down from 17 days last January 2023, to 14 days as of January 2024
Condos & Townhomes
The average time spent on the market went down from 51 days in January 2023, to 30 days as of January 2024.
Overbids
Single-Family Homes
The overbid percentage has increased from 92% last January 2023, to 98 3% a year later
Condos & Townhomes
The overbid percentage has decreased from 92.9% last January 2023, to 89.7% a year later.
Hayward
What's in the Hayward data?
There were 103 single-family homes for sale, providing 1 month of inventory. There were 5 new listings, and 40 homes sold at a median of $895K. The median overbid percentage wa 100.8%, with an average of 26 days on the m
There were 35 condo and townhome units fo sale, providing 1.2 months of inventory. Ther were 14 new listings and 19 units sold at a m sale price of $635k. The median overbid percentage was at 101.7%, with an average o days on the market.
SFH
Single-Family Homes
56 New Listings
40 Sold Listings
1 Month of Inventory
$895K
Median Sale Price
100.8%
Median Sale vs List
26 Avg Days on Market
The data, sourced from Broker Metrics, includes all single-family homes, condos and townhomes in the California Area from January 2023 to January 2024. This may include preliminary data, and may vary from the time the data was gathered. All data is deemed reliable but not guaranteed. DRE# 01345026. Copyright KW Advisors Fremont 2024. Each office is independently owned and operated.
14
New Listings
19
Sold Listings
1.2
Months of Inventory
$635K
Median Sale Price
101.7%
Median Sale vs List
35 Avg Days on Market
JANUARY 2023 - JANUARY 2024
Single-Family Homes
Last 12 months, year-over-year.
Condos & Townhomes
Last 12 months, year-over-year
Median SalesPrice
Single-Family Homes
The median sales price has increased from $855k last January 2023, to $895k as of January 2024
Condos & Townhomes
The median sales price has decreased from $640k last January 2023, to $635k as of January 2024
AVGDays OntheMarket
Single-Family Homes
The average time spent on the market went down from 29 days last January 2023, to 26 days as of January 2024
Condos & Townhomes
The average time spent on the market went down from 61 days in January 2023, to 35 days as of January 2024.
Overbids
Single-Family Homes
The overbid percentage has increased from 93 3% last January 2023, to 100 8% a year later
Condos & Townhomes
The overbid percentage has increased from 95.9% last January 2023, to 101.7% a year later.
Castro Valley
What's in the Castro Valley data?
There were 32 single-family homes for sale, providing 1.1 months of inventory. There were 23 new listings, and 12 homes sold at a median price of $1m. The median overbid percentage was at 97 6%, with an average of 15 days on the market
There were 8 condo and townhome units for sale, providing 3 months of inventory. There were 2 new listings and 2 units sold at a median sale price of $752k. The median overbid percentage was at 98.7%, with an average of 22 days on the market.
SFH
Single-Family Homes
23 New Listings
12 Sold Listings
1.1 Months of Inventory
$1M Median Sale Price
97.6%
Median Sale vs List
15 Avg Days on Market
The data, sourced from Broker Metrics, includes all single-family homes, condos and townhomes in the California Area from January 2023 to January 2024. This may include preliminary data, and may vary from the time the data was gathered. All data is deemed reliable but not guaranteed. DRE# 01345026. Copyright KW Advisors Fremont 2024. Each office is independently owned and operated.
2 New Listings
2 Sold Listings
3 Months of Inventory $752K
Median Sale Price 98.7%
Median Sale vs List 22 Avg Days on Market
CastroValley
JANUARY 2023 -
JANUARY 2024
Single-Family Homes
Last 12 months, year-over-year.
Condos & Townhomes
Last 12 months, year-over-year
Median SalesPrice
Single-Family Homes
The median sales price has decreased from $1 05m last January 2023, to $1 02m as of January 2024
Condos & Townhomes
The median sales price has increased from $619k last January 2023, to $752k as of January 2024
AVGDays OntheMarket
Single-Family Homes
The average time spent on the market went down from 34 days last January 2023, to 15 days as of January 2024
Condos & Townhomes
The average time spent on the market went up from 0 days in January 2023, to 22 days as of January 2024.
Overbids
Single-Family Homes
The overbid percentage has increased from 94 5% last January 2023, to 97 6% a year later
Condos & Townhomes
The overbid percentage has increased from 96.1% last January 2023, to 98.7% a year later.
San Leandro
What's in the San Leandro data?
There were 55 single-family homes for sale, providing 0.7 months of inventory. There were 29 new listings, and 19 homes sold at a median price of $805k. The median overbid percentage was at 103 3%, with an average of 31 days on the market
There were 30 condo and townhome units for sale, providing 5.2 months of inventory. There were 17 new listings and 7 units sold at a median sale price of $478k. The median overbid percentage was at 96.3%, with an average of 26 days on the market.
SFH
Single-Family Homes
29 New Listings
19 Sold Listings
0.7 Months of Inventory
$805K Median Sale Price
103.3%
Median Sale vs List
31 Avg Days on Market
The data, sourced from Broker Metrics, includes all single-family homes, condos and townhomes in the California Area from January 2023 to January 2024. This may include preliminary data, and may vary from the time the data was gathered. All data is deemed reliable but not guaranteed. DRE# 01345026. Copyright KW Advisors Fremont 2024. Each office is independently owned and operated.
New Listings
7
Sold Listings
5.2
Months of Inventory
$478K
Median Sale Price 96.3%
Median Sale vs List
26
Avg Days on Market
SanLeandro
JANUARY 2023 - JANUARY 2024
Single-Family Homes
Last 12 months, year-over-year.
Condos & Townhomes
Last 12 months, year-over-year
Median SalesPrice
Single-Family Homes
The median sales price has increased from $783k last January 2023, to $805k as of January 2024
Condos & Townhomes
The median sales price has decreased from $531k last January 2023, to $478k as of January 2024
AVGDays OntheMarket
Single-Family Homes
The average time spent on the market went down from 33 days last January 2023, to 31 days as of January 2024
Condos & Townhomes
The average time spent on the market went up from 24 days in January 2023, to 26 days as of January 2024.
Overbids
Single-Family Homes
The overbid percentage has increased from 98 2% last January 2023, to 103 3% a year later
Condos & Townhomes
The overbid percentage has increased from 93% last January 2023, to 96.3% a year later.
Tri-Cities
What's in the Tri-Cities data?
There were 160 single-family homes for sale, providing 0 6 months of inventory There were 112 new listings, and 56 homes sold at a median price of $1.5m. The median overbid percentage was at 103.5%, with an average of 14 days on the market.
There were 109 condo and townhome units for sale, providing 1.7 months of inventory. There were 58 new listings and 24 units sold at a median sale price of $747k The median overbid percentage was at 100%, with an average of 20 days on the market.
SFH
Single-Family Homes
112 New Listings
56 Sold Listings
0.6 Months of Inventory
$1.5M
Median Sale Price
103.5%
Median Sale vs List
14 Avg Days on Market
The data, sourced from Broker Metrics, includes all single-family homes, condos and townhomes in the California Area from January 2023 to January 2024. This may include preliminary data, and may vary from the time the data was gathered. All data is deemed reliable but not guaranteed. DRE# 01345026. Copyright KW Advisors Fremont 2024. Each office is independently owned and operated.
58
New Listings
24 Sold Listings
1.7
Months of Inventory
$747K
Median Sale Price 100%
Median Sale vs List
20 Avg Days on Market
JANUARY 2023 - JANUARY 2024
Single-Family Homes
Last 12 months, year-over-year.
Condos & Townhomes
Last 12 months, year-over-year
Median SalesPrice
Single-Family Homes
The median sales price has increased from $1 2m last January 2023, to $1 5m as of January 2024
Condos & Townhomes
The median sales price has decreased from $825k last January 2023, to $747k as of January 2024
AVGDays OntheMarket
Single-Family Homes
The average time spent on the market went down from 28 days last January 2023, to 14 days as of January 2024
Condos & Townhomes
The average time spent on the market went down from 33 days in January 2023, to 20 days as of January 2024.
Overbids
Single-Family Homes
The overbid percentage has increased from 95 4% last January 2023, to 103 5% a year later
Condos & Townhomes
The overbid percentage has increased from 96% last January 2023, to 100% a year later.
Pleasan
What's in the Plea
There were 46 single-family h providing 1.1 months of inve new listings, and 19 homes s of $1.6m. The median overbi 94.9%, with an average of 17
There were 12 condo and tow sale, providing 0.4 months of were 10 new listings and 2 u sale price of $577k. The med percentage was at 98.4%, wi days on the market.
SFH
Single-Family Homes
29 New Listings
1.1 Months of Inventory
94.9%
Median Sale vs List
19 Sold Listings
$1.6M
Median Sale Price
17 Avg Days on Market
The data, sourced from Broker Metrics, includes all single-family homes, condos and townhomes in the California Area from January 2023 to January 2024. This may include preliminary data, and may vary from the time the data was gathered. All data is deemed reliable but not guaranteed. DRE# 01345026. Copyright KW Advisors Fremont 2024. Each office is independently owned and operated.
Condo & Townhomes
New Listings
2
Sold Listings
0.4
Months of Inventory
577K
Median Sale Price 98.4%
Median Sale vs List
12 Avg Days on Market
Pleasanton
JANUARY 2023 - JANUARY 2024
Single-Family Homes
Last 12 months, year-over-year.
Condos & Townhomes
Last 12 months, year-over-year
Median SalesPrice
Single-Family Homes
The median sales price has increased from $1 4m last January 2023, to $1 6m as of January 2024
Condos & Townhomes
The median sales price has decreased from $716k last January 2023, to $577k as of January 2024
AVGDays OntheMarket
Single-Family Homes
The average time spent on the market went down from 36 days last January 2023, to 17 days as of January 2024
Condos & Townhomes
The average time spent on the market went down from 37 days in January 2023, to 12 days as of January 2024.
Overbids
Single-Family Homes
The overbid percentage has increased from 94 0% last January 2023, to 94 9% a year later
Condos & Townhomes
The overbid percentage has increased from 95.0% last January 2023, to 98.4% a year later.
San
What's in t
There were 38 s providing 0.9 mo new listings, and of $1.6m. The m 99.3%, with an a
There were 46 c sale, providing 0 were 23 new list sale price of $73 percentage was days on the mar
SFH
Single-Family Homes
26 New Listings
15 Sold Listings
0.9 Months of Inventory
$1.6M Median Sale Price
99.3%
Median Sale vs List
19 Avg Days on Market
The data, sourced from Broker Metrics, includes all single-family homes, condos and townhomes in the California Area from January 2023 to January 2024. This may include preliminary data, and may vary from the time the data was gathered. All data is deemed reliable but not guaranteed. DRE# 01345026. Copyright KW Advisors Fremont 2024. Each office is independently owned and operated.
23
New Listings
18
Sold Listings
0.6
Months of Inventory
$730K
Median Sale Price 99.2%
Median Sale vs List 20 Avg Days on Market
Median SalesPrice
Single-Family Homes
The median sales price has increased from $1 5m last January 2023, to $1 6m as of January 2024
Condos & Townhomes
The median sales price has increased from $541k last January 2023, to $730k as of January 2024
AVGDays OntheMarket
Single-Family Homes
The average time spent on the market went down from 41 days last January 2023, to 19 days as of January 2024
Condos & Townhomes
The average time spent on the market went down from 54 days in January 2023, to 20 days as of January 2024.
Overbids
Single-Family Homes
The overbid percentage has increased from 96 3% last January 2023, to 99 3% a year later
Condos & Townhomes
The overbid percentage has increased from 93.2% last January 2023, to 99.2% a year later.
Liverm
What's in the Liver
There were 70 single-family h providing 0.8 months of inve new listings, and 23 homes s of $1.2m. The median overbi 100%, with an average of 28
There were 27 condo and tow sale, providing 1.4 months of were 21 new listings and 6 u sale price of $743k. The med percentage was at 100.4%, w days on the market.
SFH
Single-Family Homes
45 New Listings
0.8 Months of Inventory
100%
Median Sale vs List
23 Sold Listings
$1.2M
Median Sale Price
28 Avg Days on Market
The data, sourced from Broker Metrics, includes all single-family homes, condos and townhomes in the California Area from January 2023 to January 2024. This may include preliminary data, and may vary from the time the data was gathered. All data is deemed reliable but not guaranteed. DRE# 01345026. Copyright KW Advisors Fremont 2024. Each office is independently owned and operated.
21
New Listings
& Townhomes
6 Sold Listings
1.4
Months of Inventory
$743K
Median Sale Price
100.4%
Median Sale vs List
13 Avg Days on Market
Median SalesPrice
Single-Family Homes
The median sales price has increased from $1m last January 2023, to $1 2m as of January 2024
Condos & Townhomes
The median sales price has decreased from $750k last January 2023, to $743k as of January 2024
AVGDays OntheMarket
Single-Family Homes
The average time spent on the market went up from 22 days last January 2023, to 28 days as of January 2024
Condos & Townhomes
The average time spent on the market went down from 39 days in January 2023, to 13 days as of January 2024.
Overbids
Single-Family Homes
The overbid percentage has increased from 93 7% last January 2023, to 100% a year later
Condos & Townhomes
The overbid percentage has increased from 96.8% last January 2023, to 100.4% a year later.
Cupert
What's in the Cupe
There were 47 single-family h providing 3.5 months of inve new listings, and 11 homes s of $2.7m. The median overbi 93.5%, with an average of 11
There were 20 condo and tow sale, providing 1.5 months of were 11 new listings and 4 u sale price of $1.2m. The med percentage was at 102.1%, w days on the market.
SFH
Single-Family Homes
20 New Listings
3.5 Months of Inventory
93.5%
Median Sale vs List
11 Sold Listings
$2.7M
Median Sale Price
11 Avg Days on Market
The data, sourced from Broker Metrics, includes all single-family homes, condos and townhomes in the California Area from January 2023 to January 2024. This may include preliminary data, and may vary from the time the data was gathered. All data is deemed reliable but not guaranteed. DRE# 01345026. Copyright KW Advisors Fremont 2024. Each office is independently owned and operated.
New Listings
4
Sold Listings
1.5
Months of Inventory
$1.2M
Median Sale Price
102.1%
Median Sale vs List
16 Avg Days on Market
Median SalesPrice
Single-Family Homes
The median sales price has increased from $2 4m last January 2023, to $2 7m as of January 2024
Condos & Townhomes
The median sales price has increased from $0 last January 2023, to $1 2m as of January 2024
AVGDays OntheMarket
Single-Family Homes
The average time spent on the market went down from 21 days last January 2023, to 11 days as of January 2024
Condos & Townhomes
The average time spent on the market went down from 26 days in January 2023, to 16 days as of January 2024.
Overbids
Single-Family Homes
The overbid percentage has decreased from 102 5% last January 2023, to 93 5% a year later
Condos & Townhomes
The overbid percentage has increased from 0% last January 2023, to 102.1% a year later.
Oakland
What's in the Oakland data?
There were 435 single-family homes for sale, providing 2.6 months of inventory. There were 208 new listings, and 89 homes sold at a median price of $720k. The median overbid percentage was at 101%, with an average of 46 days on the market.
There were 187 condo and townhome units for sale, providing 4.2 months of inventory. There were 83 new listings and 16 units sold at a median sale price of $602k. The median overbid percentage was at 95.4%, with an average of 58 days on the market.
SFH
Single-Family Homes
208 New Listings
89 Sold Listings
2.6 Months of Inventory
$720K
Median Sale Price
101%
Median Sale vs List
46 Avg Days on Market
The data, sourced from Broker Metrics, includes all single-family homes, condos and townhomes in the California Area from January 2023 to January 2024. This may include preliminary data, and may vary from the time the data was gathered. All data is deemed reliable but not guaranteed. DRE# 01345026. Copyright KW Advisors Fremont 2024. Each office is independently owned and operated.
Listings 4.2
Months of Inventory $602K Median Sale Price 95.4%
Median Sale vs List 58 Avg Days on Market 16 Sold Listings
Median SalesPrice
Single-Family Homes
The median sales price has decreased from $750k last January 2023, to $720k as of January 2024
Condos & Townhomes
The median sales price has increased from $579k last January 2023, to $602k as of January 2024
AVGDays OntheMarket
Single-Family Homes
The average time spent on the market went up from 40 days last January 2023, to 46 days as of January 2024
Condos & Townhomes
The average time spent on the market went up from 40 days in January 2023, to 58 days as of January 2024.
Overbids
Single-Family Homes
The overbid percentage has increased from 99 9% last January 2023, to 101% a year later
Condos & Townhomes
The overbid percentage has increased from 93.9% last January 2023, to 95.4% a year later.